Gabrielle has a historic impact in the north, warm in the south
|
Rainfall |
February rainfall was nothing short of exceptional in the North Island. Above normal (120-149% of normal) or well above normal (>149% of normal) rainfall was observed across most of the North Island, eastern Marlborough, northern and middle Canterbury, and parts of the central and lower West Coast, and inland Otago. Parts of southern Northland, Auckland, Gisborne, Hawke’s Bay, and coastal Wairarapa received at least 400% of the normal February rainfall. Rainfall was below normal (50-79% of normal) along parts of the northern West Coast, inland Canterbury, and coastal Otago, with an area of well below normal rainfall (<50% of normal) in Fiordland. |
|
Temperature |
Temperatures were above average (0.51-1.20°C above average) or well above average (>1.20°C above average) across the majority of the South Island and the western and lower North Island. For the Mackenzie Basin, North Canterbury, and the northern and eastern North Island, temperatures were generally near average (±0.50°C of average). |
|
Soil Moisture |
At the end of February, soil moisture levels were well above normal across most of the North Island and in parts of Marlborough and Canterbury for the time of year. Soil moisture levels in the northern West Coast, western Tasman, the Mackenzie Basin, and Southland were below normal. Near normal soil moisture was found elsewhere. |
Overview
February 2023 will go into the record books as a month during which Aotearoa New Zealand experienced one of its worst weather disasters in modern history, by way of an ex-tropical cyclone.
On 13-14 February, Cyclone Gabrielle (Figure 3) passed just offshore of the northern North Island, exposing much of the island to extreme rainfall and river flooding not seen in many years, catastrophic wind damage, and substantial storm surge. Unfortunately, this culminated in widespread destruction to agricultural and horticultural lands, dozens of impassable roads, severe coastal erosion, the country’s third-ever national state of emergency declaration, and loss-of-life. The most significant damage occurred in Northland, Auckland, the Coromandel Peninsula, Gisborne, Hawke’s Bay, and east-coastal Manawatū-Whanganui. The recovery from this storm is expected to take years and be very costly, particularly along the North Island’s east coast.
Among other storms, Cyclone Gabrielle will be remembered alongside Cyclone Bola (1988), Gisele (1968), and the “Cyclone of 1936” for its historically significant impact. The available meteorological data supports this comparison. In addition to the numerous rainfall records and near-records contained within this summary, 14 February, the day on which Gabrielle was closest to New Zealand, was the North Island’s second lowest “pressure day” on record (using all available climate station data since 1960). [Pressure Day = The lowest air pressure observed on any given day]
At 4:00 a.m. on 14 February, NIWA’s climate station at Whitianga reported a minimum mean sea level pressure of 968 hPa (Figure 4), which, since at least 1960, was surpassed only by pressure observations during the 26 July 2008 storm in the North Island. This low air pressure reading helps contextualise the strength of the cyclone, which reintensified as it approached the northern North Island. As with Gabrielle, reintensification can happen when former tropical cyclones interact with the mid-latitude jet stream and/or other atmospheric disturbances, leading to a widening of the zone of impact.
As a point of comparison, Bola had a minimum central pressure around 980 hPa[1], Gisele 964 hPa[2], and “Cyclone of 1936” 970 hPa[3] based on available records. While Bola wasn’t as intense as Gabrielle from a pressure perspective, it came with an impact that was drawn out over several days whereby the storm’s southward progression was blocked by a ridge of high pressure. The worst of Gabrielle’s rain, wind, and surge was confined to a 24-hour window for most regions. Figure 5 (in Highlights and extreme events section) shows the air pressure patterns that were associated with Gabrielle, Bola, and Gisele in the Southwest Pacific. Based on this analysis, guided by ECMWF ERA5, Gabrielle was one of the most intense storms to pass near New Zealand’s coastlines since at least 1950[4].
Gabrielle occurred amidst a unique set of climate drivers – specifically, a “triple dip” (third consecutive) La Niña, which, although its strength was waning, continued to have a meaningful influence on New Zealand’s weather patterns. Notably, seasonal sea surface temperature (SST) anomalies in the Coral Sea, where Gabrielle formed, were 0.5˚C to 1.5˚C above average. Sub-surface waters were unusually warm by a similar magnitude. This abnormally warm water sat along the periphery of La Niña’s “West Pacific Warm Pool” and was fuel for Gabrielle’s development. In the atmosphere, a pulse of the Madden-Julian Oscillation, or area of cloud and thunderstorm activity that circumnavigates the globe every 30-60 days, was active over the warm waters of the west-central Pacific during the first half of February. This contributed to more favourable environmental conditions for tropical cyclone development in the Southwest Pacific.
Monthly mean sea level pressure, as shown in Figure 1, was below normal across the country, producing frequently cyclonic air flows from the easterly quarter. This was consistent with the widespread heavy rainfall and excess cloud cover that was experienced in the North Island and northern South Island.

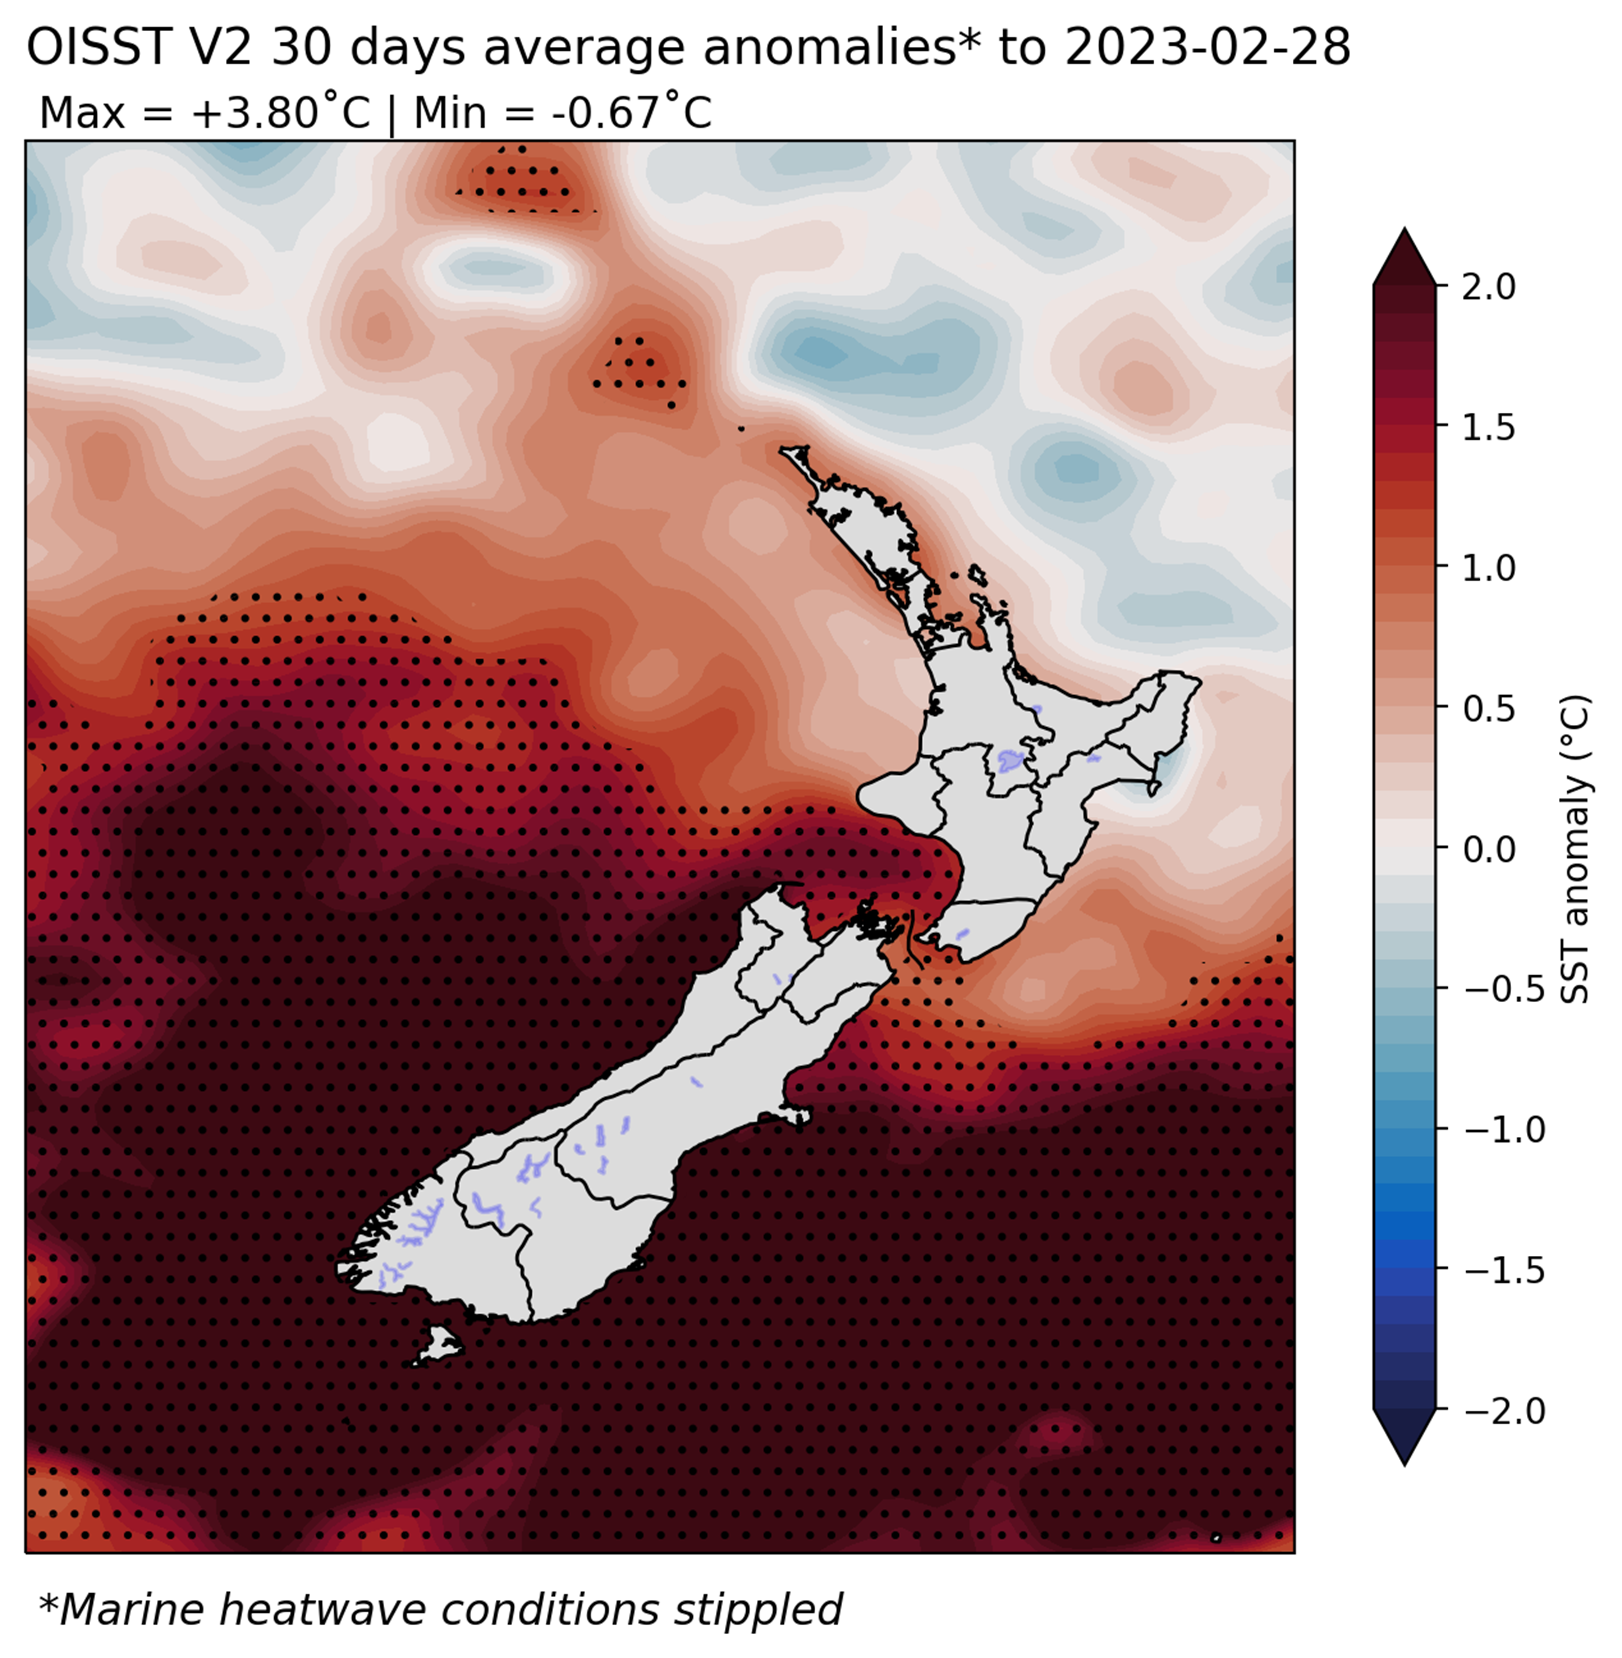
A marine heatwave persisted near the South Island during February (Figure 1). Monthly SSTs were record breaking (since at least 1982) in the west of the South Island, with a regional anomaly of +2.9˚C. SSTs around the North Island were above average, ranging from +0.4˚C in the east to 1.2˚C in the west.
NIWA scientists are contributing to an attribution study on the influence that climate change had on Gabrielle. More details will likely become available in the next month or two.
The highlights and extreme events section details Gabrielle’s journey from a severe tropical cyclone in the Coral Sea to an ex-tropical cyclone that passed near New Zealand’s coast.
NZ 30-day coastal SST anomalies
(to 28 February 2023)
|
North NI |
+0.49˚C |
|
West NI |
+1.15˚C |
|
East NI |
+0.36˚C |
|
North SI |
+1.65˚C |
|
West SI |
+2.88˚C |
|
East SI |
+2.20˚C |
Although Cyclone Gabrielle was the weather focal point of the month, Aucklanders awakened to another round of flooding on 1 February, just days after the record floods of late-January.
Meanwhile, parts of the South Island saw dryness intensify, in direct contrast to the sodden north. During mid-February, meteorological drought developed in south-east Otago according to NIWA’s New Zealand Drought Index. At the time, parts of Tasman, the West Coast, the rest of Otago, Southland, Rakiura Stewart Island, South Canterbury, Banks Peninsula, and inland Marlborough were all experiencing moderately to extremely dry conditions. Although a cold front brought heavy rain to these regions on 21-22 February, more rain was needed to fully alleviate the dryness and drought.
Adding insult to injury, the month finished with yet another round of flooding in the northern and eastern North Island. In southern Northland and northern Auckland on 24 February, a stalled front contributed to an environment that was conducive to slow-moving downpours and thunderstorms. Then, on 28 February, a sub-tropical low caused further flooding in Gisborne and Hawke’s Bay.
Similar to January, rainfall extremes were in abundance during February 2023. There were several events that delivered more than a typical month’s worth of rain to multiple regions. Parts of southern Northland, Auckland, Gisborne, Hawke’s Bay, coastal Wairarapa, and parts of Canterbury all received at least 400% of the normal February rainfall.
Rainfall was below normal (50-79% of normal) along parts of the northern West Coast, inland Canterbury, and coastal Otago, with an area of well below normal rainfall (<50% of normal) in Fiordland.
Temperatures were above average (0.51-1.20°C above average) or well above average (>1.20°C above average) across the majority of the South Island and the western and lower North Island. The nationwide average temperature in February 2023 was 18.5°C. This was 1.1°C above the 1991-2020 February average from NIWA’s seven station temperature series which begins in 1909, and New Zealand’s 10th-warmest February on record.
Further highlights (from stations available in NIWA’s National Climate Database):
- The highest temperature was 35.6°C, observed at Middlemarch on 4 February.
- The lowest temperature was -0.4°C, observed at Manapouri (Airport) on 24 February.
- The highest 1-day rainfall was 316 mm, recorded at Tūtira (Hawke’s Bay) on 13 February.
- The highest wind gust was 150 km/h, observed at Mokohinau on 12 February.
- Of the six main centres in February 2023, Auckland was the warmest, Tauranga was the wettest, Wellington was the least sunny, and Dunedin was the coolest, driest and sunniest.
- Of the available, regularly reporting sunshine observation sites, the sunniest four locations so far in 2023 are Central Otago (562.6 hours), West Coast (548.6 hours), Mackenzie Basin (545.4 hours), and Queenstown Lakes District (526.7 hours).
February 2023 Climate Summary infographic

[1] From NIWA’s New Zealand Historic Weather Events Catalogue
[2] Michael J. Revell & Richard M. Gorman (2003) The “Wahine storm”: Evaluation of a numerical forecast of a severe wind and wave event for the New Zealand coast, New Zealand Journal of Marine and Freshwater Research, 37:2, 251-266, DOI: 10.1080/00288330.2003.9517163
[3] Stephens, S.A., Reeve, G., Bell, R.G. (2009) Modelling of the 2 February 1936 Storm tide in Wellington Harbour. NIWA Client Report HAM-2009-014.
[4] Reanalysis combines model data with observations from across the world into a globally complete and consistent dataset using the laws of physics.
Download
February 2023 Climate Summary [PDF 367KB]
Climate Statistics February 2023 [PDF 156 KB]