New Zealand’s equal 2nd warmest March on record
|
Temperature |
It was New Zealand’s equal 2nd warmest March on record. The nationwide average temperature in March 2019 was 17.6°C. Temperatures were above average (0.51°C to 1.2°C above average) or well above average (>1.2°C above average) across the entire country. Many locations observed record or near-record warm mean, mean maximum or mean minimum March temperatures. |
|
Rainfall |
Rainfall was below normal (50-79% of normal) or well below normal (<50% of normal) across much of the North Island. The only exceptions were parts of Taranaki and the Central Plateau along with the Kapiti Coast and Wellington City which observed near normal (80-120% of normal) or above normal (120-149% of normal) rainfall. In the South Island, rainfall was generally above normal or well above normal (>150% of normal) in the west and far north, while the east and far south observed below to well below normal rainfall. |
|
Soil Moisture |
As of 1 April, drier than normal soils were present across the majority of the North Island and a large portion of the South Island. Conversely, soil moisture levels were slightly higher than normal in northern Marlborough and Tasman, along with the West Coast, and parts of Otago. Meteorological drought conditions (as defined by the NZ Drought Index) were present in Western Bay of Plenty as of 30 March. |
Overview
March 2019 was characterised by higher than normal mean sea level pressure over and to the east of New Zealand. This pressure set up led to more northeasterly winds than normal across the country. Warmer than average sea surface temperatures persisted throughout March and marine heatwave conditions continued in the Tasman Sea and in parts of New Zealand’s coastal waters.
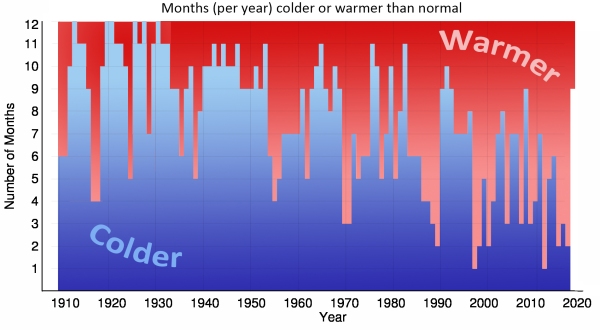
March was a very warm month with temperatures above average (0.51°C to 1.2°C above average) or well above average (>1.2°C above average) across the entire country. Overall, the month ranked as the equal 2nd warmest March on record (equal to March 1999). The nationwide average temperature was 17.6°C (1.9°C above the 1981-2010 March average from NIWA’s seven station temperature series which began in 1909). Many locations observed record or near-record warm mean, mean maximum or mean minimum March temperatures. New Zealand has not experienced a nationwide monthly mean temperature that was below average (0.51˚C to 1.20˚C below the 1981-2010 average) in 26 months or since January 2017.
March was a dry month for many locations, although extremely heavy rainfall occurred in the western South Island on March 25-27. The weather event was a mix of an ‘atmospheric river' extending from Australian cyclones coupled with extra energy from the Tasman Sea marine heatwave, as well as a strong low-pressure system siphoning moisture toward New Zealand (refer to the Highlights and extreme events section for additional details).
( Atmospheric rivers are relatively long, narrow corridors in the atmosphere that transport most of the water vapour outside of the tropics. According to the American Meteorological Society, integrated vapour transport (from Earth’s surface to about 9000 m) must be at least 250 kgm-1s-1 along the periphery of the moisture plume to be considered an atmospheric river.)
Further Highlights:
- The highest temperature was 32.4°C, observed in Waipara West on 5 March.
- The lowest temperature was -1.5°C, observed in Hanmer Forest on 1 March.
- The highest 1-day rainfall was 401.0 mm, recorded at Milford Sound on 25 March.
- The highest wind gust was 139 km/h, observed at Cape Turnagain on 14 March.
- Of the six main centres in March 2019, Auckland was the warmest, Dunedin was the coolest, driest and sunniest, Wellington was the wettest, and Christchurch was the least sunny.
Of the available, regularly reporting sunshine observation sites, the sunniest four regions in 2019 are Wider Nelson (857 hours), Marlborough (833 hours), Bay of Plenty (819) and Taranaki (819 hours).
Download
Climate Summary March 2019 [5MB PDF]
Climate statistics March 2019 [70KB PDF]


