Outlook Summary
- ENSO neutral conditions continued during January 2020. The Southern Oscillation Index (SOI) was well within the neutral range while sea surface temperatures (SSTs) remained on the El Niño side of neutral.
- Oceanic ENSO neutral will most likely persist (68% chance) over the next three months.
- The primary climate driver during February-April is expected to be a warm pool of ocean water in the west-central Pacific Ocean since the Indian Ocean Dipole (IOD) dissipated.
- Increasing coastal sea surface temperatures (SSTs) are also expected to influence New Zealand’s air temperatures in a warmer direction over the coming three months.
- For New Zealand, the change in climate drivers will most likely be associated with a change in circulation patterns and an increasing threat for periodic, heavy rainfall events, especially in the North Island. High humidity may also be a factor.
- February – April 2020 air pressure is forecast to be lower than normal to the north and higher than normal to the southeast of New Zealand. This is expected to be associated with mixed westerly and northeasterly quarter air flow anomalies.
- Temperatures are expected to be near or above average for all regions of New Zealand except the north of the North Island where above average temperatures are most likely.
- Rainfall is expected to be near normal in all regions of New Zealand except for the east of the South Island where normal or below normal rainfall is about equally likely.
- The tropics to the north of New Zealand may have an increase in activity during mid-February. For the current tropical cyclone season (to April 2020), the risk for New Zealand is near normal. On average, one ex-tropical cyclone passes near the country each year. Significant rainfall, damaging winds, and coastal damage can occur during these events.
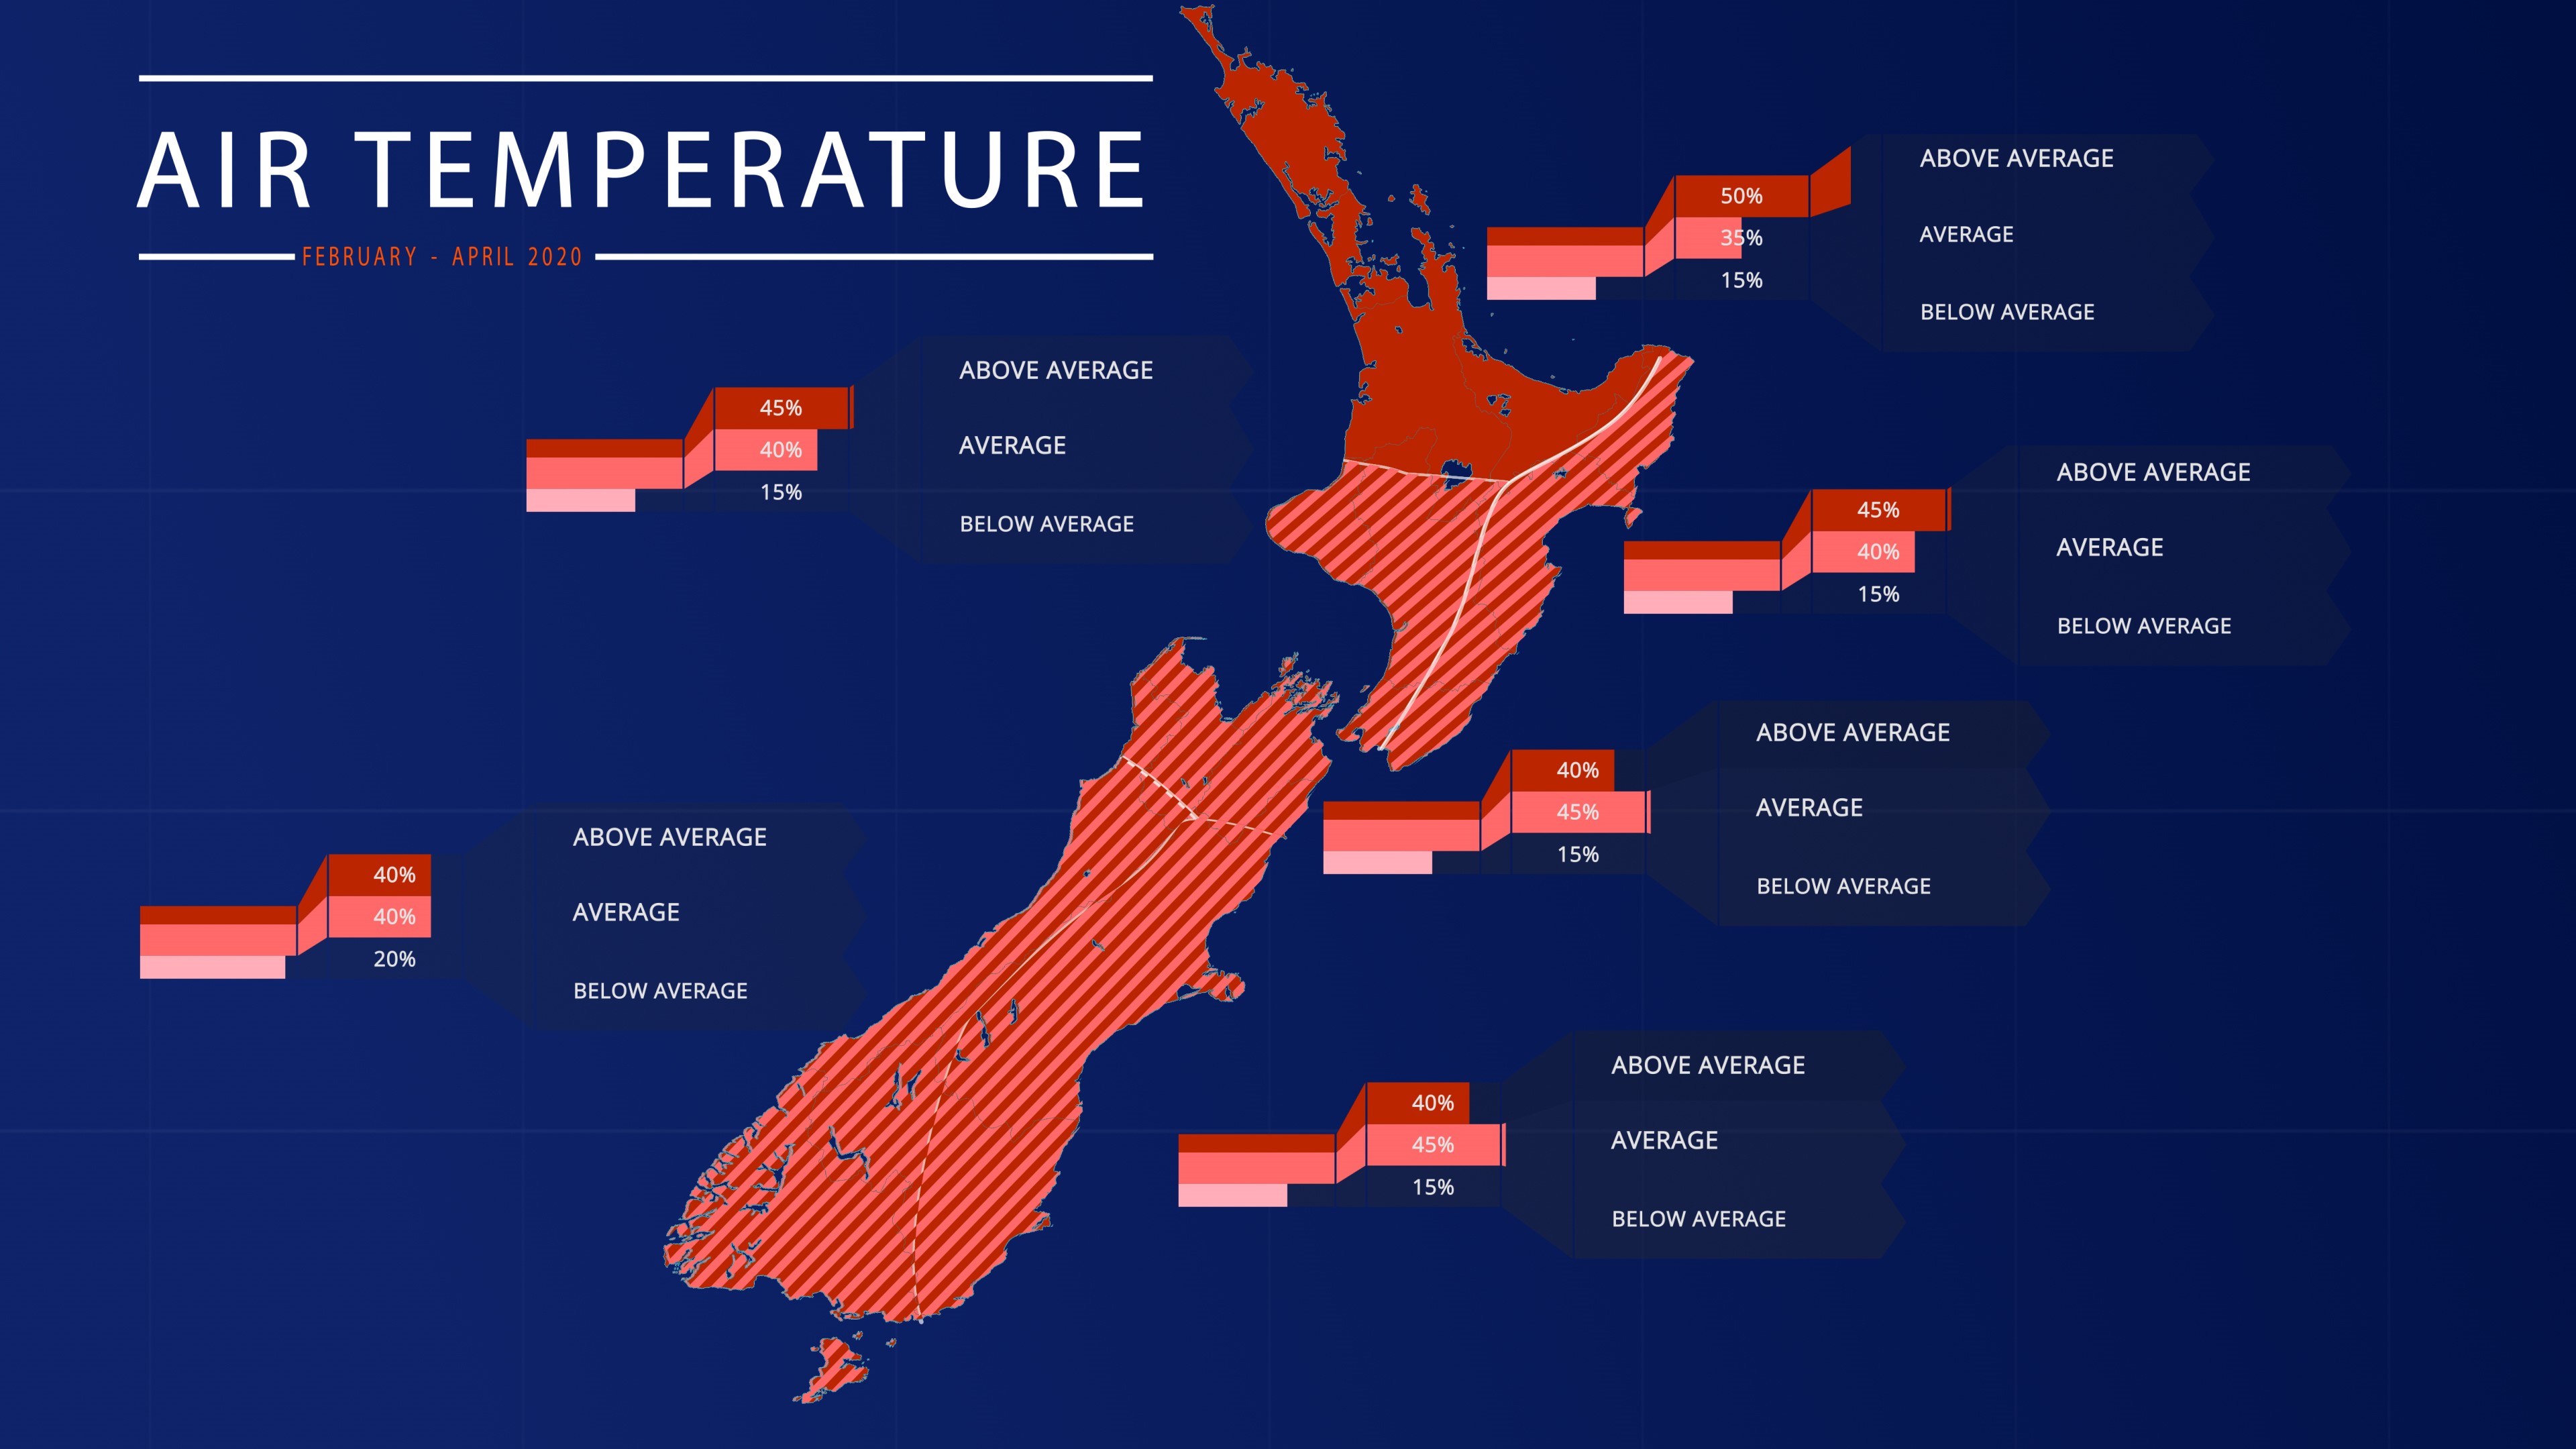
Air temperature
February – April 2020 temperatures are about equally likely to be near average (40-45% chance) or above average (40-45% chance) in all regions of New Zealand except the north of the North Island where above average temperatures are most likely (50% chance).
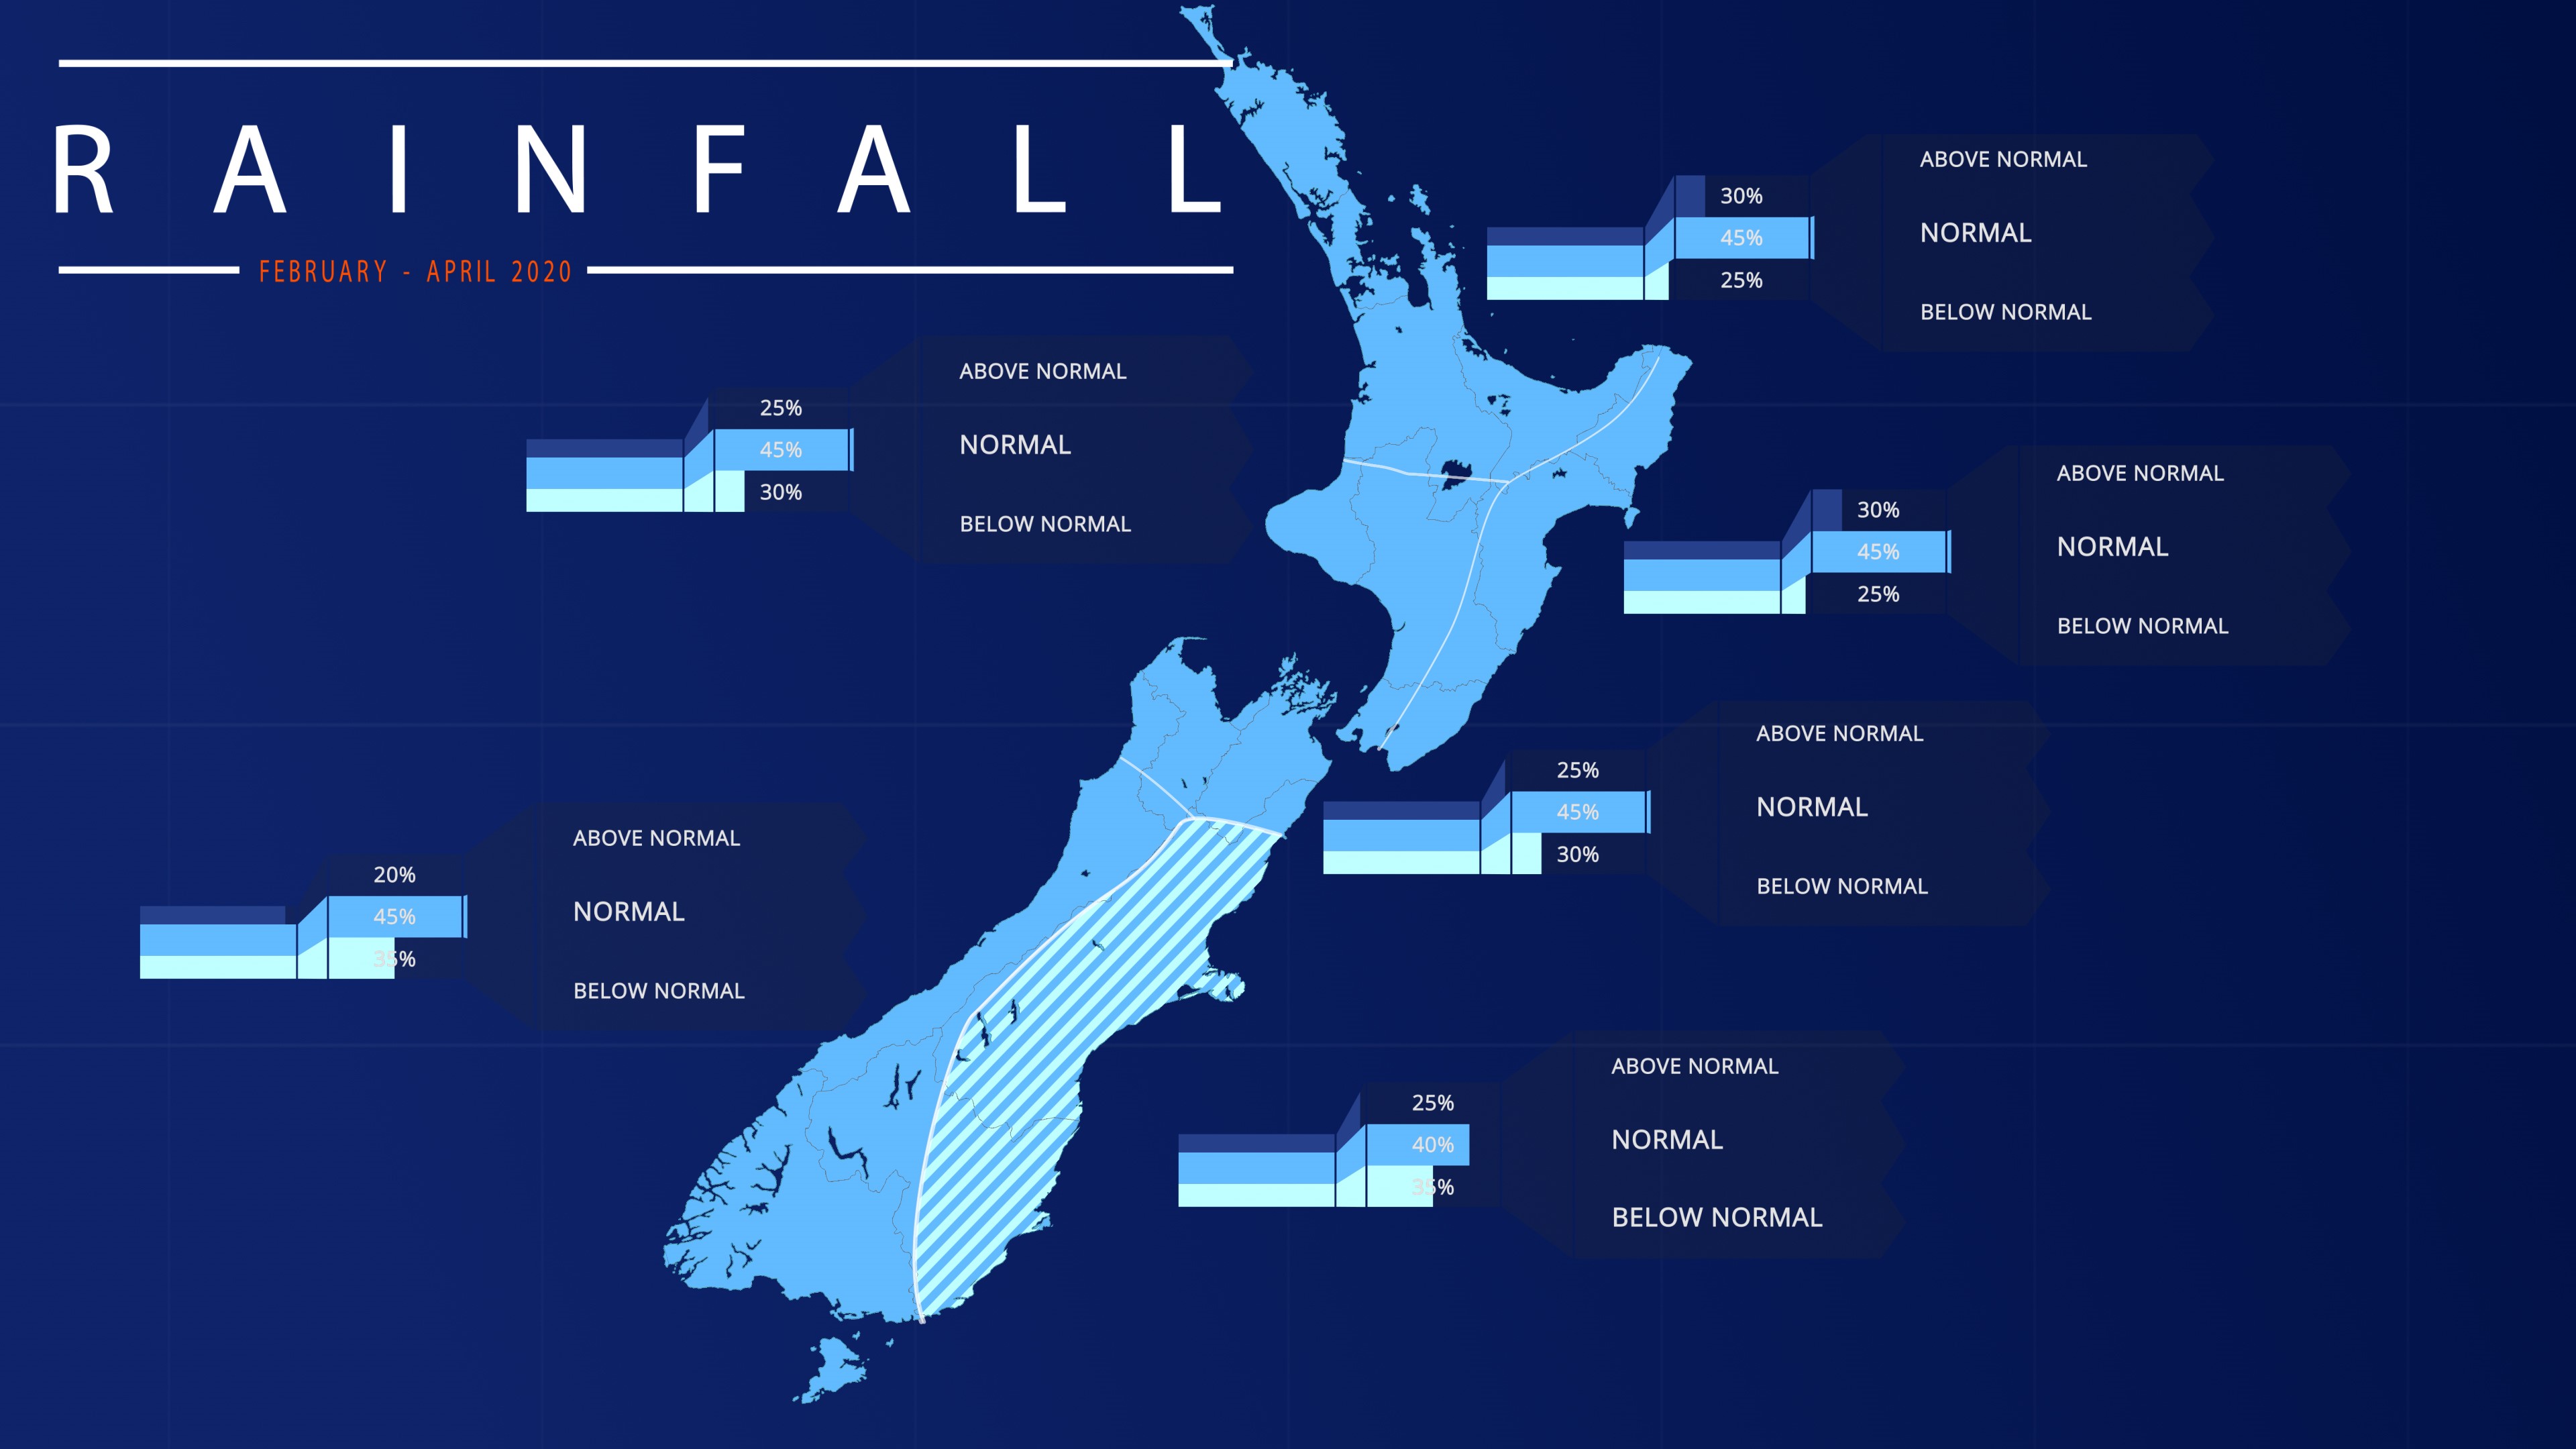
Rainfall
February – April 2020 rainfall is most likely to be near normal (45% chance) in all regions of New Zealand except for the east of the South Island where normal (40% chance) or below normal (35% chance) rainfall is about equally likely. During periodic, northeasterly air flow patterns, the north and east of the North Island may be exposed to moist and humid conditions from the sub-tropics. This pattern may also be associated with significant rainfall events.
Soil moisture
February – April 2020 soil moisture levels and river flows are most likely to be below normal (45-50% chance) in the north of the North Island and west and east of the South Island, about equally likely to be near normal (40% chance) or below normal (35% chance) in the west and east of the North Island, and near the climatological value in the north of the South Island.
Regional predictions for February – April 2020
Northland, Auckland, Waikato, Bay of Plenty
The table below shows the probabilities (or percent chances) for each of three categories: above average, near average, and below average. In the absence of any forecast guidance there would be an equal likelihood (33% chance) of the outcome being in any one of the three categories. Forecast information from local and global guidance models is used to indicate the deviation from equal chance expected for the coming three-month period, with the following outcomes the most likely (but not certain) for this region:
- Temperatures are most likely to be above average (50% chance).
- Rainfall totals are most likely to be near normal (45% chance).
- Soil moisture levels and river flows are most likely to be below normal (45% chance).
The full probability breakdown is:
|
Temperature |
Rainfall |
Soil moisture |
River flows |
|
|
Above average |
50 |
30 |
25 |
20 |
|
Near average |
35 |
45 |
30 |
35 |
|
Below average |
15 |
25 |
45 |
45 |
Central North Island, Taranaki, Whanganui, Manawatu, Wellington
Probabilities are assigned in three categories: above average, near average, and below average.
- Temperatures are about equally likely to be near average (40% chance) or above average (45% chance).
- Rainfall totals are most likely to be near normal (45% chance).
- Soil moisture levels and river flows are about equally likely to be near normal (40% chance) or below normal (35% chance).
The full probability breakdown is:
|
Temperature |
Rainfall |
Soil moisture |
River flows |
|
|
Above average |
45 |
25 |
25 |
25 |
|
Near average |
40 |
45 |
40 |
40 |
|
Below average |
15 |
30 |
35 |
35 |
Gisborne, Hawke’s Bay, Wairarapa
Probabilities are assigned in three categories: above average, near average, and below average.
- Temperatures are about equally likely to be near average (40% chance) or above average (45% chance).
- Rainfall totals are most likely to be near normal (45% chance).
- Soil moisture levels and river flows are about equally likely to be near normal (40% chance) or below normal (35% chance).
The full probability breakdown is:
|
Temperature |
Rainfall |
Soil moisture |
River flows |
|
|
Above average |
45 |
30 |
25 |
25 |
|
Near average |
40 |
45 |
40 |
40 |
|
Below average |
15 |
25 |
35 |
35 |
Tasman, Nelson, Marlborough, Buller
Probabilities are assigned in three categories: above average, near average, and below average.
- Temperatures are about equally likely to be near average (45% chance) or above average (40% chance).
- Rainfall totals are most likely to be near normal (45% chance).
- Soil moisture levels and river flows are most likely to be near the climatological value.
The full probability breakdown is:
|
Temperature |
Rainfall |
Soil moisture |
River flows |
|
|
Above average |
40 |
25 |
30 |
30 |
|
Near average |
45 |
45 |
35 |
35 |
|
Below average |
15 |
30 |
35 |
35 |
West Coast, Alps and foothills, inland Otago, Southland
Probabilities are assigned in three categories: above average, near average, and below average.
- Temperatures are about equally likely to be near average (40% chance) or above average (40% chance).
- Rainfall totals are most likely to be near normal (45% chance).
- Soil moisture levels and river flows are most likely to be below normal (45-50% chance).
The full probability breakdown is:
|
Temperature |
Rainfall |
Soil moisture |
River flows |
|
|
Above average |
40 |
20 |
20 |
20 |
|
Near average |
40 |
45 |
30 |
35 |
|
Below average |
20 |
35 |
50 |
45 |
Coastal Canterbury, east Otago
Probabilities are assigned in three categories: above average, near average, and below average.
- Temperatures are about equally likely to be near average (45% chance) or above average (40% chance).
- Rainfall totals are about equally likely to be near normal (40% chance) or below normal (35% chance).
- Soil moisture levels and river flows are most likely to be below normal (50% chance).
The full probability breakdown is:
|
Temperature |
Rainfall |
Soil moisture |
River flows |
|
|
Above average |
40 |
25 |
20 |
20 |
|
Near average |
45 |
40 |
30 |
30 |
|
Below average |
15 |
35 |
50 |
50 |
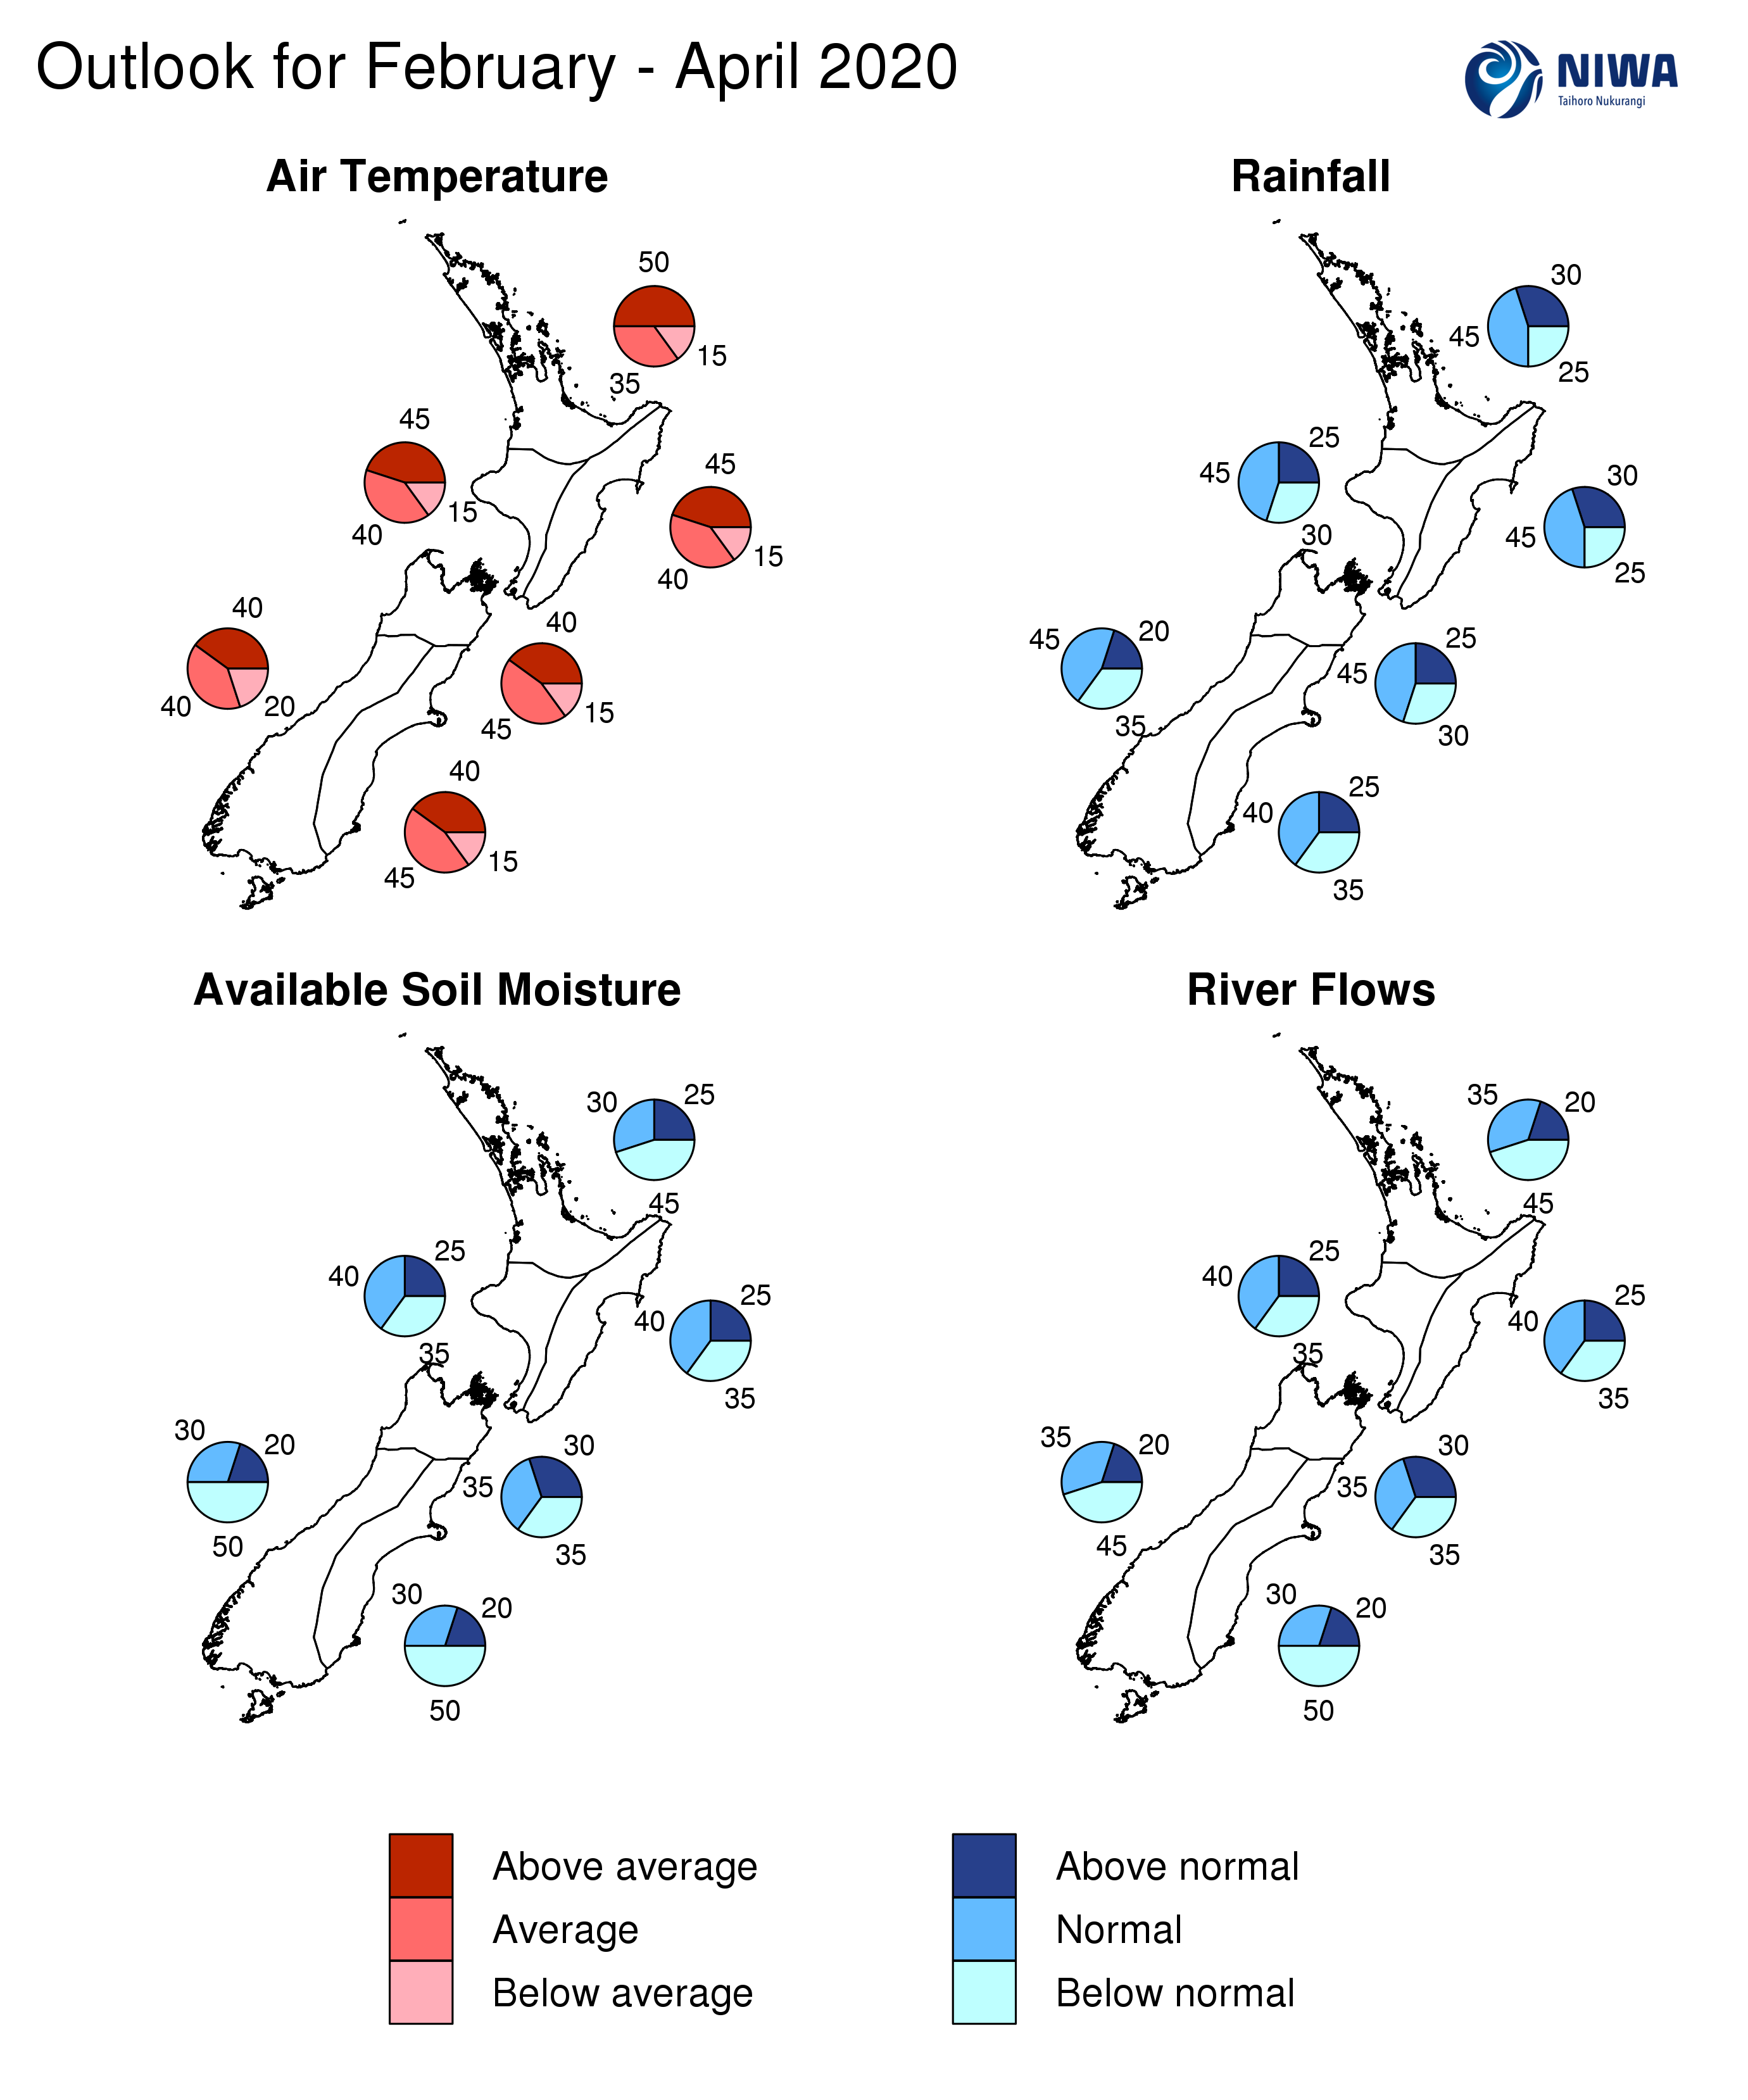
Graphical representation of the regional probabilities
Background
The NINO3.4 Index anomaly (in the central Pacific) for the month of January was +0.45˚C. The warmest ocean waters with respect to average continued to be located in the west-central Pacific, with the NINO4 region recording a monthly value of +0.82˚C.
During January 2020, upper-oceanic heat content remained above average near the International Dateline, as it has for much of the past year. The warmest SSTs (29-31˚C) on the globe are located in this region and therefore anomalous rainfall and convection is expected over the upcoming three month period. Overall, this was indicative of oceanic ENSO neutral conditions that leaned toward El Niño Modoki.
Trade winds were weaker than normal near and west of the International Dateline during January, allowing the west-central Pacific warm pool of ocean water to persist. During February, stronger than normal trade winds are forecast to develop in the eastern and central Pacific, which may lead to cooling of SSTs in that region.
According to the consensus from international models, ENSO-neutral conditions are most likely (68% chance) for the February – April period. For the May – July period, the probability for ENSO-neutral conditions is 64%. The probability of La Niña increases to 30% in August-October although ENSO-neutral remains the most likely outcome.
New Zealand’s coastal water temperatures were largely cooler than average during January 2020. Overall, these were the coolest SSTs (with respect to average) since January 2017. The cool seas were the result of strong, southwesterly winds during the first half of January, which contributed to upwelling (churning of the cooler sub-surface sea water up to the surface). A late-month spell of heat led to a rapid warming of SSTs which is expected to continue into early February. With periodic northeasterly winds during the next three months, coastal SSTs may remain above average into autumn.
New Zealand Coastal Sea Surface Temperatures during January 2020
|
North NI |
West NI |
East NI |
North SI |
West SI |
East SI |
|
-0.48˚C |
-0.89˚C |
+0.18˚C |
-0.46˚C |
-0.65˚C |
+0.37˚C |
The Southern Annular Mode (SAM) was negative to start the month of January and was associated with cool, southwesterly winds in New Zealand. For the rest of the month, the index alternated between positive and negative values. This variability is expected to continue for the first half of February. The tropics to the north of New Zealand may have more of an influence on the local climate than the SAM during the upcoming three months.
The Madden Julian Oscillation (MJO) was active over the Maritime Continent and western Pacific during January (phases 4-7). The MJO is expected to progress through the same phases during mid-February. The typical rainfall anomalies for these phases during February include an increased chance for rainfall in the north and east of the North Island along with near or above average temperatures. The MJO may be convectively active in phases 4-7 several times from February-April in association with the warm pool of ocean water in the west-central Pacific.
The Indian Ocean Dipole (IOD) is now in the neutral range (latest weekly value: -0.01, Australian Bureau of Meteorology). Its role as a climate driver has dissipated.
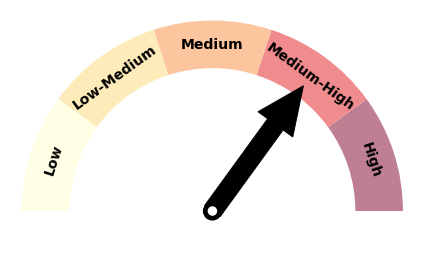
Forecast Confidence
Temperature
|
Forecast confidence for temperature is medium to high. Coastal sea surface temperatures have increased significantly during late January and are expected to continue to rise into February, which will have an influence on air temperatures over land. There is also strong model agreement that cooler than average temperatures are unlikely. |
Rainfall
|
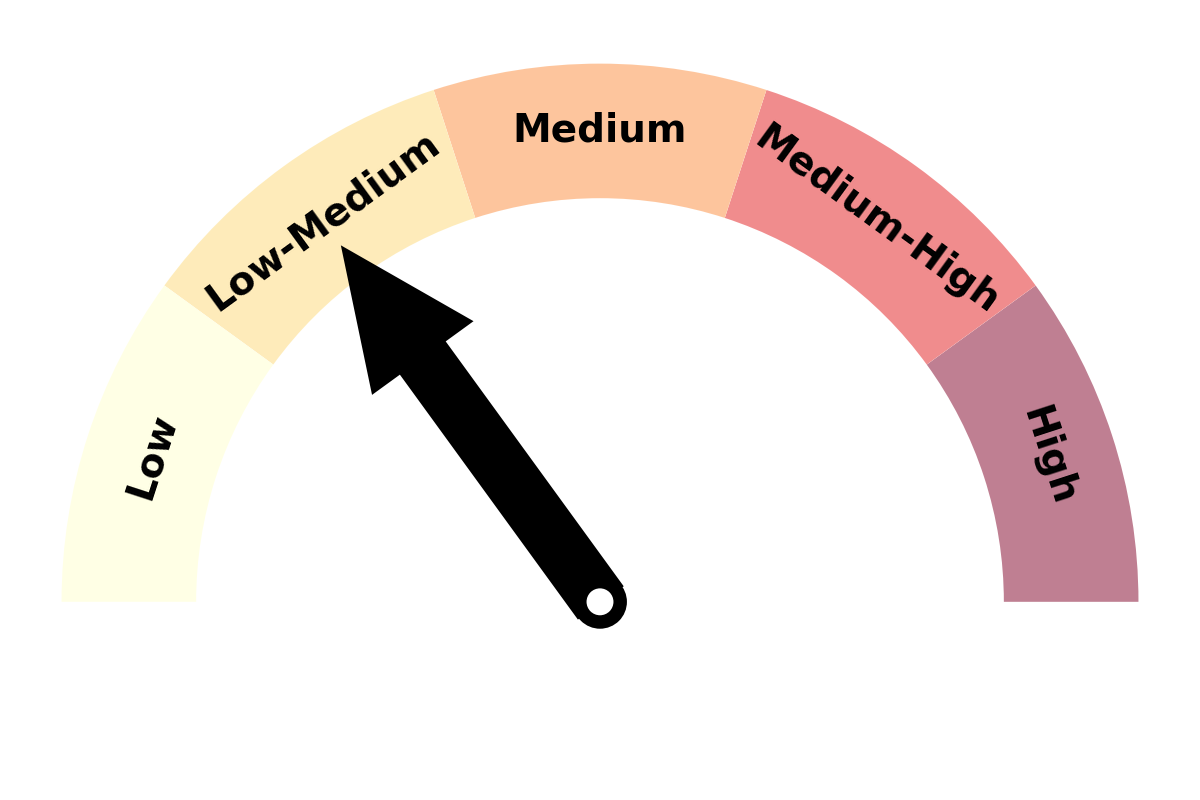
|
Forecast confidence for rainfall is low to medium. The lack of strong climate drivers (fading IOD, ENSO-neutral, variable SAM) makes this a particularly challenging forecast, although the emergence of rainfall and convection in the tropical western Pacific has historically coincided with an increase in moist, northerly air flows for New Zealand. |
Download
Download the Seasonal Climate Outllook for February - April 2020
