Outlook Summary
- Weak La Niña conditions persist in the tropical Pacific but are on a weakening trend.
- The traditional Southern Oscillation Index (SOI) was on the La Niña side of neutral in January 2026.
- The Equatorial SOI (measuring the difference in atmospheric pressure between the eastern Pacific and Indonesia between 5oN and 5oS) was in the neutral range in January 2026 and convection and trade wind anomalies continued to reflect weak La Niña conditions.
- The Relative Oceanic Niño Index (RONI) continued to weaken in January 2026.
- This weakening of La Niña conditions is expected to accelerate in the coming months, with about an 80% chance for ENSO-neutral (El Niño – Southern Oscillation) conditions to return by the end of the forecast period.
- For the next three month period as a whole, the atmospheric circulation pattern over New Zealand is expected to see anomalous high pressure to the south of the country, and anomalous low pressure just to the north, leading to an easterly quarter flow anomaly overall.
- Slow-moving high pressure systems early in February should bring periods of traditional summer conditions to many parts of the country, interrupted by some shorter unsettled spells.
- From about mid-February, the risk of tropical incursions may increase again. Further settled conditions may occur in the remainder of March, but overall rainfall anomalies could be heavily skewed if a single significant event occurs. A dramatic pattern change is not anticipated in April, with rainfall events most likely to come from the north, contrasting with high pressure systems still bringing periods of settled conditions. · The Tropical Cyclone Outlook for the November 2025 – April 2026 southwest Pacific Tropical
- Cyclone (TC) season indicates a normal or elevated risk for ex-TC interaction for New Zealand. Although the season has been quiet so far, the peak risk for northern New Zealand is typically late summer and early autumn.
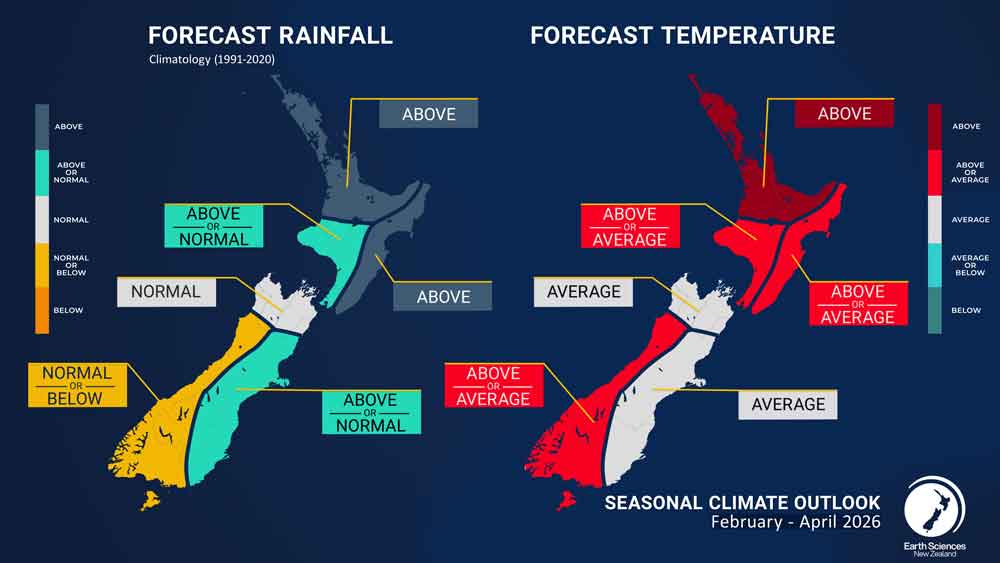
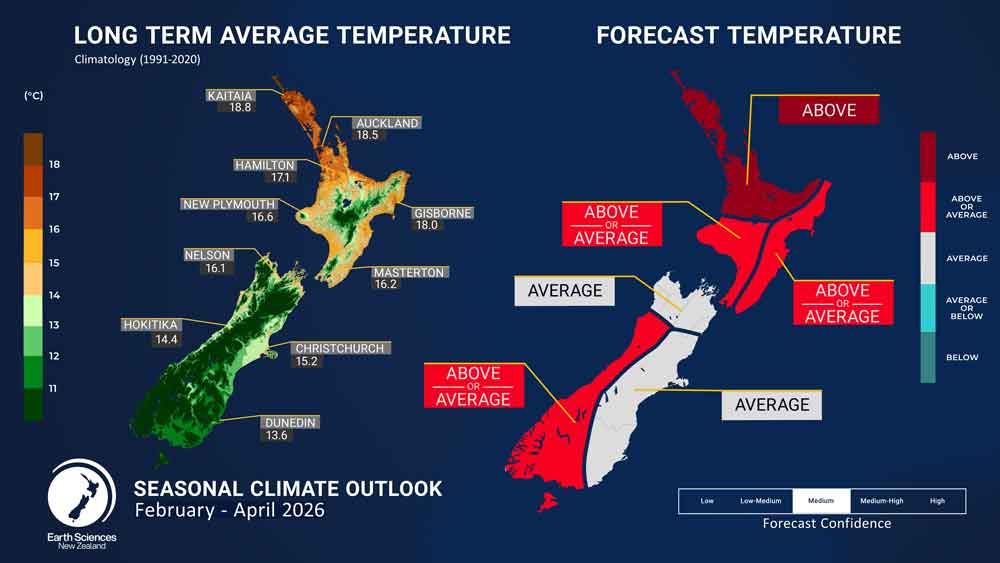
- Seasonal air temperatures for February – April 2026 are most likely to be above average for the north of the North Island, near average or above average for the rest of the North Island and the west of the South Island, and near average in the north and east of the South Island.
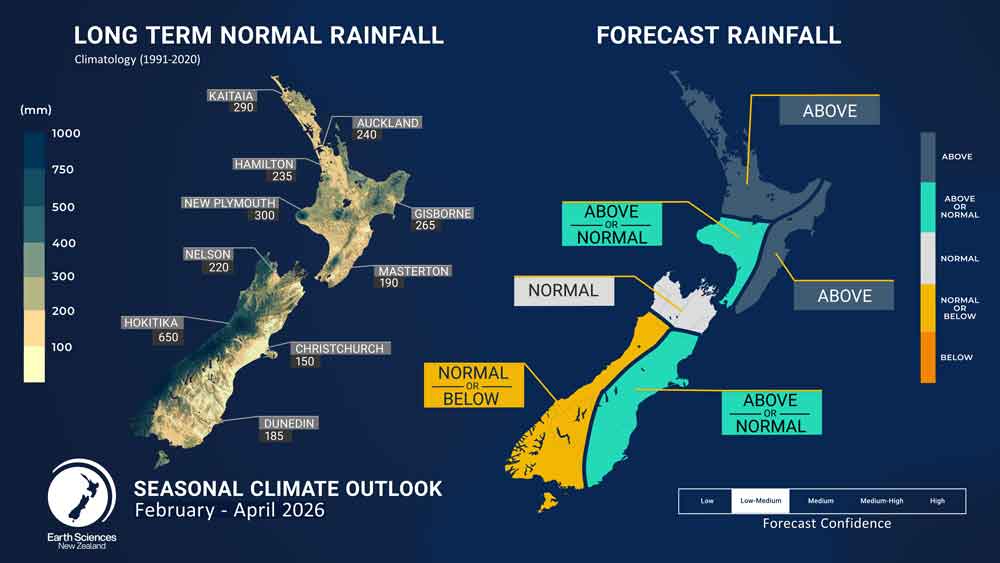
- February – April rainfall totals are most likely to be above normal for the north and east of the North Island, near normal or above normal for the west of the North Island and the east of the South Island, near normal or below normal for the west of the South Island, and near normal for the north of the South Island. As the season progresses, the risk for weather systems connected to the tropics and subtropics increases and could lead to significant rainfall events, especially for the North Island.
- During February – April 2026, soil moisture levels and river flows are forecast to be near normal or above normal for the north and east of the North Island and the east of the South Island. Near normal soil moisture levels and river flows are forecast for the west of the North Island. For the west of the South Island, river flows are about equally likely to be below normal or near normal, while near normal soil moisture levels are forecast. Near normal river flows are forecast for the north of the South Island, while near normal or above normal soil moisture levels are expected for the same region.
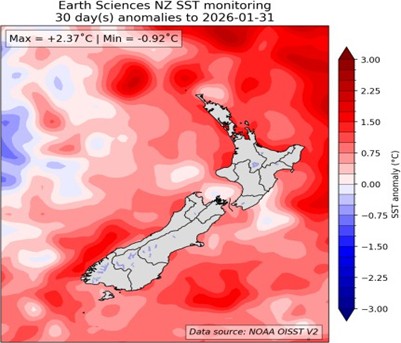
- Sea Surface Temperatures (SSTs) around New Zealand have cooled significantly due to the enhanced wind stress associated with the deep low pressure areas that affected the region in January, and marine heatwave conditions are no longer present in coastal waters. This recent cooling is however likely to be temporary, and the lagged effects of La Niña, which typically favour warmer-than-average ocean temperatures around New Zealand, are expected to re‑emerge. Forecasts from coupled ocean-atmosphere models for the next three-month period favour warmer than average ocean temperature as a whole for the season. Monitor the SST update for updates
Regional predictions for February – April 2026
The tables below show the probabilities (or percent chances) for each of three categories: above average, near average, and below average. In the absence of any forecast guidance there would be an equal likelihood (33% chance) of the outcome for any of the three categories. Forecast information from local and global guidance models is used to indicate the deviation from equal chance that is expected for the coming three-month period. All outlooks are for the three months averaged as a whole. During these three months, there will inevitably be relatively wet and dry periods, as well as hot and cold periods. The exact range in temperature and rainfall within each of the three categories varies with location and season. However, as a guide, the “near average” or middle category for the temperature predictions includes deviations up to ±0.5°C relative to the long-term mean, whereas for rainfall the “near normal” category lies between 80 percent and 120 percent of the long-term (1991-2020) mean.
Northland, Auckland, Waikato, Bay of Plenty
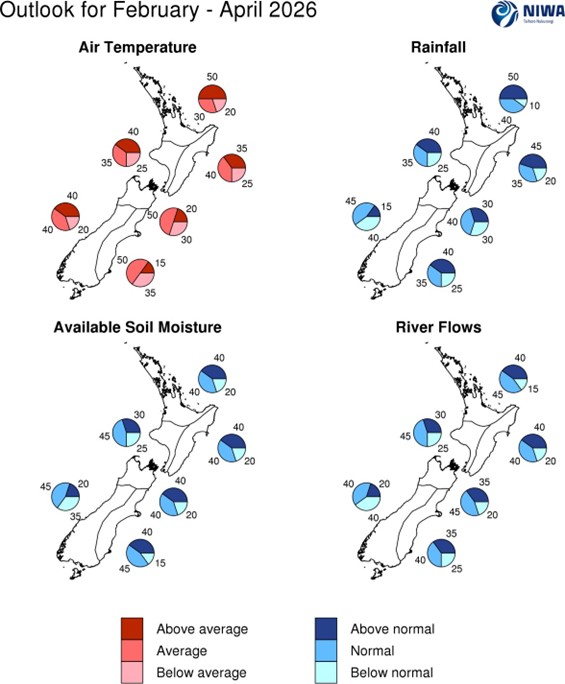
- Temperatures are most likely to be above average (50% chance)
- Rainfall totals are most likely to be above normal (50% chance). Weather systems linked to subtropics or tropics may bring heavy rainfall
- Soil moisture levels are equally likely to be near normal (40% chance) or above normal (40% chance)
- River flows are about equally likely to be near normal (45% chance) or above normal (40% chance).
| Temperature | Rainfall | Soil moisture | River flows | |
| Above average | 50 | 50 | 40 | 40 |
| Near average | 30 | 40 | 40 | 45 |
| Below average | 20 | 10 | 20 | 15 |
Central North Island, Taranaki, Whanganui, Manawatu, Wellington
Probabilities are assigned in three categories: above average, near average, and below average.
- Temperatures are about equally likely to be above average (40% chance) or near average (35% chance)
- Rainfall totals are about equally likely to be above normal (40% chance) or near normal (35% chance)
- Soil moisture levels and river flows are most likely to be near normal (45% chance).
| Temperature | Rainfall | Soil moisture | River flows | |
| Above average | 40 | 40 | 30 | 30 |
| Near average | 35 | 35 | 45 | 45 |
| Below average | 25 | 25 | 25 | 25 |
Gisborne, Hawke’s Bay, Wairarapa
Probabilities are assigned in three categories: above average, near average, and below average.
- Temperatures are about equally likely to be near average (40% chance) or above average (35% chance)
- Rainfall is most likely to be above normal (45% chance) for the season as a whole. Weather systems linked to subtropics or tropics may bring heavy rainfall
- Soil moisture levels and river flows are equally likely to be above normal (40% chance) or near normal (40% chance).
| Temperature | Rainfall | Soil moisture | River flows | |
| Above average | 35 | 45 | 40 | 40 |
| Near average | 40 | 35 | 40 | 40 |
| Below average | 25 | 20 | 20 | 20 |
Tasman, Nelson, Marlborough, Buller
Probabilities are assigned in three categories: above average, near average, and below average.
- Temperatures are most likely to be near average (50% chance)
- Rainfall totals are most likely to be near normal (40% chance), although the near-even spread of probabilities indicates notable forecast uncertainty
- Soil moisture levels are equally likely to be above normal (40% chance) or near normal (40% chance)
- River flows are most likely to be near normal (45% chance).
| Temperature | Rainfall | Soil moisture | River flows | |
| Above average | 20 | 30 | 40 | 35 |
| Near average | 50 | 40 | 40 | 45 |
| Below average | 30 | 30 | 20 | 20 |
West Coast, Southern Alps and foothills, inland Otago, Southland
Probabilities are assigned in three categories: above average, near average, and below average.
- Temperatures are equally likely to be above average (40% chance) or near average (40% chance)
- Rainfall totals are about equally likely to be near normal (45% chance) or below normal (40% chance)
- Soil moisture levels are most likely to be near normal (45% chance)
- River flows are equally likely to be below normal (40% chance) or near normal (40% chance).
| Temperature | Rainfall | Soil moisture | River flows | |
| Above average | 40 | 15 | 20 | 20 |
| Near average | 40 | 45 | 45 | 40 |
| Below average | 20 | 40 | 35 | 40 |
Coastal Canterbury and the nearby plains, east Otago
Probabilities are assigned in three categories: above average, near average, and below average.
- Temperatures are most likely to be near average (50% chance)
- Rainfall totals are about equally likely to be above normal (40% chance) or near normal (35% chance)
- Soil moisture levels are about equally likely to be near normal (45% chance) or above normal (40% chance)
- River flows are about equally likely to be near normal (40% chance) or above normal (35% chance).
The full probability breakdown is:
| Temperature | Rainfall | Soil moisture | River flows | |
| Above average | 15 | 40 | 40 | 35 |
| Near average | 50 | 35 | 45 | 40 |
| Below average | 35 | 25 | 15 | 25 |
Background
The Southern Oscillation Index (SOI) recovered to the La Niña side of neutral in January 2026, with the latest value (estimate for the month of January 2026 using data to 27 January) being +0.8. The Equatorial SOI, which measures the pressure difference between the eastern and western Pacific along the Equator, is in the neutral range, with a value of +0.3 for the month of January (estimated using values to 30 January).
During January 2026, enhanced convection and rainfall - indicated by negative outgoing longwave radiation (OLR) anomalies - were still present over the Maritime Continent, northern Australia and the Coral Sea. Positive OLR anomalies, indicating suppressed convection, were recorded over and just west of the International Date Line. Although these anomalies were broadly consistent with weak La Niña conditions, they continued to be more spatially constrained to the central and western Pacific than is typical. Accordingly, the associated strengthening of the trade winds occurred primarily in the central tropical Pacific.
Sea surface temperatures (SSTs) in the central equatorial Pacific continued to be below average in January 2026 but weakened further compared to the peak negative anomalies reached in November 2025. The Relative Niño 3.4 Index (RONI*), which is now the primary oceanic index that Earth Science NZ uses to monitor El Niño-Southern Oscillation (ENSO), is -0.90oC for the past 30 days (to 31 January).
During January 2026, warmer than average subsurface ocean temperatures in the Pacific along the Equator have continued to expand eastward and towards the surface, further eroding the cooler than average ocean temperatures in the eastern Pacific that were present in the previous months. Negative subsurface temperature anomalies are now restricted to above about 100m depth and east of about 100oW. Similarly, negative upper-ocean heat content anomalies (ocean temperature anomalies integrated over the top 300m of the ocean) are now mostly restricted to east of about 90oW.
These most recent changes in the structure of oceanic anomalies at depth are consistent with the expected imminent dissipation of the remaining weak La Niña signals in the Pacific and may contribute to a rapid transition to ENSO-neutral conditions during the outlook period.
The Relative Oceanic Niño Index forecasts indicate an 80% for ENSO-neutral conditions over the next three month period (February – April 2026). The IRI/CPC forecasts, based on the traditional Niño 3.4 index, also support this outlook. Looking further ahead, global climate models favour the development of El Niño conditions in the eastern tropical Pacific later in 2026. It is important to note that there are fundamental physical limitations to the predictability of future ENSO states at this time of year (the so-called “Predictability Barrier”). However, the strength and location of sub-surface ocean temperature anomalies is causing a higher-than-normal degree of confidence in a forecast for El Niño developing later in 2026.
The Southern Annular Mode (SAM) switched to positive values in January 2026, as the forecast models anticipated last month. The current value (to 26 January) for the month of January 2026 is +0.8 standard deviations (std), with about 63% of days exceeding +0.5 std over the same period.
Forecasts suggest the SAM index will weaken over the next two weeks but remain generally positive. It is important to note that SAM forecasts beyond this timeframe carry significant uncertainty.
The Indian Ocean Dipole (IOD) is currently within the neutral range (value of +0.14oC for January 2026) and is expected to remain neutral throughout the outlook period. Later this year guidance suggest that the IOD may become slightly positive, consistent with the possible emergence of El Niño conditions by winter.
During January 2026 the Madden-Julian Oscillation (MJO) significantly strengthened as it moved across the Maritime Continent and into the Western Pacific. This occurred in conjunction with a strong Equatorial Rossby Wave. The constructive interference between the two waves led to enhanced convection occurring both over the south-west Pacific, northern Australia, and the Northern Hemisphere component of the Maritime Continent. Tropical Storm Nokaen formed in this period, the first January north-west Pacific system to form in seven years. Meanwhile, in the Southern Hemisphere, Tropical Cyclone Koji formed, indicative of a classic “twin cyclones” pattern associated with coherent Rossby Waves.
The MJO is expected to track into the central and eastern Pacific in early February. It will destructively interfere with both the base La Niña state and potentially another Equatorial Rossby Wave. This complex interaction of planetary waves is likely contributing to forecast uncertainty in outcomes thereafter. However, some guidance has a relatively high confidence of yet another MJO orbit initiating in the Indian Ocean during February. This would lead to a slight reduction in tropical cyclone risk north of New Zealand and settled conditions across New Zealand during at least part of February. Thereafter, the risk of unsettled weather may increase either late in February or March if the MJO successfully propagates across the Maritime Continent.
Enhanced wind stress associated with the deep low pressure areas that affected the region in January has led to substantial cooling of surface waters around New Zealand in recent days, with cooler‑than‑average daily SST anomalies now present off a large portion of the country’s coastlines. As a result, marine heatwave (MHW) conditions have dissipated. This recent cooling is however likely to be temporary. Month-to-date values for the New Zealand coastal SST indices (see table below) remain positive, and the lagged effects of La Niña, which typically favour warmer-than-average ocean temperatures around New Zealand, are expected to re‑emerge. Forecasts from coupled ocean-atmosphere models for the next three-month period (see Sea Surface Temperature Update | Earth Sciences New Zealand | NIWA) favour warmer than average ocean temperatures as a whole for the season.
| North NI | +1.15°C |
| West NI | +0.77°C |
| East NI | +0.83°C |
| North SI | +0.62°C |
| West SI | +0.99°C |
| East SI | +0.84°C |
*The Relative Oceanic Niño 3.4 Index (RONI) is a modern way of measuring oceanic El Niño and La Niña that is complementary to traditional oceanic indices. While traditional oceanic indices like the Niño 3.4 Index monitor SSTs in one region, the RONI compares the average SST in the central equatorial Pacific with the average SST across the global tropics. Since tropical rainfall patterns respond to changes in ocean temperatures, this new relative index can help forecasters better determine if the equatorial Pacific is warmer or cooler than the rest of the global tropics, which has become more challenging to discern as seas warm because of climate change.
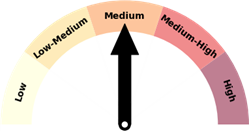
Temperature
Forecast confidence for temperatures is Medium. The dominant easterly flow may reduce the frequency and extent of potentially extreme hot days, while combining with increasing SSTs to provide a baseline warming to western areas and northern areas. Parts of the eastern South Island may see daytime temperatures suppressed in onshore flows.
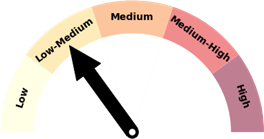
Rainfall
Forecast confidence for rainfall is Low-Medium. Weather systems and airstreams originating in the tropics have underlying potential to bring impactful rain events, as demonstrated in January, although they may occasionally fail to make landfall. Weather systems originating from these areas also have access to anomalously warm SSTs, further enhancing their potential to bring heavy rainfall.
