Outlook Summary
- ENSO-neutral (El Niño – Southern Oscillation) conditions remain present in the tropical Pacific, but La Niña-like patterns became more established in August 2025.
- While remaining in the neutral range, sea surface temperature (SST) anomalies in most of the key ENSO regions became more negative during August 2025.
- Subsurface ocean cooling continued in August, with cooler-than-average waters moving eastward and rising closer to the surface in the eastern Pacific Ocean, reinforcing the shift toward La Niña-like conditions.
- International guidance suggests La Niña conditions are favoured during the spring and early summer 2025-26, before returning to neutral. This is further supported by experimental forecasts developed by Earth Sciences New Zealand for the Relative Oceanic Niño Index (RONI), which accounts for the broader warming trend across the tropical Pacific, and indicates that La Niña conditions are likely (60% chance) to emerge over the September-November 2025 period.
- For New Zealand, a westerly-dominated September is expected to transition into a pattern of higher-than-normal pressure over or south and east of the country in October and November. This scenario will lead to alternating periods of settled weather and northeasterly flow anomalies.
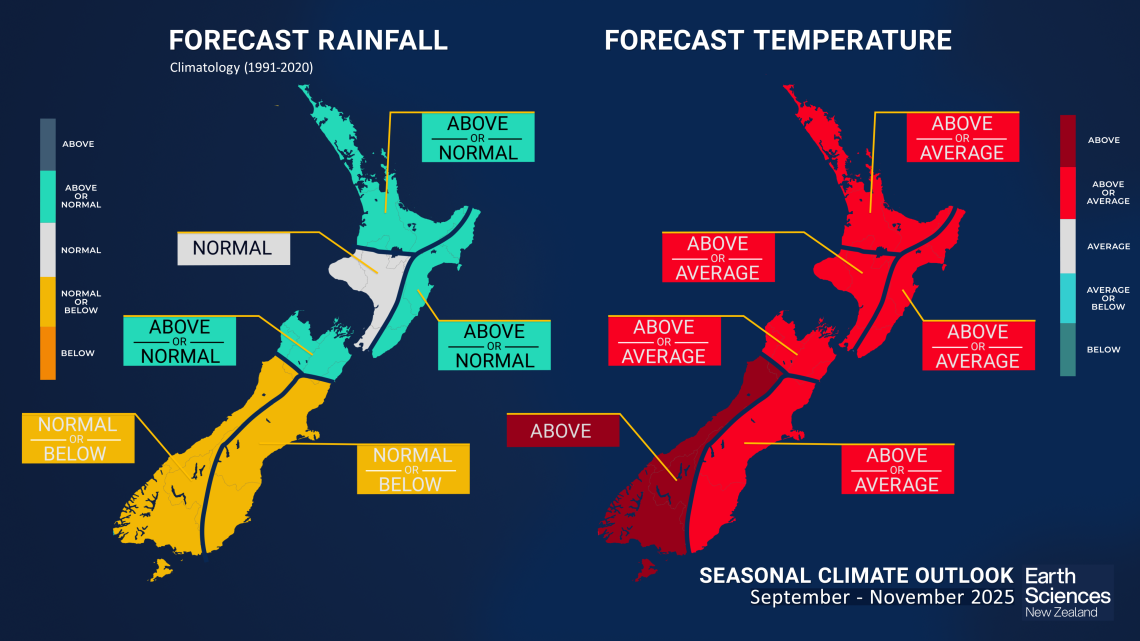
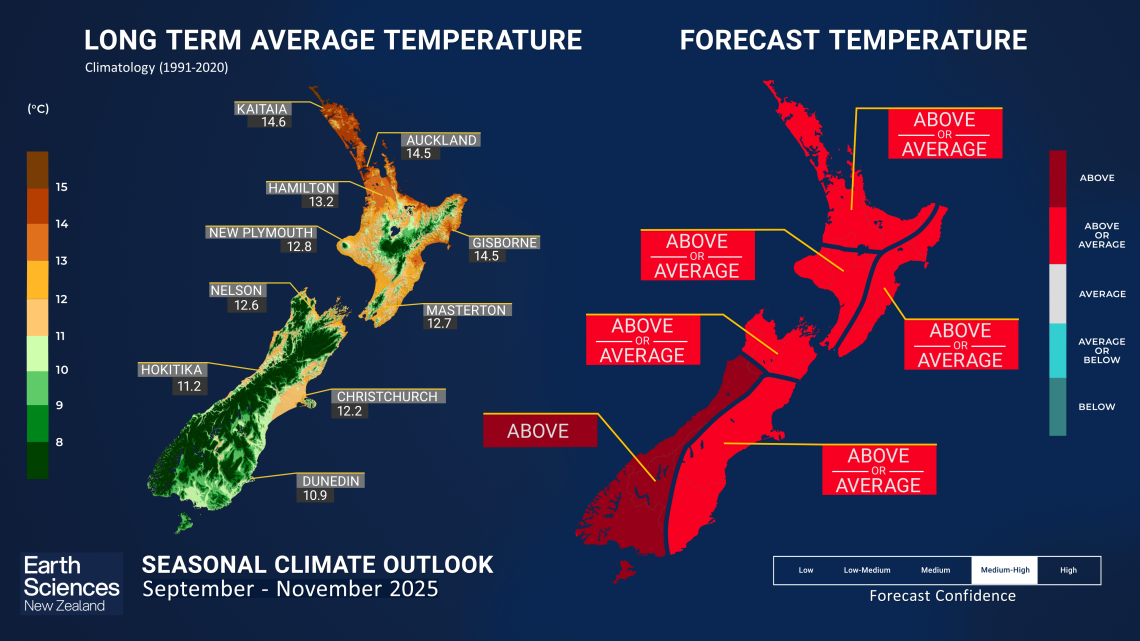
- Seasonal air temperatures for the next three-month period are about equally likely to be near average or above average for all regions of New Zealand, except for the west of the South Island, where above average temperatures are most likely.
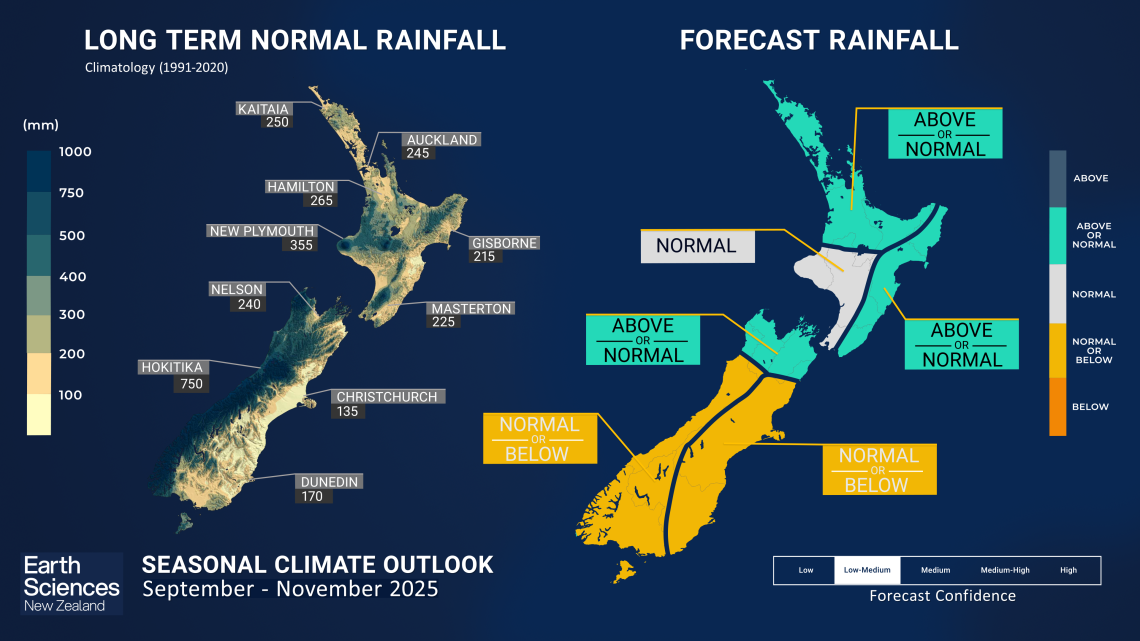
- September – November rainfall totals are expected to be near normal or above normal for the north and east of the North Island and the north of the South Island. Near normal rainfall is forecast for the west of the North Island. Near normal or below normal rainfall is forecast for the west and east of the South Island. Sub-seasonal, or monthly, projections of rainfall and dryness are updated daily through the NIWA35 forecast.
- During September – November 2025, soil moisture levels and river flows are forecast to be below normal or near normal for the north and east of the North Island and the west of the South Island, with near normal soil moisture levels and river flows expected in the remaining regions of New Zealand.
- Below average hydro storage would persist under the scenario of a drier-than-normal spring for much of the South Island. Currently, many sites that report total storage, river flows, and snow cover are below typical levels for this time of year.
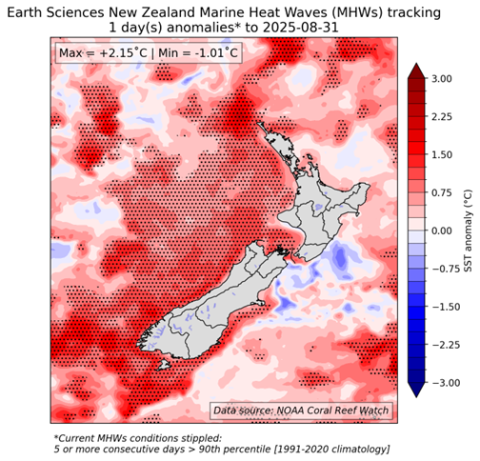
- SSTs remain above average off the west coasts of both the North and South Islands and anomalies intensified slightly during August 2025. Marine Heatwave (MHW) conditions, defined as five or more consecutive days with SSTs above the climatological 90th percentile, also persist over these areas. In contrast, ocean temperatures have cooled off slightly compared to July off the east coast of the North Island. Looking ahead, above-average SSTs are expected to continue around New Zealand through spring (September - November 2025), although the strength of these anomalies may ease somewhat. Monitor the SST update for updates.
Regional predictions for September – November 2025
The tables below show the probabilities (or percent chances) for each of three categories: above average, near average, and below average. In the absence of any forecast guidance there would be an equal likelihood (33% chance) of the outcome for any of the three categories. Forecast information from local and global guidance models is used to indicate the deviation from equal chance that is expected for the coming three-month period. All outlooks are for the three months averaged as a whole. During these three months, there will inevitably be relatively wet and dry periods, as well as hot and cold periods. The exact range in temperature and rainfall within each of the three categories varies with location and season. However, as a guide, the “near average” or middle category for the temperature predictions includes deviations up to ±0.5°C relative to the long-term mean, whereas for rainfall the “near normal” category lies between 80 percent and 120 percent of the long-term (1991-2020) mean.
Northland, Auckland, Waikato, Bay of Plenty
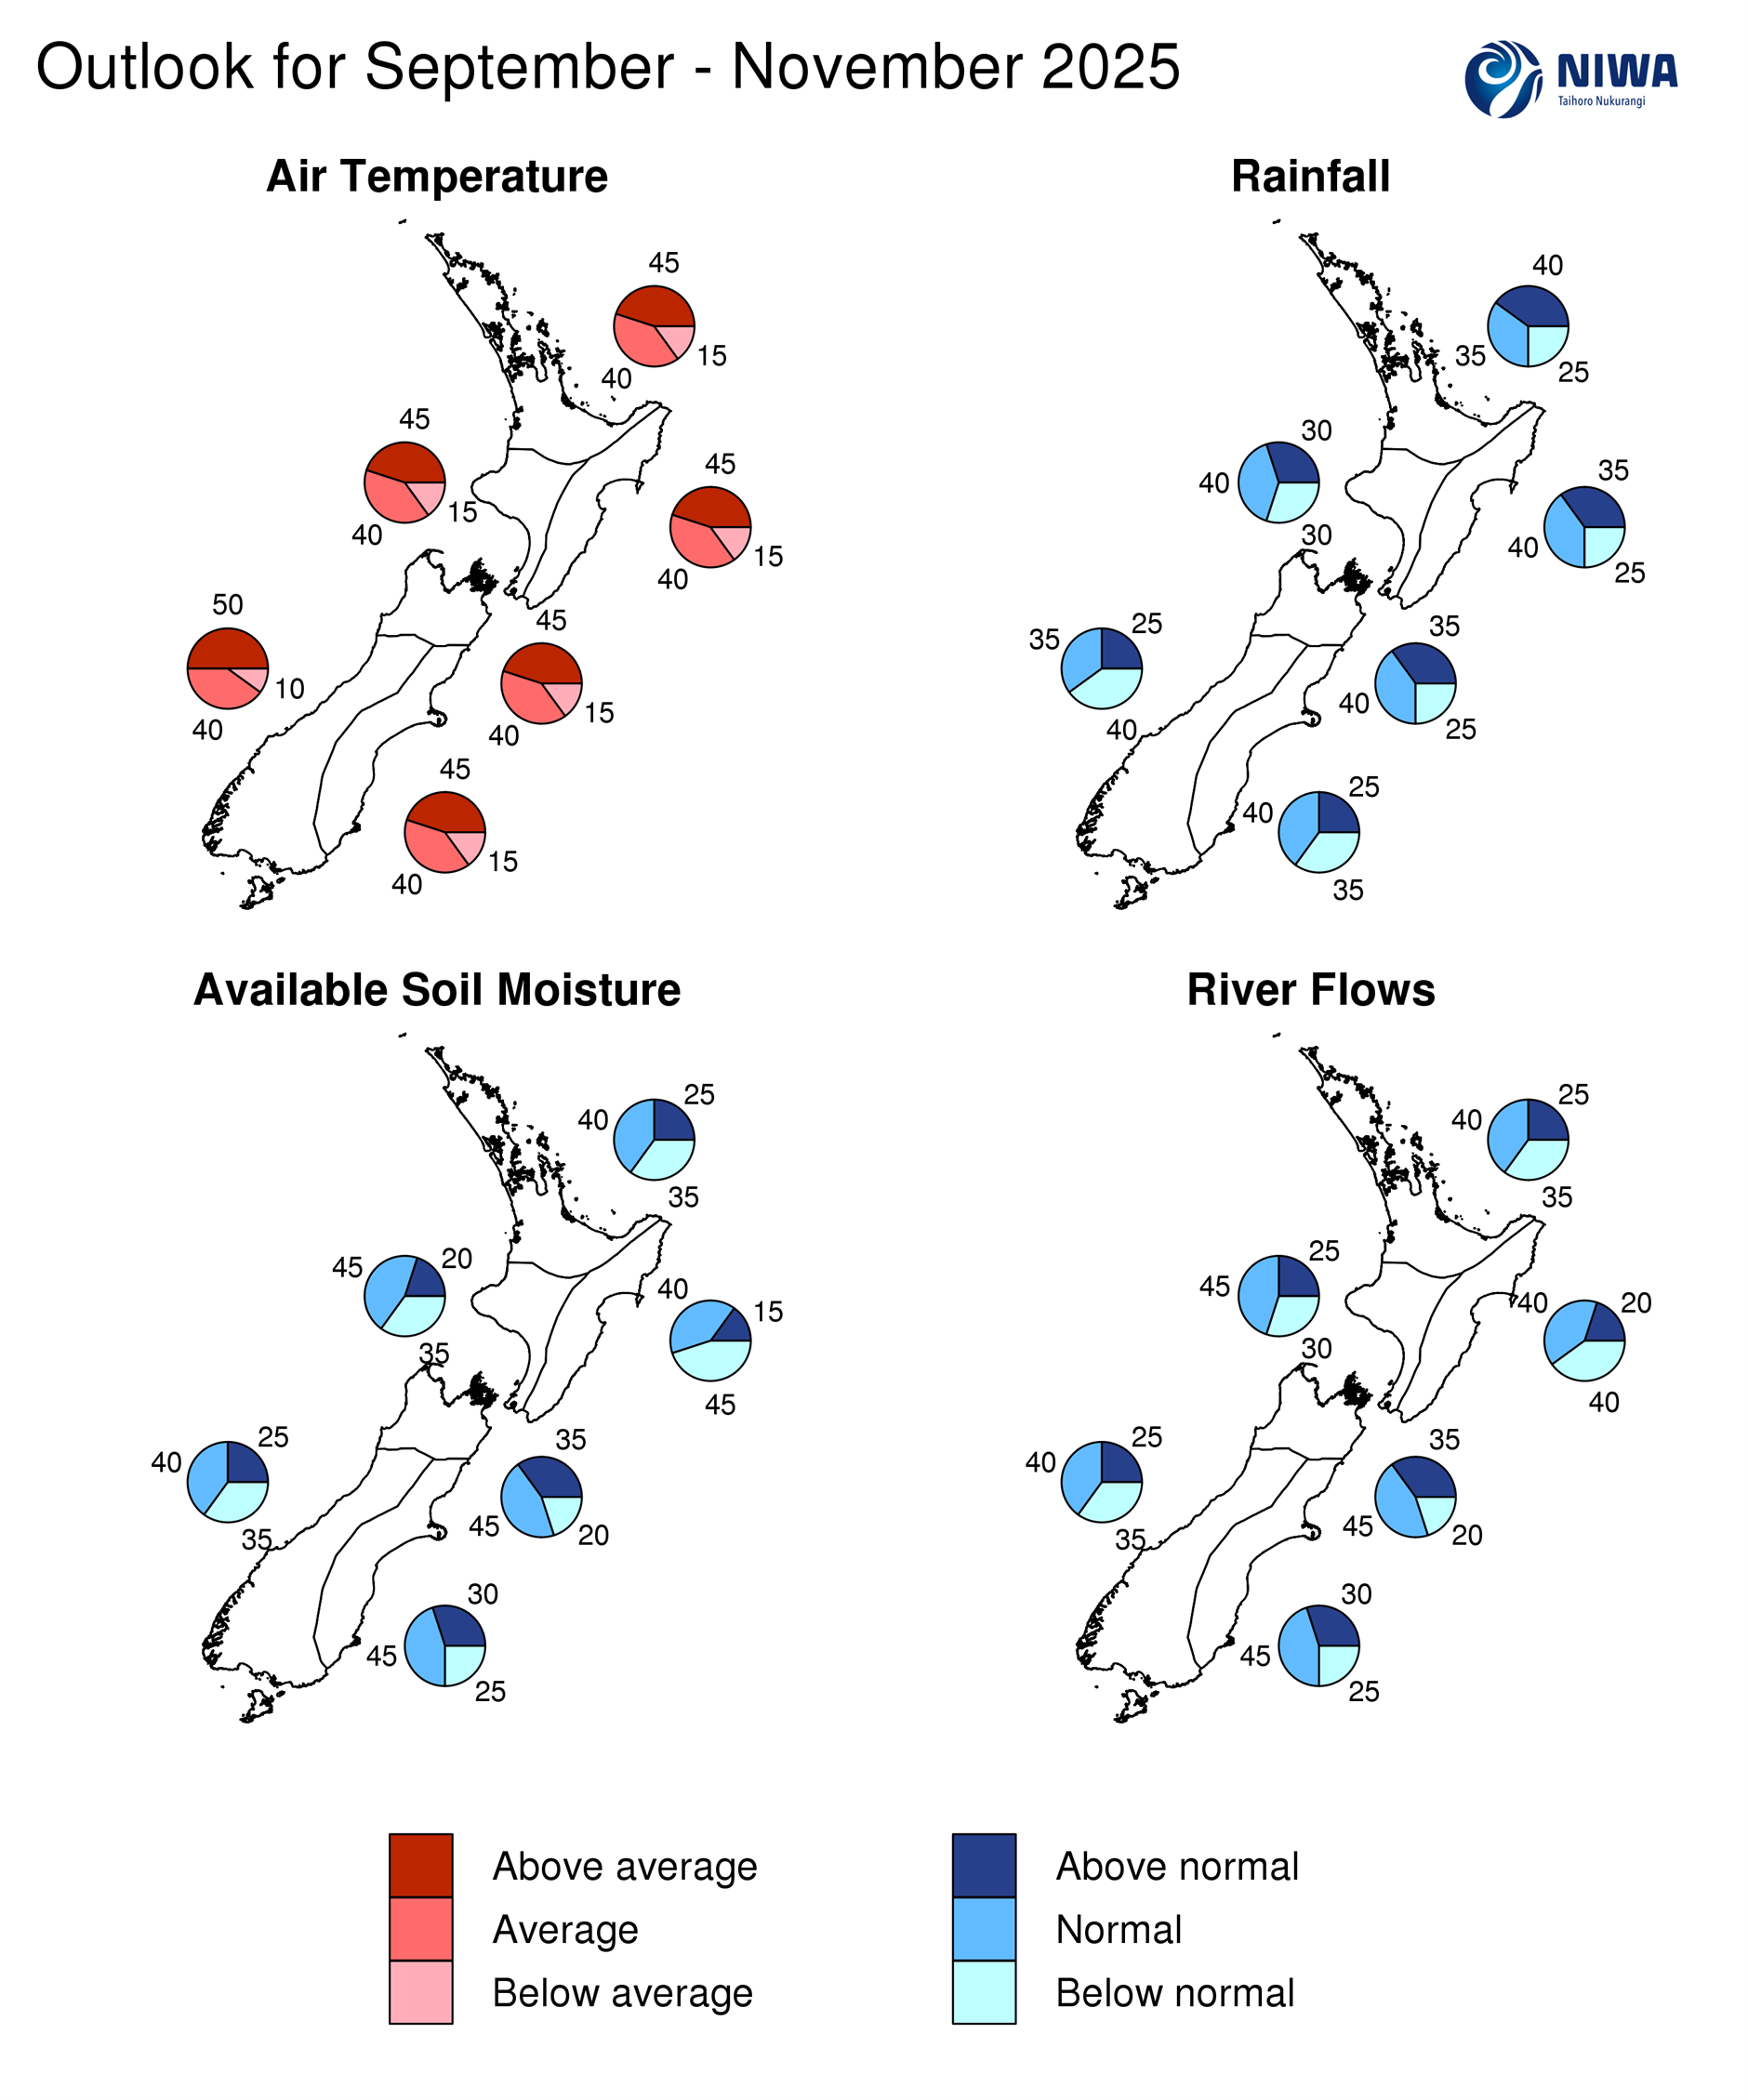
- Temperatures about equally likely to be above average (45% chance) or near average (40% chance).
- Rainfall totals are about equally likely to be above normal (40% chance) or near normal (35% chance).
- Soil moisture levels and river flows are about equally likely to be near normal (40% chance) or below normal (35% chance).
| Temperature | Rainfall | Soil moisture | River flows | |
| Above average | 45 | 40 | 25 | 25 |
| Near average | 40 | 35 | 40 | 40 |
| Below average | 15 | 25 | 35 | 35 |
Central North Island, Taranaki, Whanganui, Manawatu, Wellington
Probabilities are assigned in three categories: above average, near average, and below average.
- Temperatures about equally likely to be above average (45% chance) or near average (40% chance).
- Rainfall totals are most likely to be near normal (40% chance)
- Soil moisture levels and river flows are most likely to be near normal (45% chance).
| Temperature | Rainfall | Soil moisture | River flows | |
| Above average | 45 | 30 | 20 | 25 |
| Near average | 40 | 40 | 45 | 45 |
| Below average | 15 | 30 | 35 | 30 |
Gisborne, Hawke’s Bay, Wairarapa
Probabilities are assigned in three categories: above average, near average, and below average.
- Temperatures about equally likely to be above average (45% chance) or near average (40% chance).
- Rainfall totals are about equally likely to be near normal (40% chance) or above normal (35% chance).
- Soil moisture levels and river flows are about equally likely to be below normal (40-45% chance) or near normal (40% chance).
| Temperature | Rainfall | Soil moisture | River flows | |
| Above average | 45 | 35 | 15 | 20 |
| Near average | 40 | 40 | 40 | 40 |
| Below average | 15 | 25 | 45 | 40 |
Tasman, Nelson, Marlborough, Buller
Probabilities are assigned in three categories: above average, near average, and below average.
- Temperatures are about equally likely to be above average (45% chance) or near average (40% chance).
- Rainfall totals are about equally likely to be near normal (40% chance) or above normal (35% chance).
- Soil moisture levels and river flows are most likely (45% chance) to be near normal.
| Temperature | Rainfall | Soil moisture | River flows | |
| Above average | 45 | 35 | 35 | 35 |
| Near average | 40 | 40 | 45 | 45 |
| Below average | 15 | 25 | 20 | 20 |
West Coast, Southern Alps and foothills, inland Otago, Southland
Probabilities are assigned in three categories: above average, near average, and below average.
- Temperatures are most likely to be above average (50% chance).
- Rainfall totals are about equally likely to be below normal (40% chance) or near normal (35% chance) for the September-November season as a whole.
- Soil moisture levels and river flows are about equally likely to be near normal (40% chance) or below normal (35% chance).
| Temperature | Rainfall | Soil moisture | River flows | |
| Above average | 50 | 25 | 25 | 25 |
| Near average | 40 | 35 | 40 | 40 |
| Below average | 10 | 40 | 35 | 35 |
Coastal Canterbury and the nearby plains, east Otago
Probabilities are assigned in three categories: above average, near average, and below average.
- Temperatures are about equally likely to be above average (45% chance) or near average (40% chance).
- Rainfall totals are about equally likely to be near normal (40% chance) or below normal (35% chance).
- Soil moisture levels and river flows are most likely to be near normal (45% chance).
The full probability breakdown is:
| Temperature | Rainfall | Soil moisture | River flows | |
| Above average | 45 | 25 | 30 | 30 |
| Near average | 40 | 40 | 45 | 45 |
| Below average | 15 | 35 | 25 | 25 |
Background
The monthly Southern Oscillation Index (SOI) value for August 2025 is +0.5. The SOI thus remains on the La Niña side of neutral, weakening from the previous month (the July value was +0.8). Other atmospheric circulation anomalies recorded in August, such as stronger than average trade winds in the central equatorial Pacific and increased convection over the maritime continent, are also consistent with persistence of an anomalous Walker Circulation that resembles conditions typically found during La Niñas.
In August 2025, negative upper-ocean heat content anomalies (measured in the top 300 meters of the ocean) intensified east of about 130°W, a pattern consistent with the cooling and upwelling component of an eastward propagating oceanic Kelvin wave.
Subsurface ocean temperatures revealed a distinct eastward and upward shift of the negative anomalies that were present in July at depths of approximately 100–150 m in the central and eastern Pacific. Significantly cooler than normal conditions, with local anomalies reaching as low as −3°C, are now observed east of about 130°W within the upper 200 m of the ocean.
The recent evolution of these anomalies further supports a more definitive trend toward La Niña-like conditions in the Pacific during August 2025.
In summary, ENSO-neutral conditions persist across the tropical Pacific. Both the Niño 3.4 Index and the Southern Oscillation Index (SOI) remain within neutral thresholds. However, SSTs in the central and eastern Pacific have cooled significantly, and the RONI* is close to La Niña thresholds. Moreover, subsurface ocean temperature anomalies intensified and shifted eastward and towards the surface during August, a pattern consistent with increasing probability for La Niña conditions to emerge more definitively over the forecast period (September – November 2025).
Based on the traditional Niño 3.4 index and the dynamical and statistical models monitored by Earth Sciences New Zealand, ENSO-neutral conditions are the most likely outcome (57% chance) over the forecast period (September – November 2025). However, an experimental RONI forecast developed by Earth Sciences New Zealand, which accounts for the broader warming trend across the tropical Pacific, gives weak La Niña conditions as most likely to dominate the forecast period, with a probability closer to 60%. The forecaster consensus at Earth Sciences New Zealand favours La Niña as the most likely outcome sometime during the spring and early summer. Notably, this is in line with guidance from NOAA’s Climate Prediction Center.
The Southern Annular Mode (SAM) was mostly positive during the month of August 2025 (about 80% of days positive), and the latest 30 days SAM index value is in the neutral range (below 1 Standard Deviation) at +0.45. The forecast from the BoM is for the SAM to become slightly negative over the next week or so and then return to slightly positive (but still in the neutral range) values thereafter. Note that SAM forecasts are very uncertain beyond about two weeks.
The Indian Ocean Dipole (IOD) is currently negative at -0.74oC, cooling significantly from July. The guidance from the Australian Bureau of Meteorology is for the IOD to become more negative over the next three-month period. A negative IOD during the September – November season is often associated with La Niña conditions.
During August 2025, a pulse of the Madden–Julian Oscillation (MJO) reached into the eastern Indian Ocean (phases 2 and 3) but was of relatively weak amplitude. MJO-related convective activity is expected to remain undiscernible over the next two-week period.
Sea surface temperatures (SSTs) remain above average off the west coasts of both the North and South Islands and anomalies intensified slightly during August 2025. Marine Heatwave (MHW) conditions - defined as five or more consecutive days with SSTs above the climatological 90th percentile - also persist over these areas. In contrast, SSTs have cooled slightly compared to July off the east coast of the North Island. SST anomalies are forecast to remain generally above average around New Zealand over the next three-month period.
| North NI | +0.71°C |
| West NI | +1.09°C |
| East NI | +0.60°C |
| North SI | +1.20°C |
| West SI | +1.62°C |
| East SI | +1.39°C |
[1]The Relative Oceanic Niño 3.4 Index (RONI) is a modern way of measuring oceanic El Niño and La Niña that is complementary to traditional oceanic indices. While traditional oceanic indices like the Niño 3.4 Index monitor SSTs in one region, the RONI compares the average SST in the central equatorial Pacific with the average SST across the global tropics. Since tropical rainfall patterns respond to changes in ocean temperatures, this new relative index can help forecasters better determine if the equatorial Pacific is warmer or cooler than the rest of the global tropics, which has become more challenging to discern as seas warm because of climate change.
Forecast Confidence
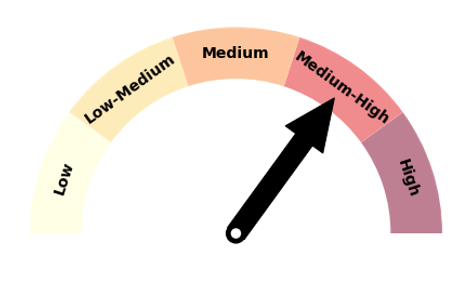
Temperature
Forecast confidence for temperatures is medium-high. The General Circulation Models’ forecasts that Earth Sciences New Zealand leverages for its Seasonal Climate Outlook indicate that above normal or near normal temperatures are likely outcomes for the next three months.
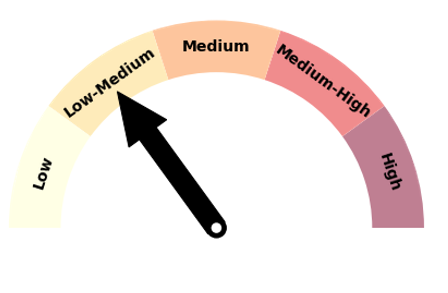
Rainfall
Forecast confidence for rainfall is low-medium. The location, intensity and extent of the positive mean sea level pressure anomalies (higher than normal atmospheric pressure) forecast over or to the south and east of the country will be critical to rainfall outcomes over the next three-month period: if anticyclonic conditions extend over the country more frequently than anticipated, a drier outcome than forecast could eventuate for the country as a whole.
