Outlook Summary
- Moderate La Niña conditions are currently present in the tropical Pacific.
- Both the Southern Oscillation Index (SOI) and the Relative Oceanic Niño Index (RONI) remained above La Niña thresholds during November, consistent with a persistent La Niña signal.
- However, a rapid weakening of La Niña conditions is expected over summer, with about a 50% chance for ENSO-neutral (El Niño – Southern Oscillation) conditions to return by late summer.
- The unsettled conditions that characterised the end of November will continue into the first week of December, with waves of low pressure dominating. A mixed pattern will follow this, but with high pressure becoming an increasingly common occurrence as the month progresses. These anticyclones should most likely occur near the North Island, though may occasionally extend over the South Island.
- This tendency towards a steadily increasing presence of high pressure makes regional dryness a concern from mid-December and into January, especially as it combines with high sun angles at this time of year.
- The final month of summer may transition to high pressure systems frequently sitting further south than normal (over the lower South Island, or the Southern Ocean), bringing an easterly wind anomaly and increased humidity over large parts of the country. This pressure pattern may allow occasional rainmakers in from the north.
- Especially later in summer, the combination of continuing marine heatwaves and La Niña-like weather patterns will increase the risk of significant heavy rain events from the tropics or sub-tropics – primarily for the North Island.
- The Tropical Cyclone Outlook for the November 2025 – April 2026 southwest Pacific Tropical Cyclone (TC) season indicates a normal or elevated risk for ex-TC interaction for New Zealand.
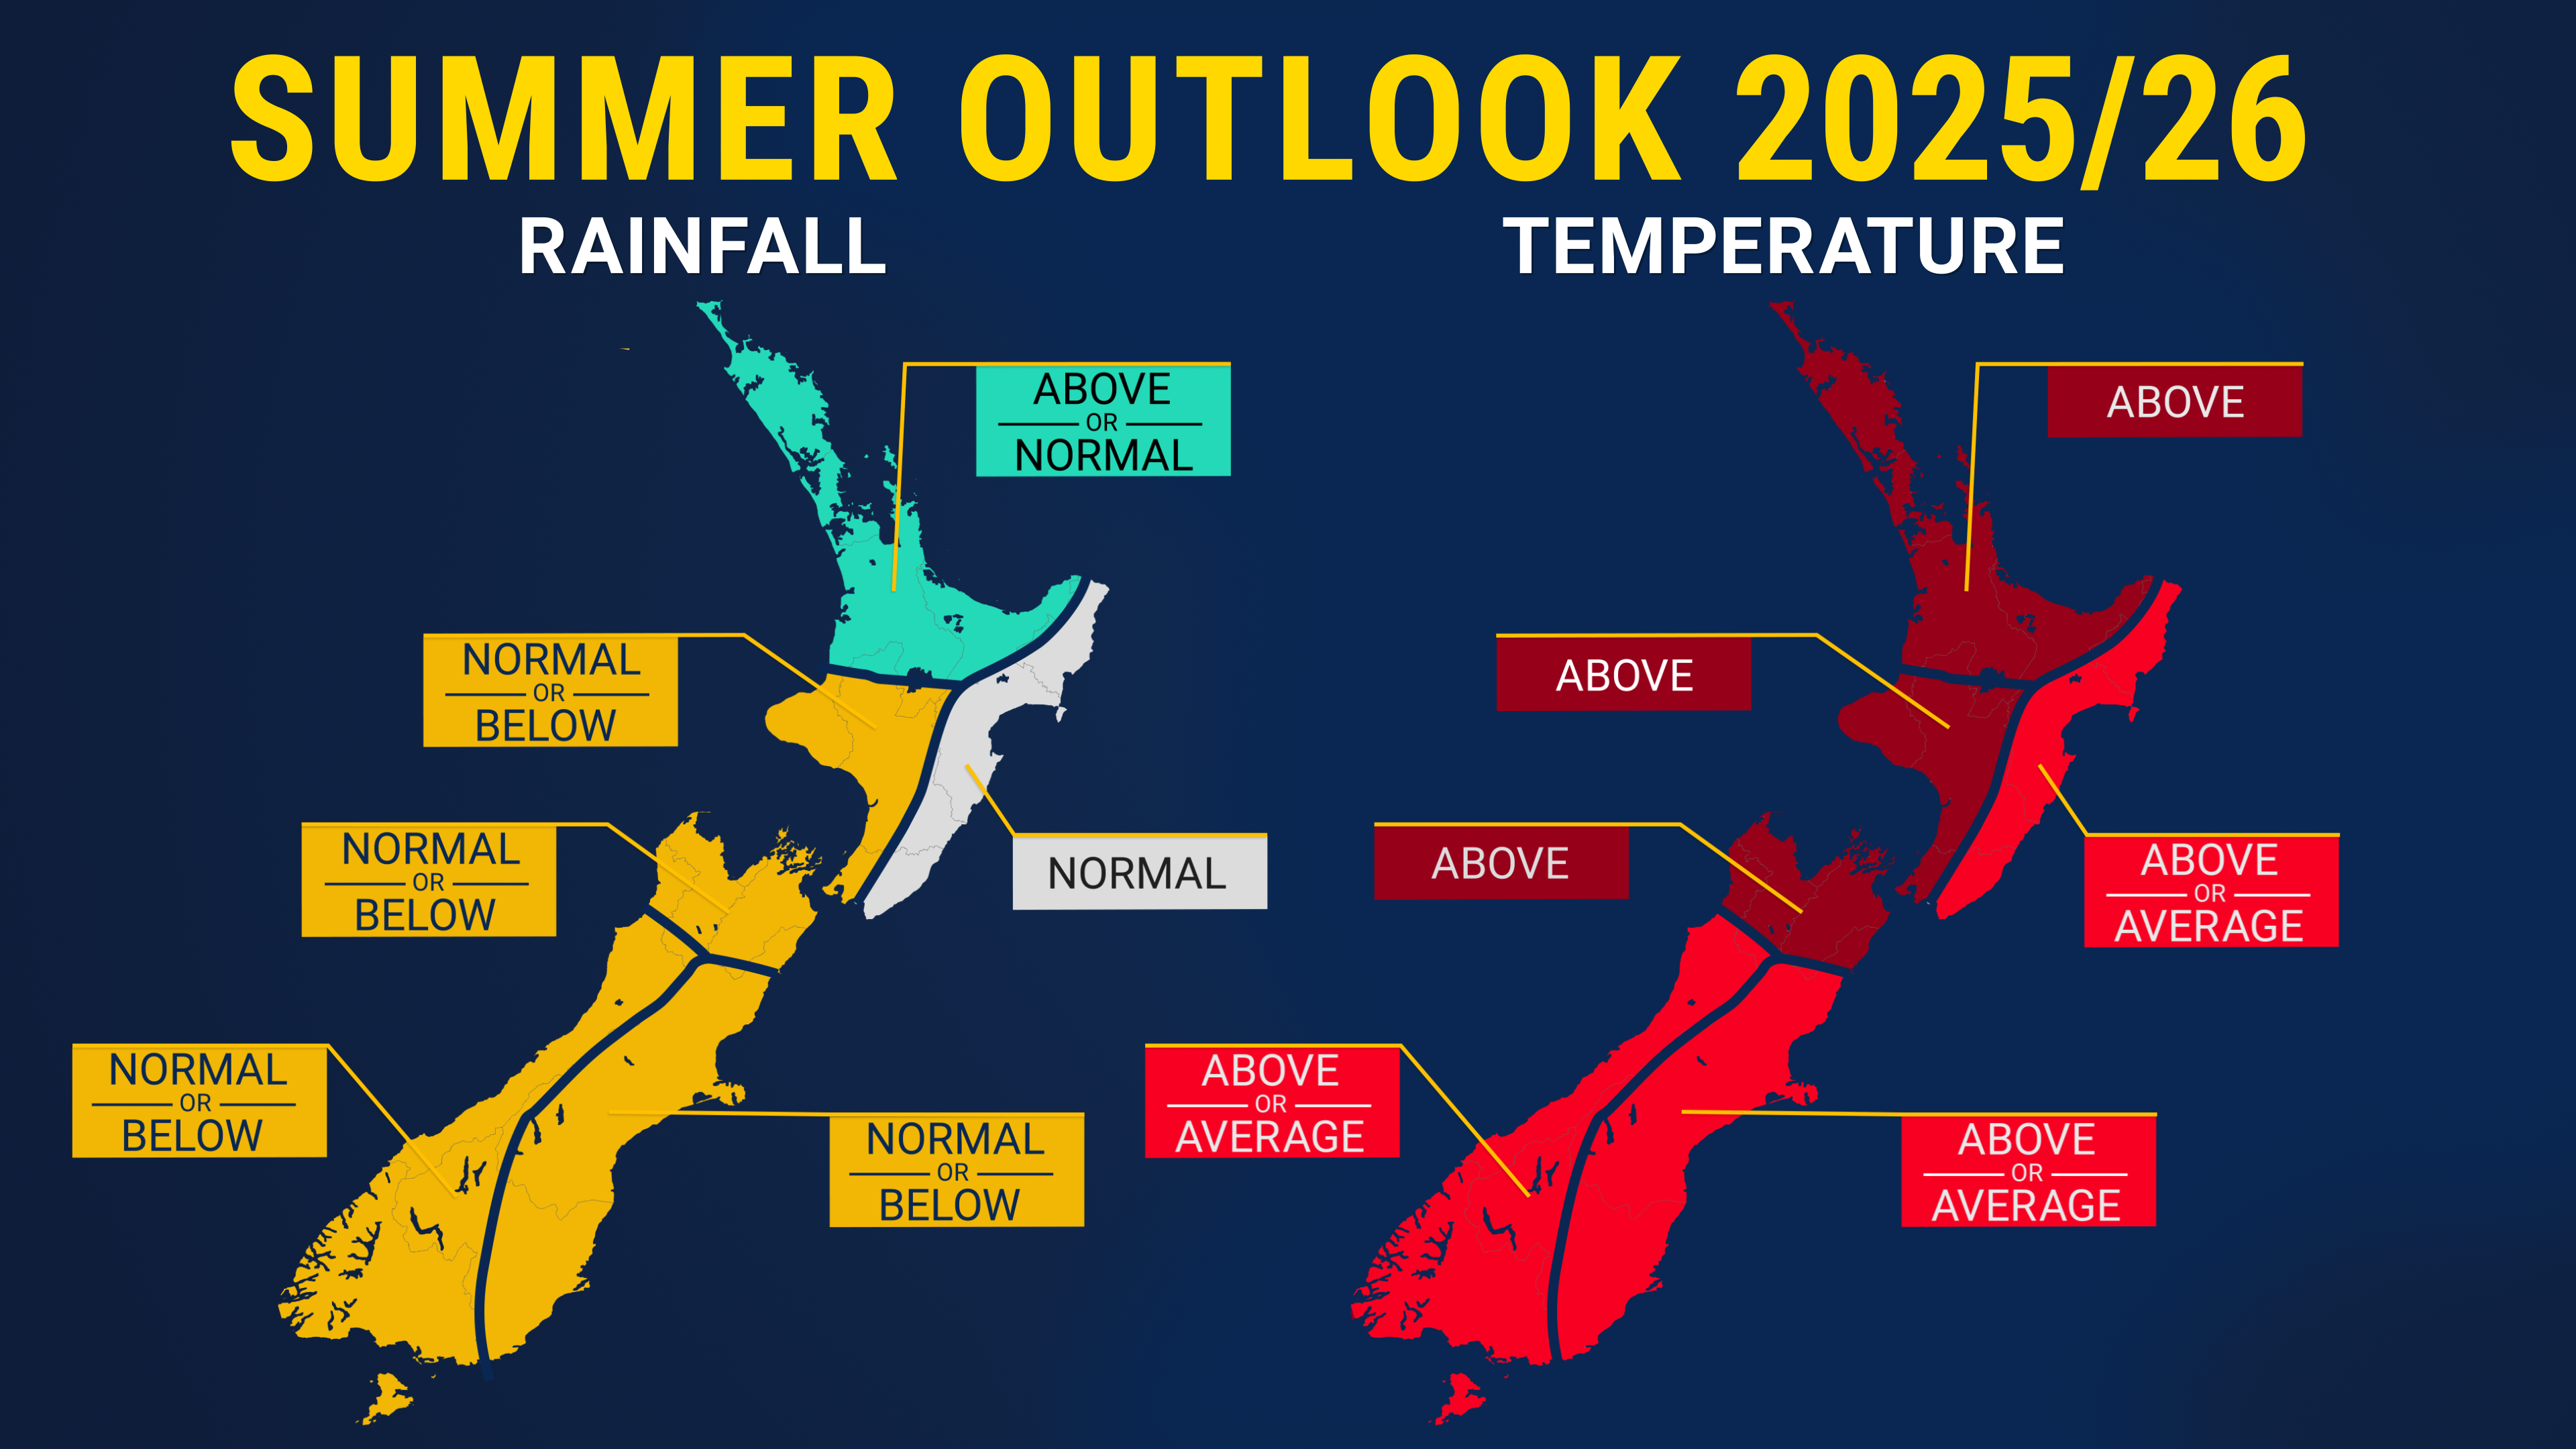
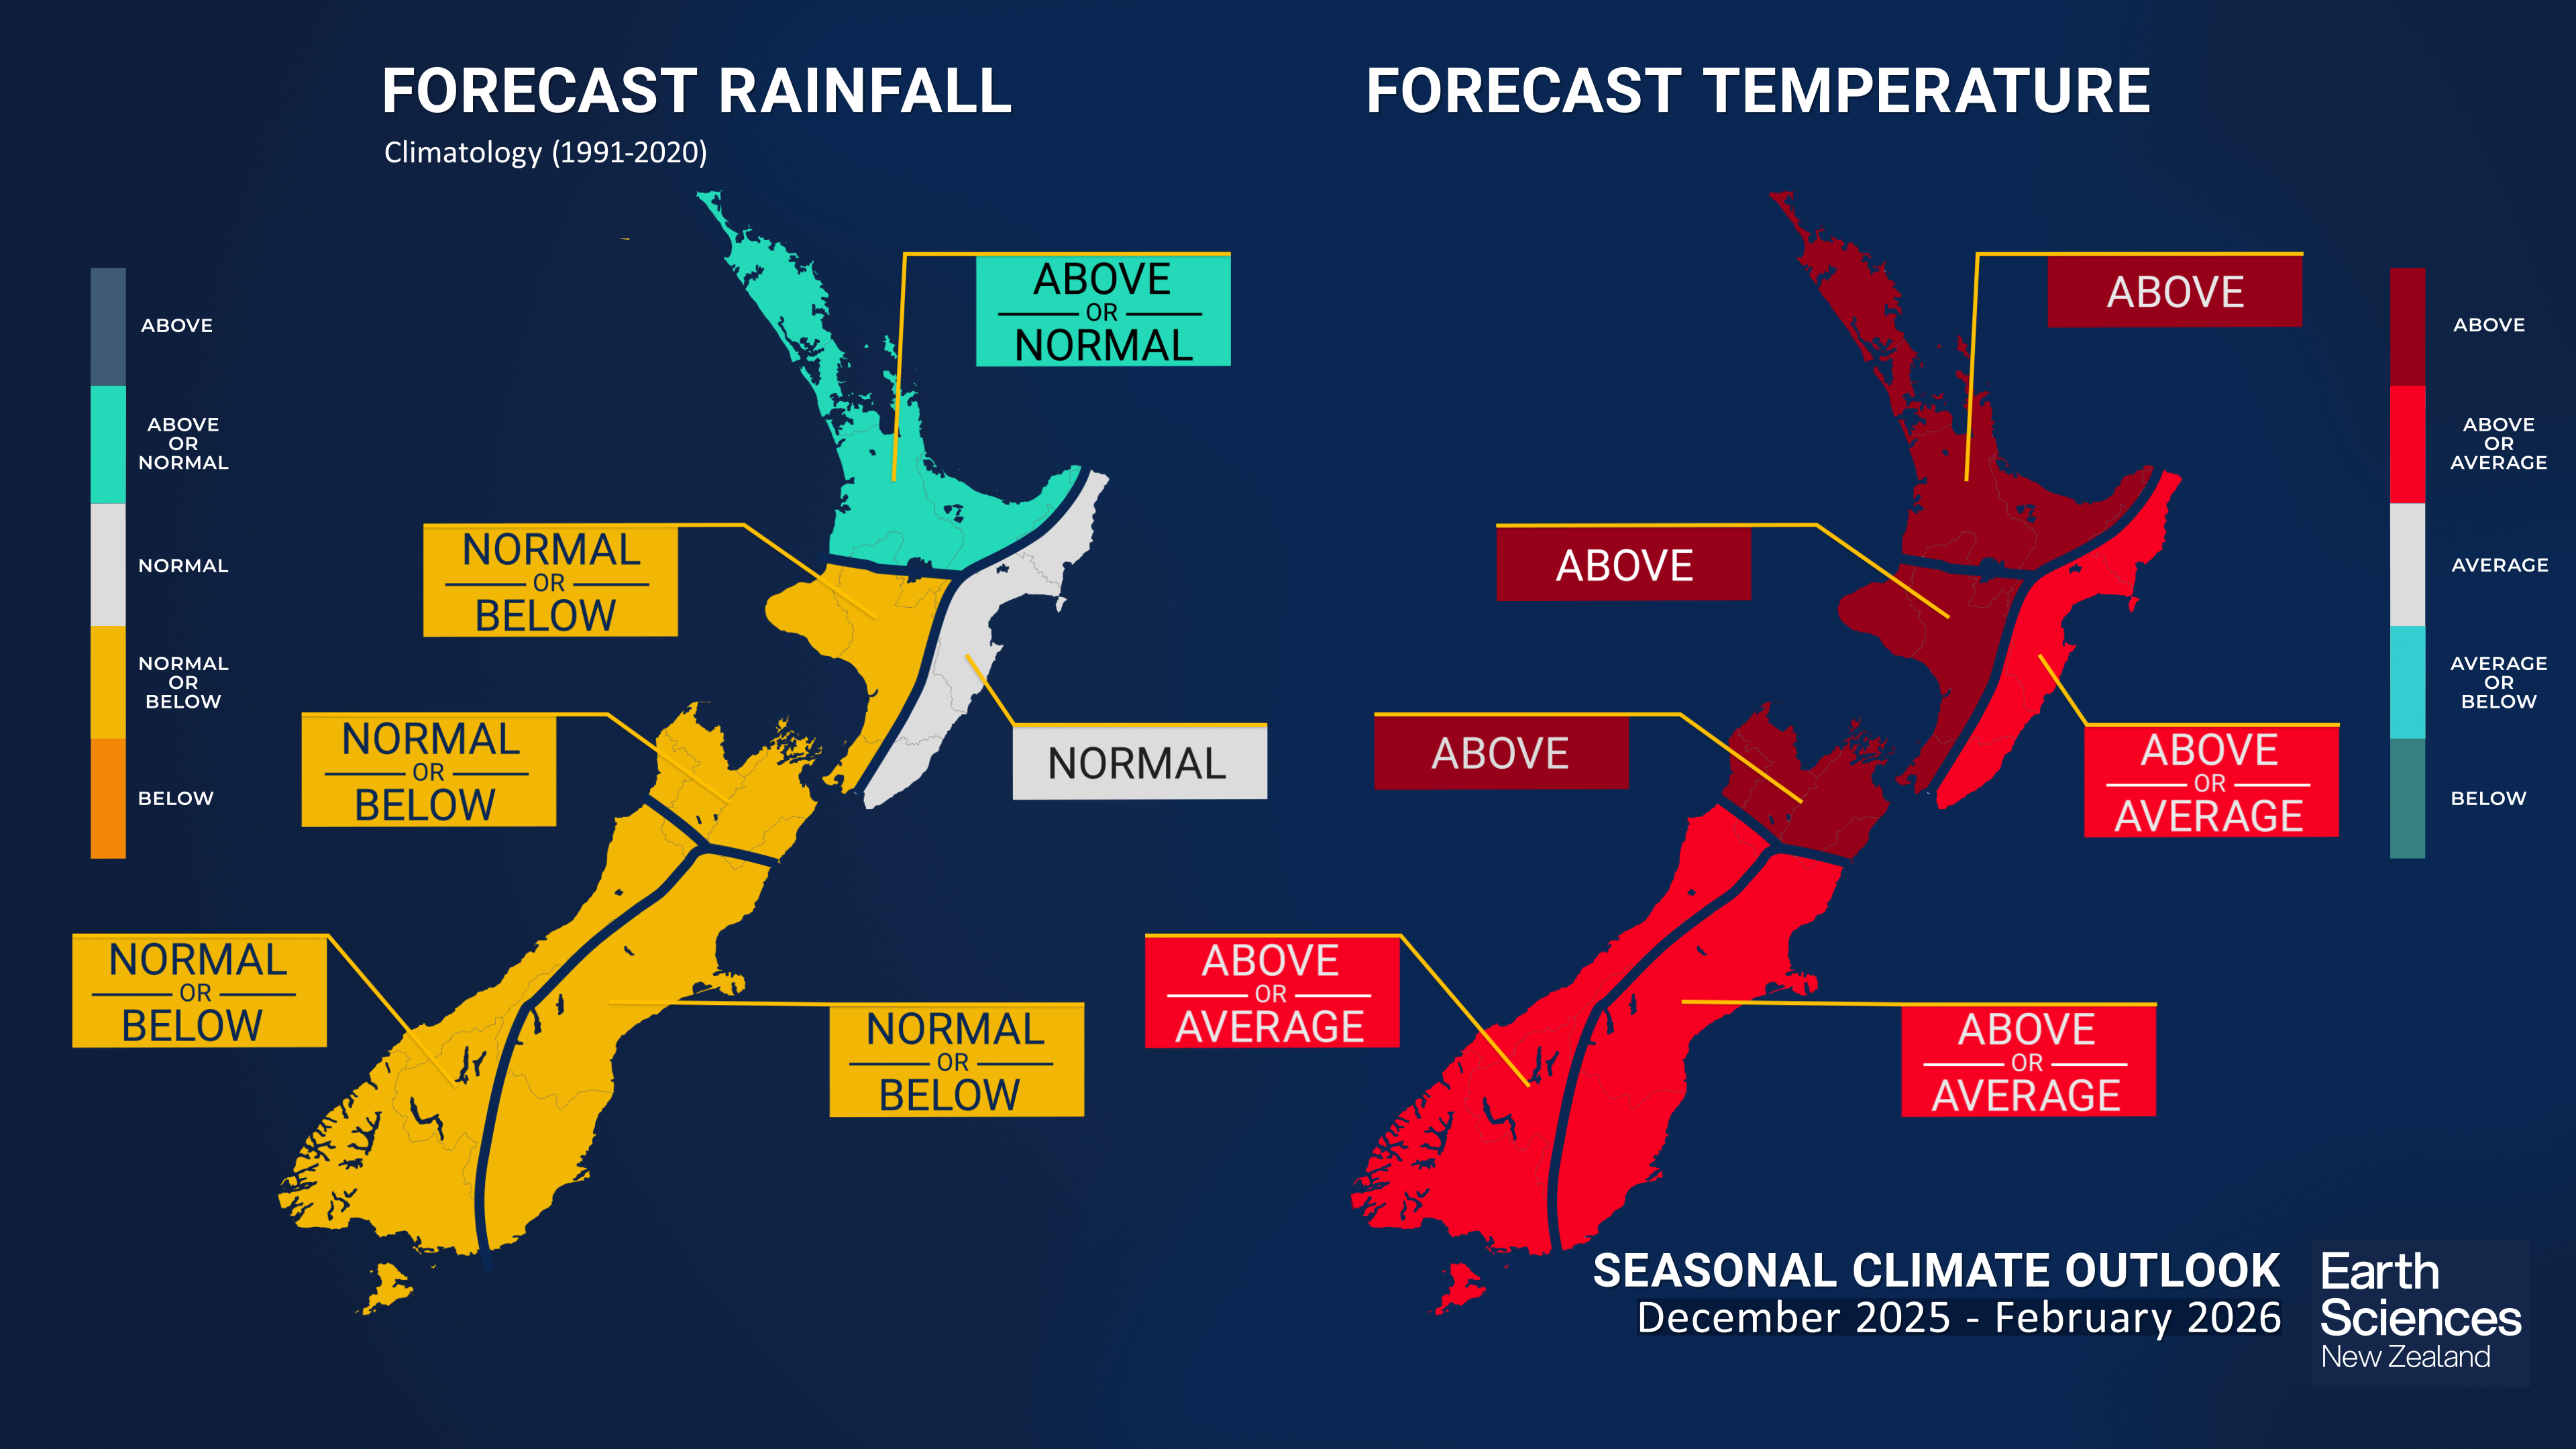
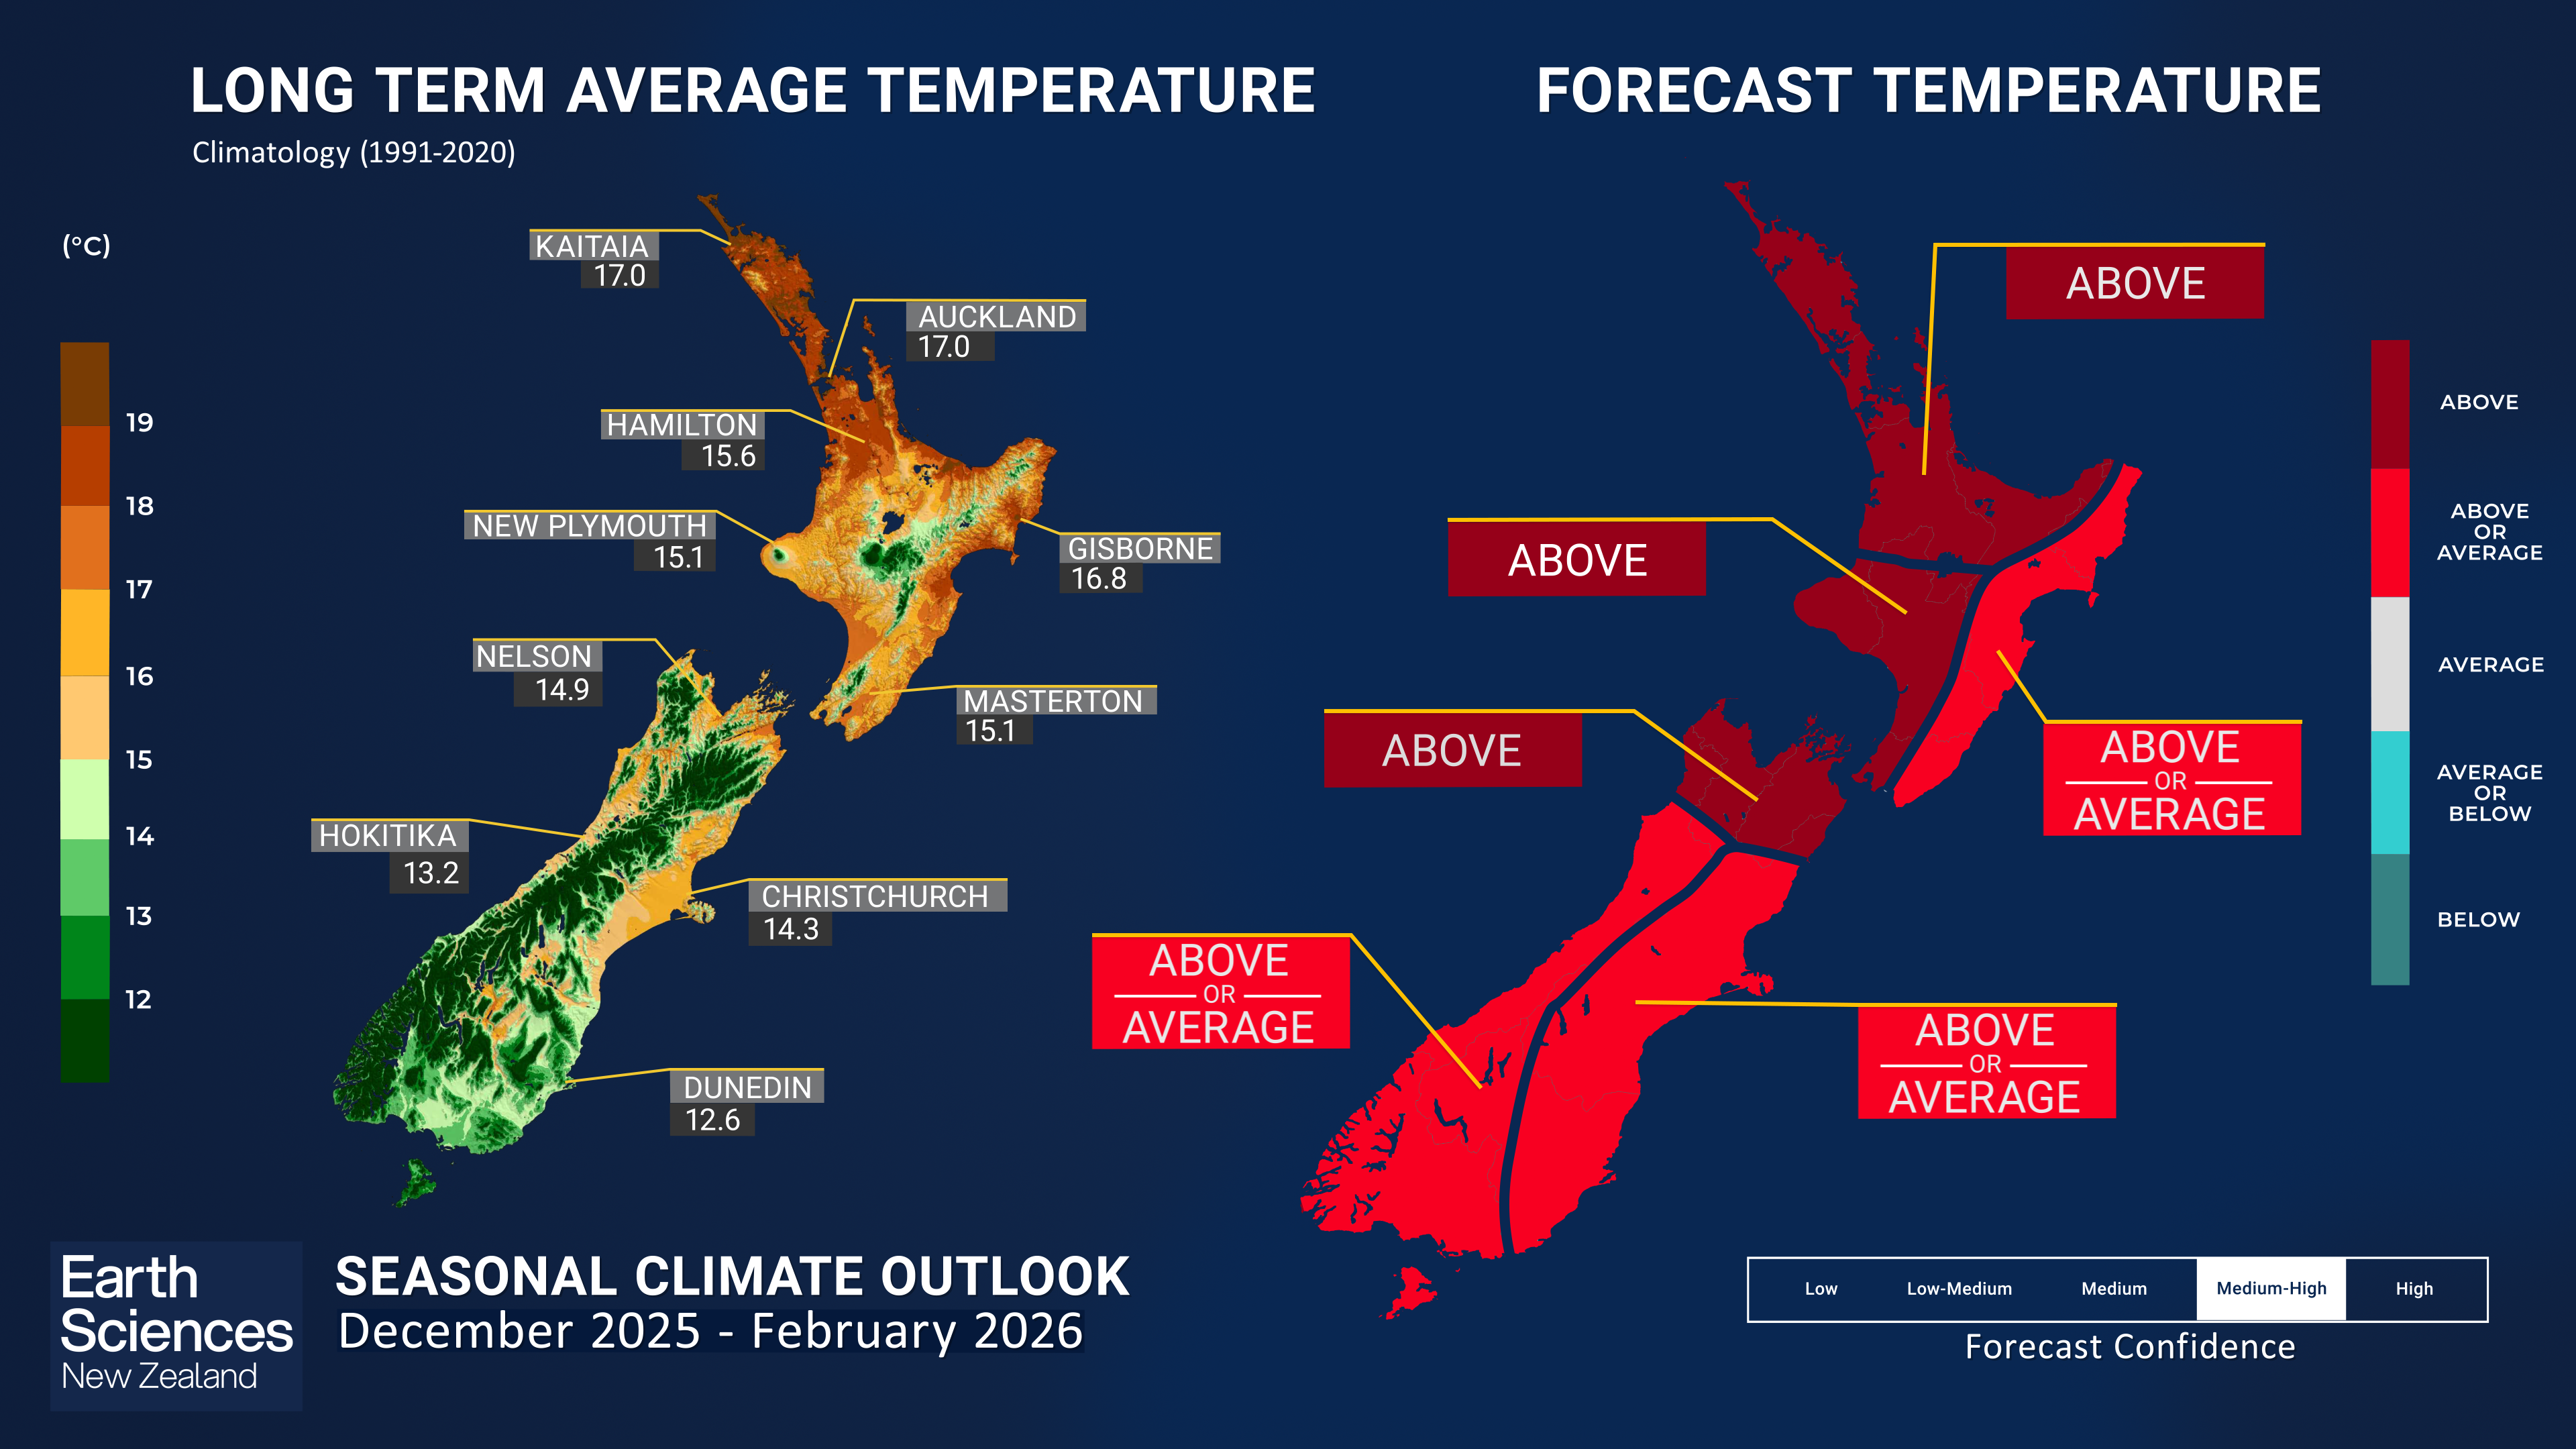
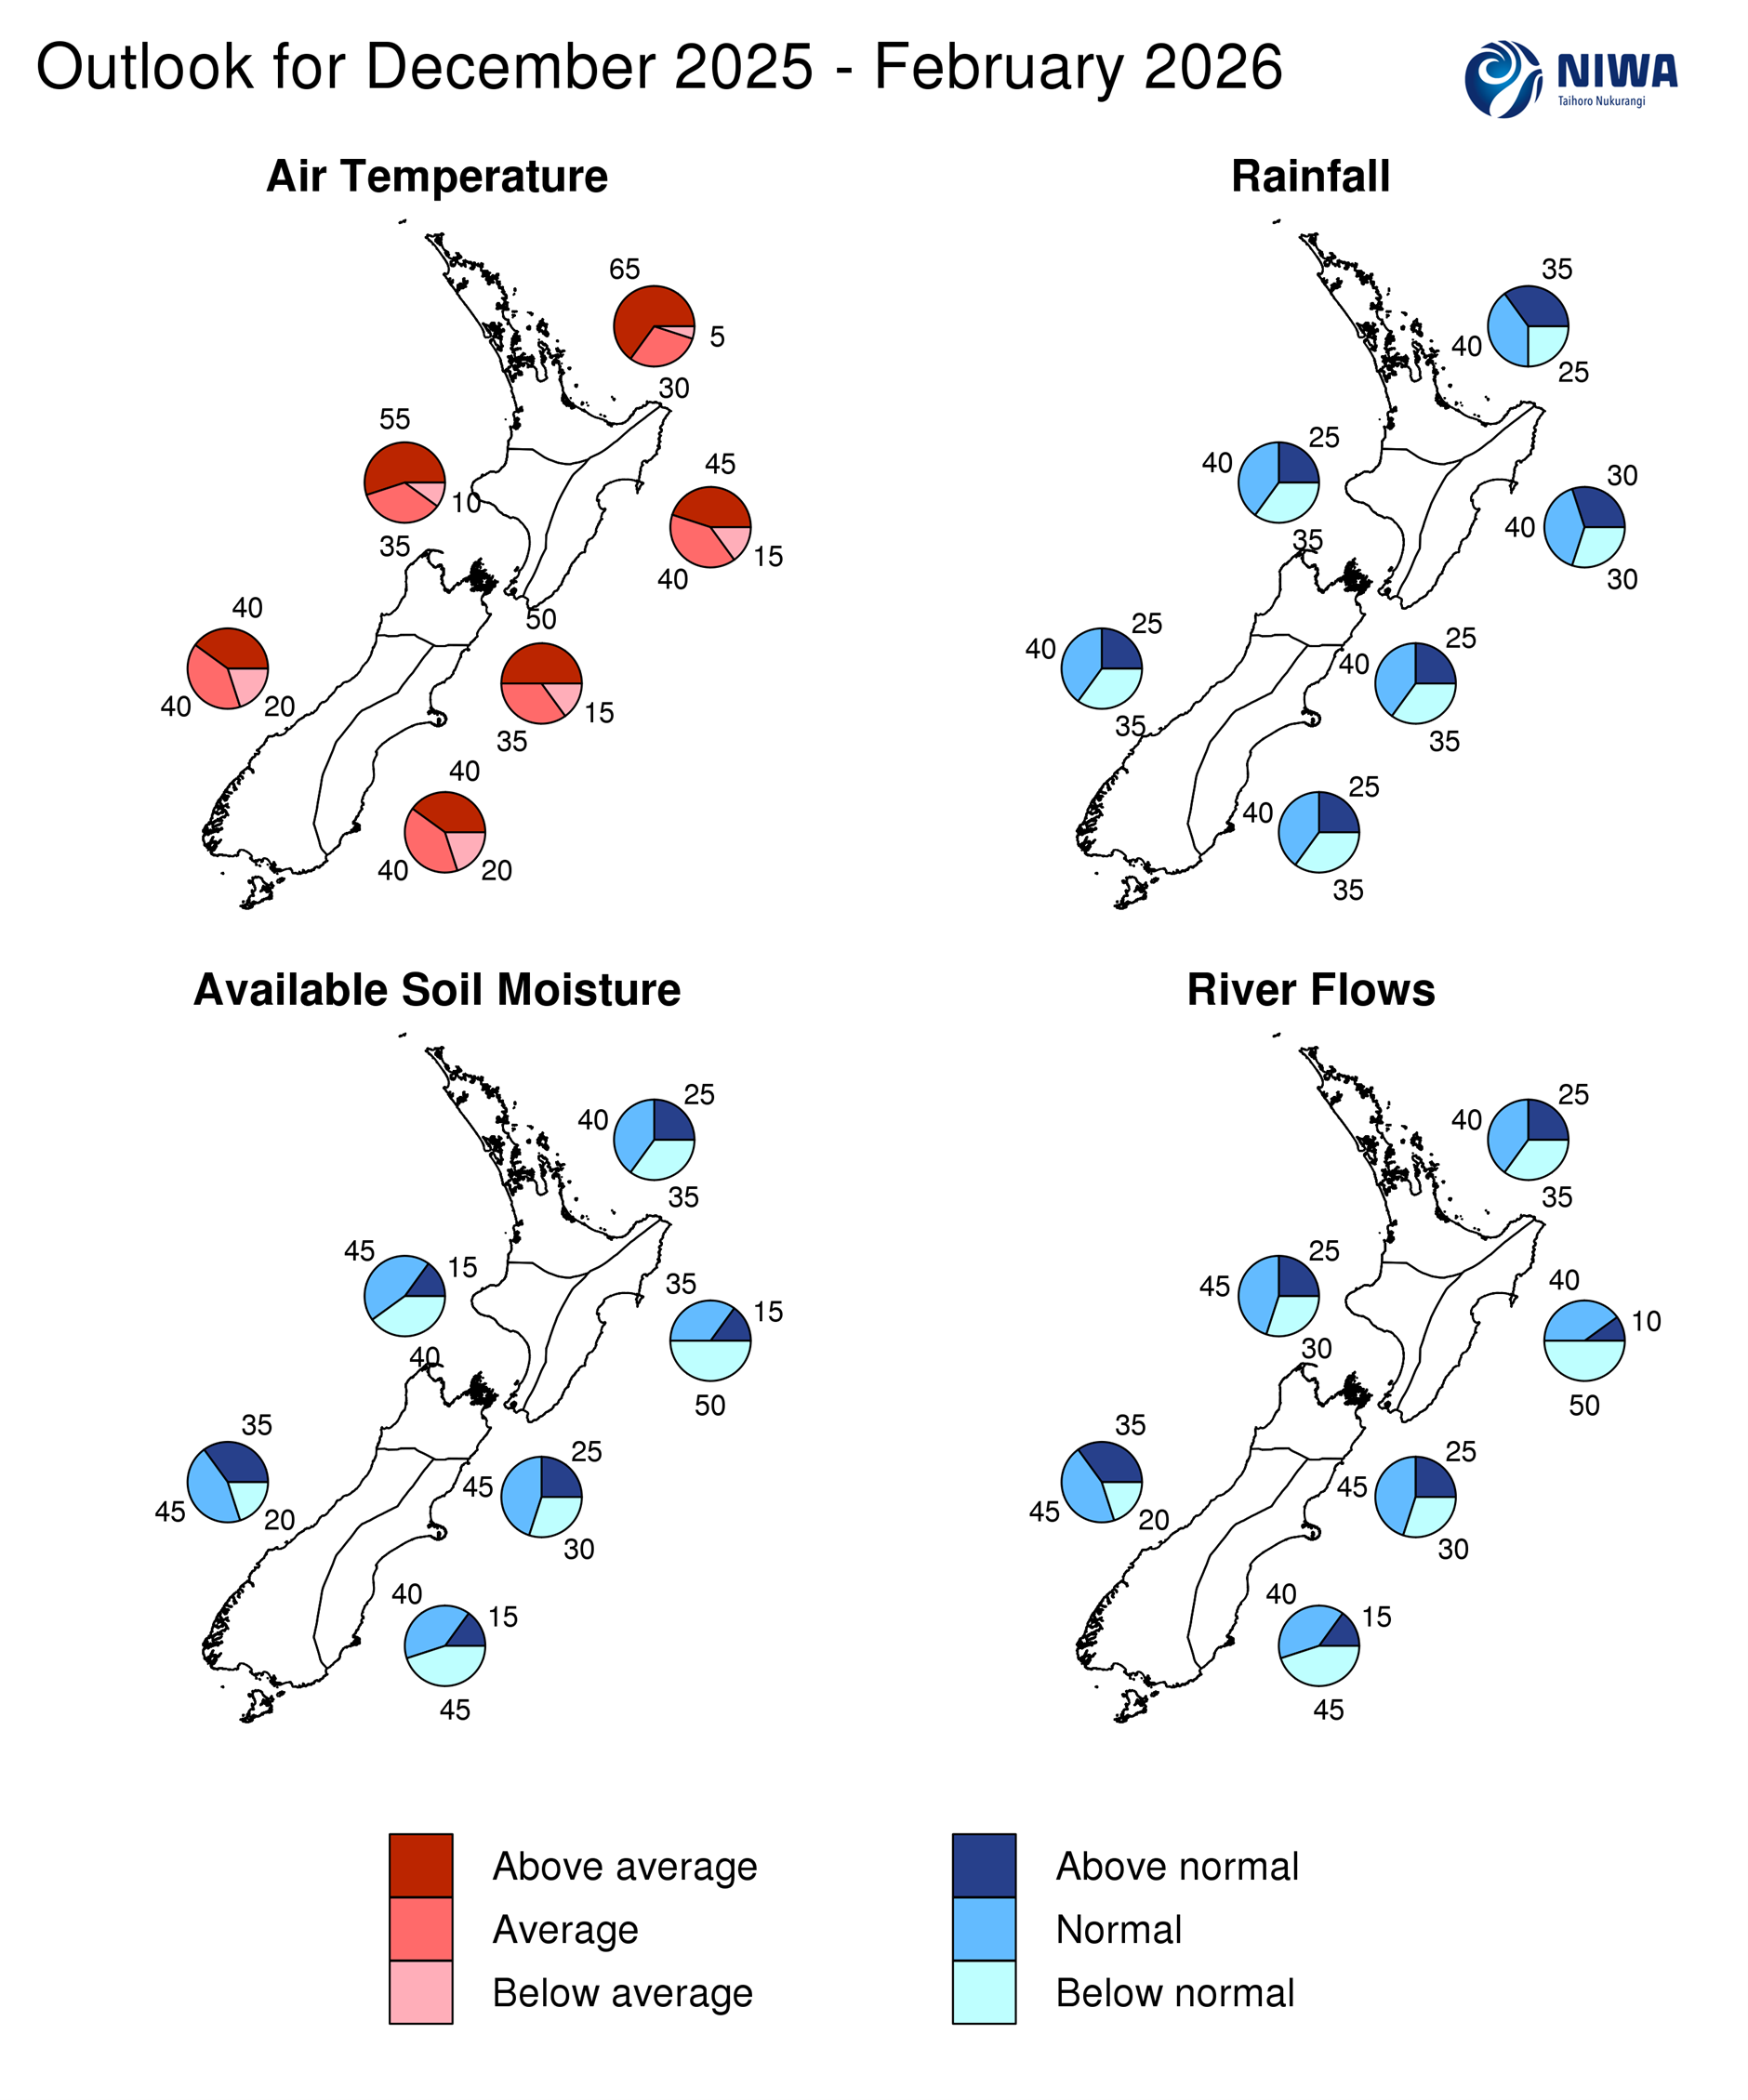
- Seasonal air temperatures are very likely to be above average for the north of the North Island, and most likely to be above average for the west of the North Island and north of the South Island. All other regions of New Zealand have about equal chances for near average or above average summer temperatures.
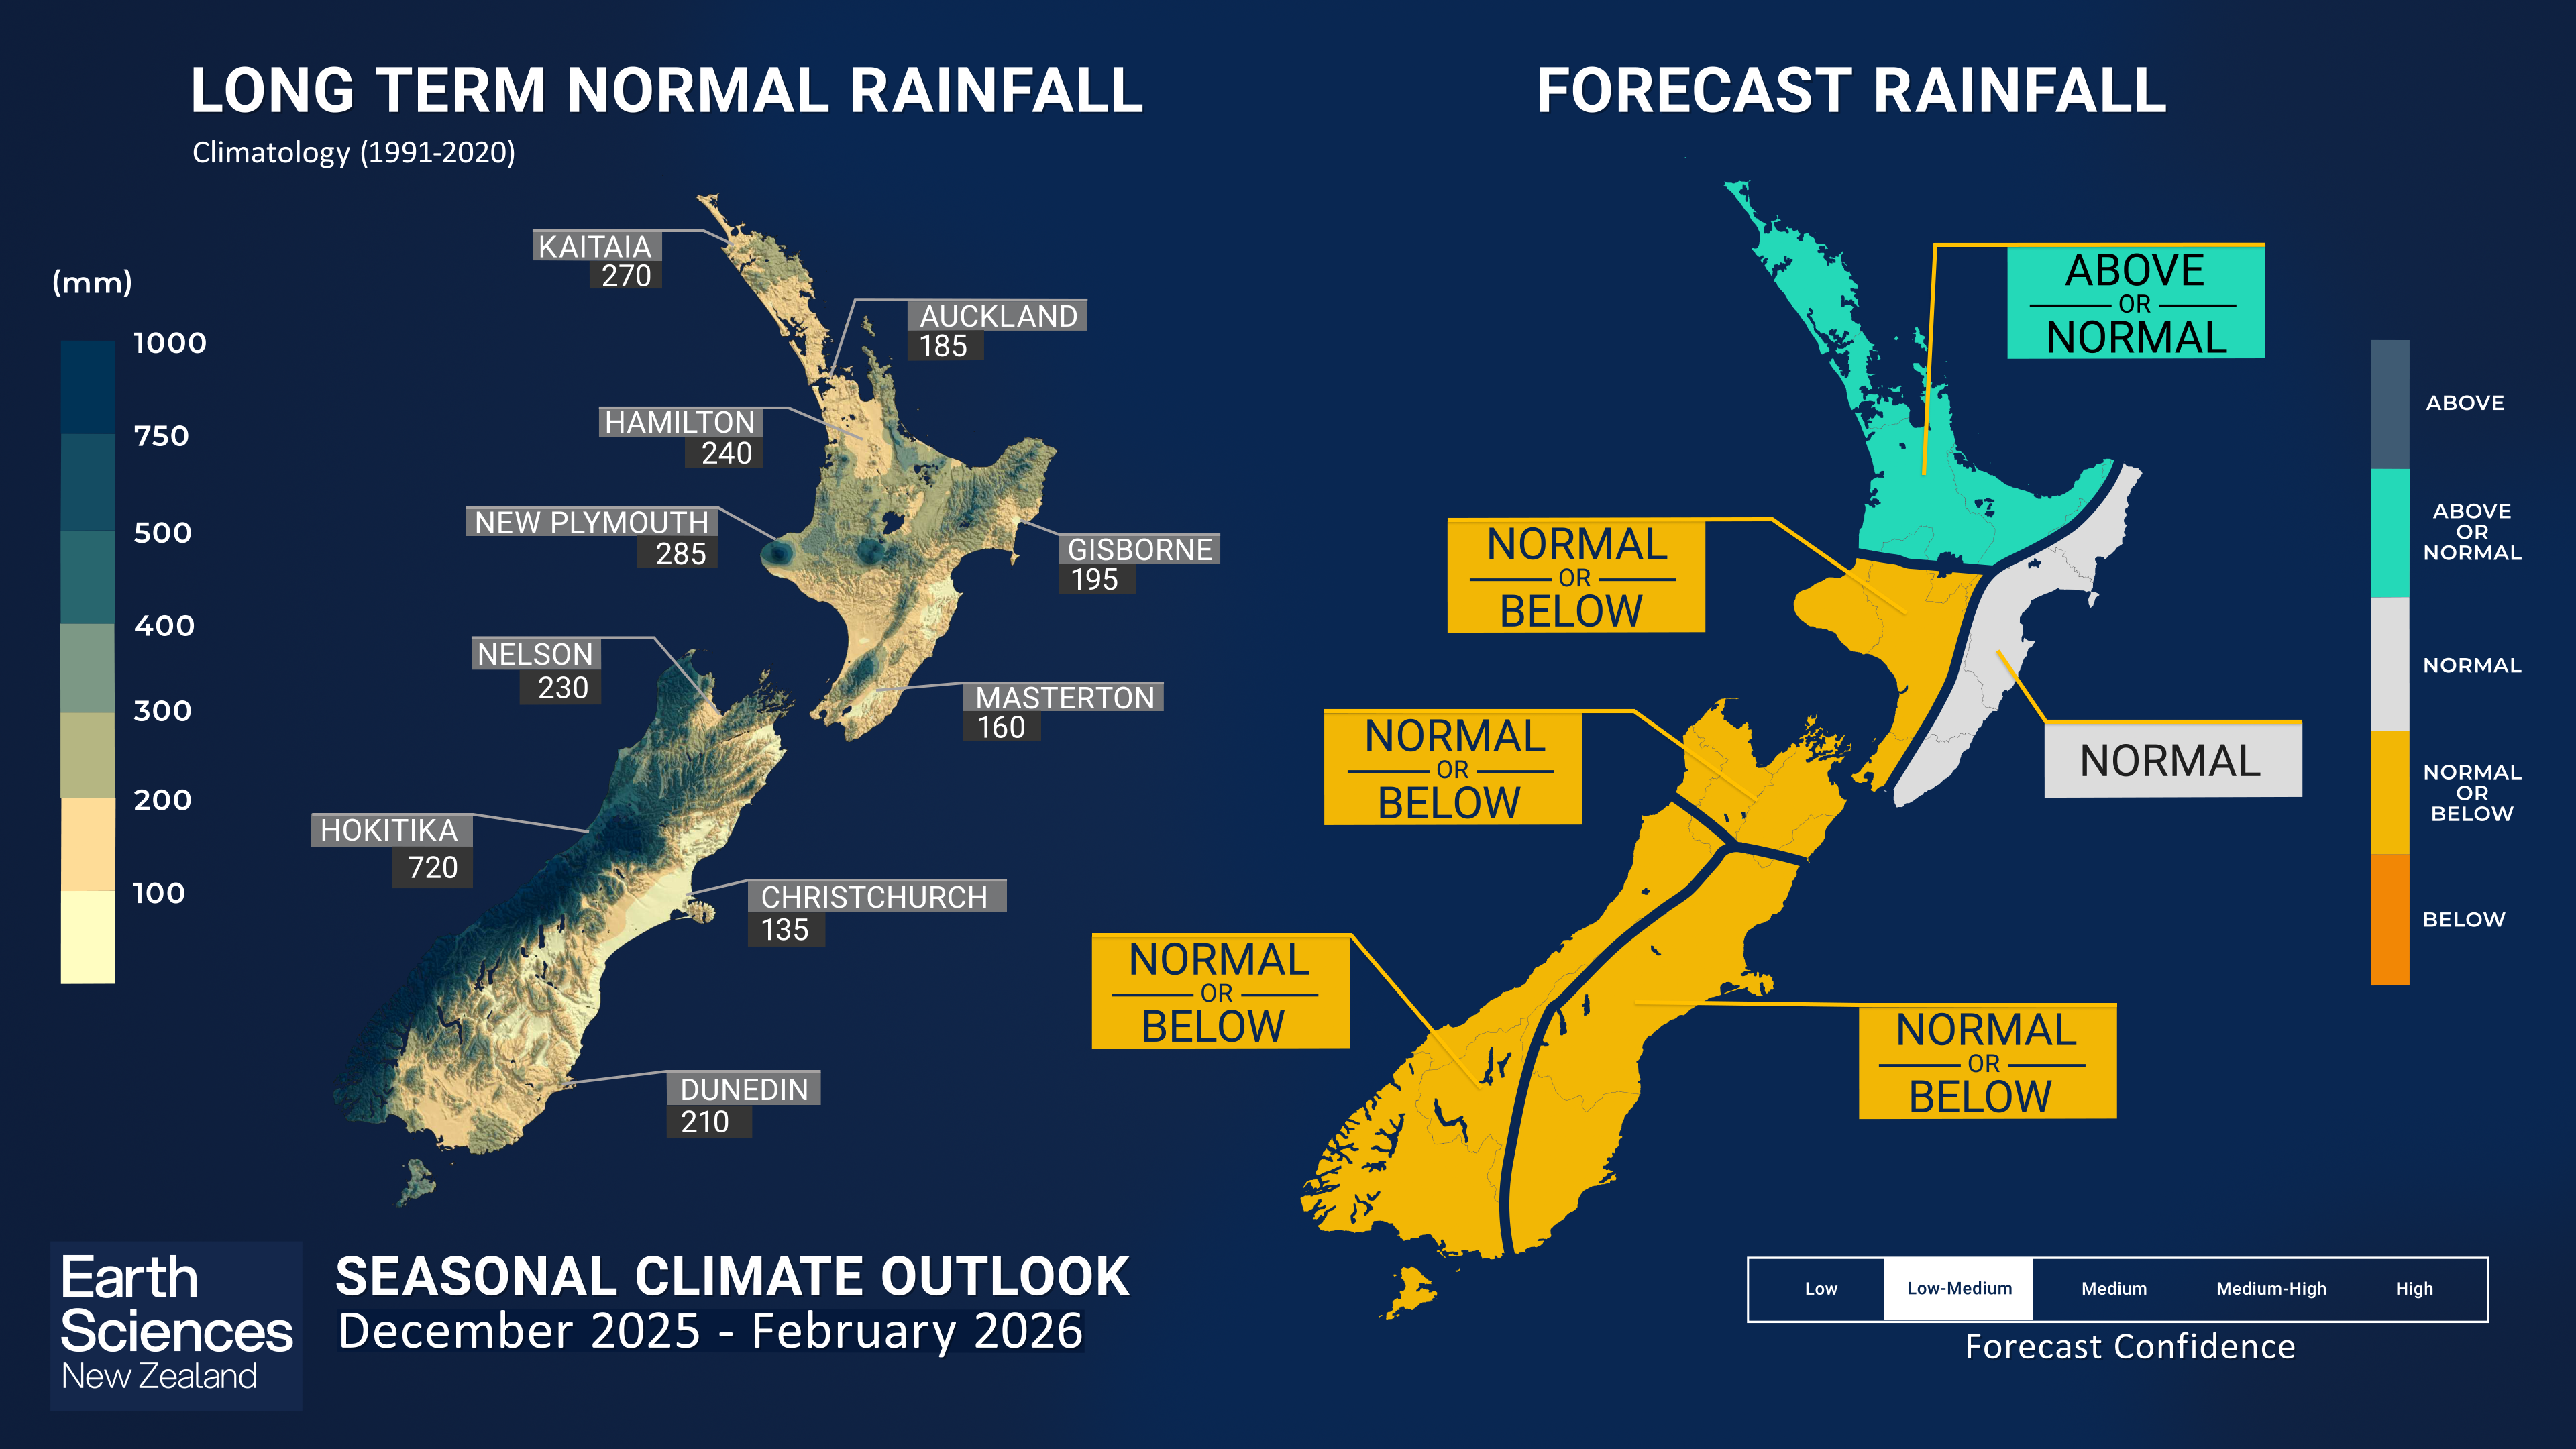
- December – February rainfall totals are about equally likely to be normal or below normal for most of the country, except for the north of the North Island where normal or above average rainfall is favoured, and for the east of the North Island where rainfall is most likely to be near normal. In this latter region, the tercile distribution (or probability of other outcomes) is particularly uncertain, reflecting both the geography of the region and the transition to a potentially wetter pattern later in summer.
- During December 2025 – February 2026, soil moisture levels and river flows are forecast to be below normal for the east of the North Island, and near or below normal for the north of the North Island and east of the South Island. Near normal soil moisture levels and river flows are forecast for the west and north of the South Island. For the west of the North Island, below normal or near normal soil moisture levels are forecast, while river flows are most likely to be near normal.
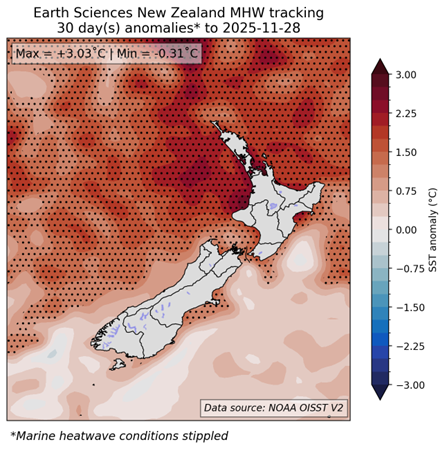
- Ocean waters around New Zealand warmed significantly during November 2025, particularly around the North Island. Marine heatwave (MHW) conditions - defined as sea surface temperatures (SSTs) exceeding the climatological 90th percentile for at least five consecutive days - returned across most coastal waters, as well as large offshore areas near the North Island and west of the South Island. In some locations, ‘extreme’ MHW conditions are occurring, with SSTs exceeding four times the 90th percentile threshold. Global forecast models indicate that ocean temperatures around New Zealand are likely to remain warmer than average over the summer period, which is expected to have an upward influence on seasonal air temperatures. Monitor the SST update for updates.
Regional predictions for December 2025 – February 2026
The tables below show the probabilities (or percent chances) for each of three categories: above average, near average, and below average. In the absence of any forecast guidance there would be an equal likelihood (33% chance) of the outcome for any of the three categories. Forecast information from local and global guidance models is used to indicate the deviation from equal chance that is expected for the coming three-month period.
All outlooks are for the three months averaged as a whole. During these three months, there will inevitably be relatively wet and dry periods, as well as hot and cold periods. The exact range in temperature and rainfall within each of the three categories varies with location and season. However, as a guide, the “near average” or middle category for the temperature predictions includes deviations up to ±0.5°C relative to the long-term mean, whereas for rainfall the “near normal” category lies between 80 percent and 120 percent of the long-term (1991-2020) mean.
Northland, Auckland, Waikato, Bay of Plenty
- Temperatures are very likely to be above average (65% chance).
- Rainfall totals are about equally likely to be near normal (40% chance) or above normal (35% chance). Rain events originating from, or having connections with, the sub-tropics and tropics may increase the chances for heavy rainfall events, especially during the second half of summer.
- Soil moisture levels and river flows are about equally likely to be near normal (40% chance) or below normal (35% chance).
| Temperature | Rainfall | Soil moisture | River flows | |
| Above average | 65 | 35 | 25 | 25 |
| Near average | 30 | 40 | 40 | 40 |
| Below average | 5 | 25 | 35 | 35 |
Central North Island, Taranaki, Whanganui, Manawatu, Wellington
Probabilities are assigned in three categories: above average, near average, and below average.
- Temperatures are most likely to be above average (55% chance).
- Rainfall totals are about equally likely to be near normal (40% chance) or below normal (35% chance).
- Soil moisture levels and river flows are most likely to be near normal (45% chance).
| Temperature | Rainfall | Soil moisture | River flows | |
| Above average | 55 | 25 | 15 | 25 |
| Near average | 35 | 40 | 45 | 45 |
| Below average | 10 | 35 | 40 | 30 |
Gisborne, Hawke’s Bay, Wairarapa
Probabilities are assigned in three categories: above average, near average, and below average.
- Temperatures are about equally likely to be above average (45% chance) or near average (40% chance).
- Rainfall is most likely to be near normal (40% chance), but below-normal and above-normal outcomes (30% chance each) remain plausible, reflecting uncertainty. Early summer may lean dry, while later in the season, occasional rain events of tropical or sub-tropical origin could shift totals above normal—though these may not materialise.
- Soil moisture levels and river flows are most likely to be below normal (50% chance).
| Temperature | Rainfall | Soil moisture | River flows | |
| Above average | 45 | 30 | 15 | 10 |
| Near average | 40 | 40 | 35 | 40 |
| Below average | 15 | 30 | 50 | 50 |
Tasman, Nelson, Marlborough, Buller
Probabilities are assigned in three categories: above average, near average, and below average.
- Temperatures are most likely to be above average (50% chance).
- Rainfall totals are about equally likely to be near normal (40% chance) or below normal (35% chance).
- Soil moisture levels and river flows are most likely to be near normal (45% chance).
| Temperature | Rainfall | Soil moisture | River flows | |
| Above average | 50 | 25 | 25 | 25 |
| Near average | 35 | 40 | 45 | 45 |
| Below average | 15 | 35 | 30 | 30 |
West Coast, Southern Alps and foothills, inland Otago, Southland
Probabilities are assigned in three categories: above average, near average, and below average.
- Temperatures are equally likely to be above average (40% chance) or near average (40% chance).
- Rainfall totals for the summer season as a whole are about equally likely to be near normal (40% chance) or below normal (35% chance).
- Soil moisture levels and river flows are most likely to be near normal (45% chance).
| Temperature | Rainfall | Soil moisture | River flows | |
| Above average | 40 | 25 | 35 | 35 |
| Near average | 40 | 40 | 45 | 45 |
| Below average | 20 | 35 | 20 | 20 |
Coastal Canterbury and the nearby plains, east Otago
Probabilities are assigned in three categories: above average, near average, and below average.
- Temperatures are equally likely to be above average (40% chance) or near average (40% chance).
- Rainfall totals for the summer season as a whole are about equally likely to be near normal (40% chance) or below normal (35% chance).
- Soil moisture levels and river flows are about equally likely to be below normal (45% chance) or near normal (40% chance).
The full probability breakdown is:
| Temperature | Rainfall | Soil moisture | River flows | |
| Above average | 40 | 25 | 15 | 15 |
| Near average | 40 | 40 | 40 | 40 |
| Below average | 20 | 25 | 45 | 45 |
Background
Sea surface temperatures (SSTs) in the central equatorial Pacific, as measured by the Niño 3.4 Index, have continued to cool. Below-average SSTs dominate the equatorial Pacific from the International Date Line eastward. The preliminary Niño 3.4 anomaly for November (based on data through 28 November) is -0.70°C. All Niño indices remain negative, and the Relative Niño 3.4 Index (RONI*) has cooled further, with its latest 30-day value (to 28 November) at -0.91°C.
The Southern Oscillation Index (SOI) in November 2025 remained above the La Niña threshold, with a current month-to-date value of +1.2 standard deviation. It has now been in La Niña territory for two consecutive months.
Subsurface ocean temperatures in the eastern and central Pacific remained significantly cooler than average, with anomalies locally exceeding –5°C. These cooler waters extended eastward at depths between 50 m and 150 m, indicating an increase in the spatial extent of below-average subsurface temperatures. Compared to last month, subsurface temperatures in the western Pacific remained above average; however, there has been a recent weakening of positive anomalies west of 150°E at depths shallower than 50 m. Despite these changes, the pronounced east–west gradient in subsurface temperature anomalies continues to reflect persistent oceanic La Niña conditions.
Accordingly, negative upper-ocean heat content anomalies (ocean temperature anomalies integrated over the top 300m of the ocean) remain present from 160°W to the South American coast, with anomalies exceeding -1.5°C.
In summary, coupling between the Pacific Ocean and the atmosphere has continued, with indices for both the oceanic and atmospheric components of ENSO exceeding La Niña thresholds, indicating that La Niña is currently present in the tropical Pacific.
The newly developed Relative Oceanic Niño Index forecasts (see https://niwa.co.nz/news/warming-oceans-prompt-major-overhaul-how-we-monitor-el-nino-and-la-nina) indicate a 50% probability that La Niña conditions will persist through the December 2025–February 2026 period. Similarly, the IRI/CPC forecasts, based on the traditional Niño 3.4 index, support this outlook. Current projections suggest that La Niña will peak early in the three-month period before rapidly weakening toward ENSO-neutral conditions by late summer.
The Southern Annular Mode (SAM) has been consistently negative during the month of November 2025 (with about 89% of days below -0.5 Standard Deviation); the latest 30 days SAM index value is negative (below 1 standard deviation) at -1.1 std. Contrary to September and October, negative SAM values have not been accompanied by typical circulation anomalies over New Zealand, likely because the SAM index has been heavily influenced by pressure anomalies over Antarctica and near South America.
The negative Indian Ocean Dipole (IOD) event peaked early in November, and decayed with increasing rapidity throughout the month. The latest month-to-date IOD value (to 28 November) is -0.67 (compared to -1.1 for October). Model forecasts and persistence clearly indicate it will return to neutral conditions in December. This has been a historically extreme event, but its demise is in-line with the typical life cycle of the IOD.
During November 2025, a modest Madden–Julian Oscillation (MJO) pulse strengthened at various intervals while remaining unusually slow-moving in the eastern Maritime Continent and western Pacific (Phases 5 and 6). OLR signatures associated with the MJO were biased uncharacteristically westwards at times, possibly due to ongoing destructive interference with the La Niña base state, although zonal wind anomalies were more typical of the MJO in these phases.
The forecast consensus is for further eastward propagation over the next two to three weeks, with the speed ultimately becoming faster than what was observed over the last month or so. As it moves through Phases 6 and 7 in early December, an increase in tropical cyclone potential is signalled in the Southwest Pacific, but as it enters Phase 8 and possibly Phase 1, this is likely to be replaced by a subdued signal in the local tropics, which has potential to drive a pattern change over New Zealand.
A Sudden Stratospheric Warming (SSW) occurred in early September, with its effects lingering strongly through October and then to a lesser extent in November, which included the persistent negative SAM. Current polar stratospheric analysis suggests the Final Stratospheric Warming has occurred, and the polar stratosphere has transitioned to its summertime state. However, unusually high pressure anomalies over Antarctica are expected to continue influencing circulation patterns around New Zealand. Airflows may deviate from typical La Niña patterns, with comparatively infrequent easterly to northeasterly winds through the season as a whole. Consequently, rainfall patterns during the first month of summer may not align with historical La Niña impacts.
Regional and local SSTs are warmer-than-average, expanded and intensified, particularly around the North Island, during November. Marine heatwave (MHW) conditions - defined as SSTs exceeding the climatological 90th percentile for at least five consecutive days - returned across most coastal waters, as well as large offshore areas near the North Island and west of the South Island. In some locations, ‘extreme’ MHW conditions are occurring, with SSTs exceeding four times the 90th percentile threshold. Global forecast models indicate that ocean temperatures around New Zealand are likely to remain warmer than average over the summer period.
| North NI | +2.00°C |
| West NI | +1.73°C |
| East NI | +1.39°C |
| North SI | +1.05°C |
| West SI | +0.69°C |
| East SI | +0.96°C |
[*]The Relative Oceanic Niño 3.4 Index (RONI) is a modern way of measuring oceanic El Niño and La Niña that is complementary to traditional oceanic indices. While traditional oceanic indices like the Niño 3.4 Index monitor SSTs in one region, the RONI compares the average SST in the central equatorial Pacific with the average SST across the global tropics. Since tropical rainfall patterns respond to changes in ocean temperatures, this new relative index can help forecasters better determine if the equatorial Pacific is warmer or cooler than the rest of the global tropics, which has become more challenging to discern as seas warm because of climate change.
Forecast Confidence
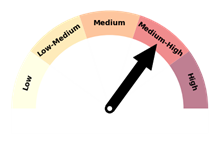
Temperature
Forecast confidence for temperatures is Medium-High. Emerging and strengthening marine heatwaves provide a baseline of warming, especially to nighttime temperatures. A transition to broader easterly anomalies in the final third may suppress daytime temperatures in some areas, but not enough to compensate.
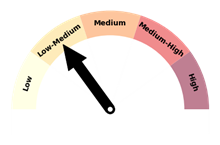
Rainfall
Forecast confidence for rainfall is Low-Medium. Warm SSTs provide significant fuel for weather systems, but are insufficient in themselves to bring high rainfall. It is uncertain whether the expected change to broader potential for wet conditions later in the period will be widespread, or if mid-season dryness will dominate.
