Outlook Summary
- The effect of a minor Sudden Stratospheric Warming (SSW) event in July-August is expected to contribute to lower than normal air pressure south of Aotearoa New Zealand during September, leading to unsettled and windy weather patterns, particularly in the west.
- La Niña-like patterns may develop in mid-to-late spring, favouring the return of higher than normal air pressure to New Zealand. A La Niña Watch continues and there is a 50% chance that an event officially develops by the end of spring. See the background for more.
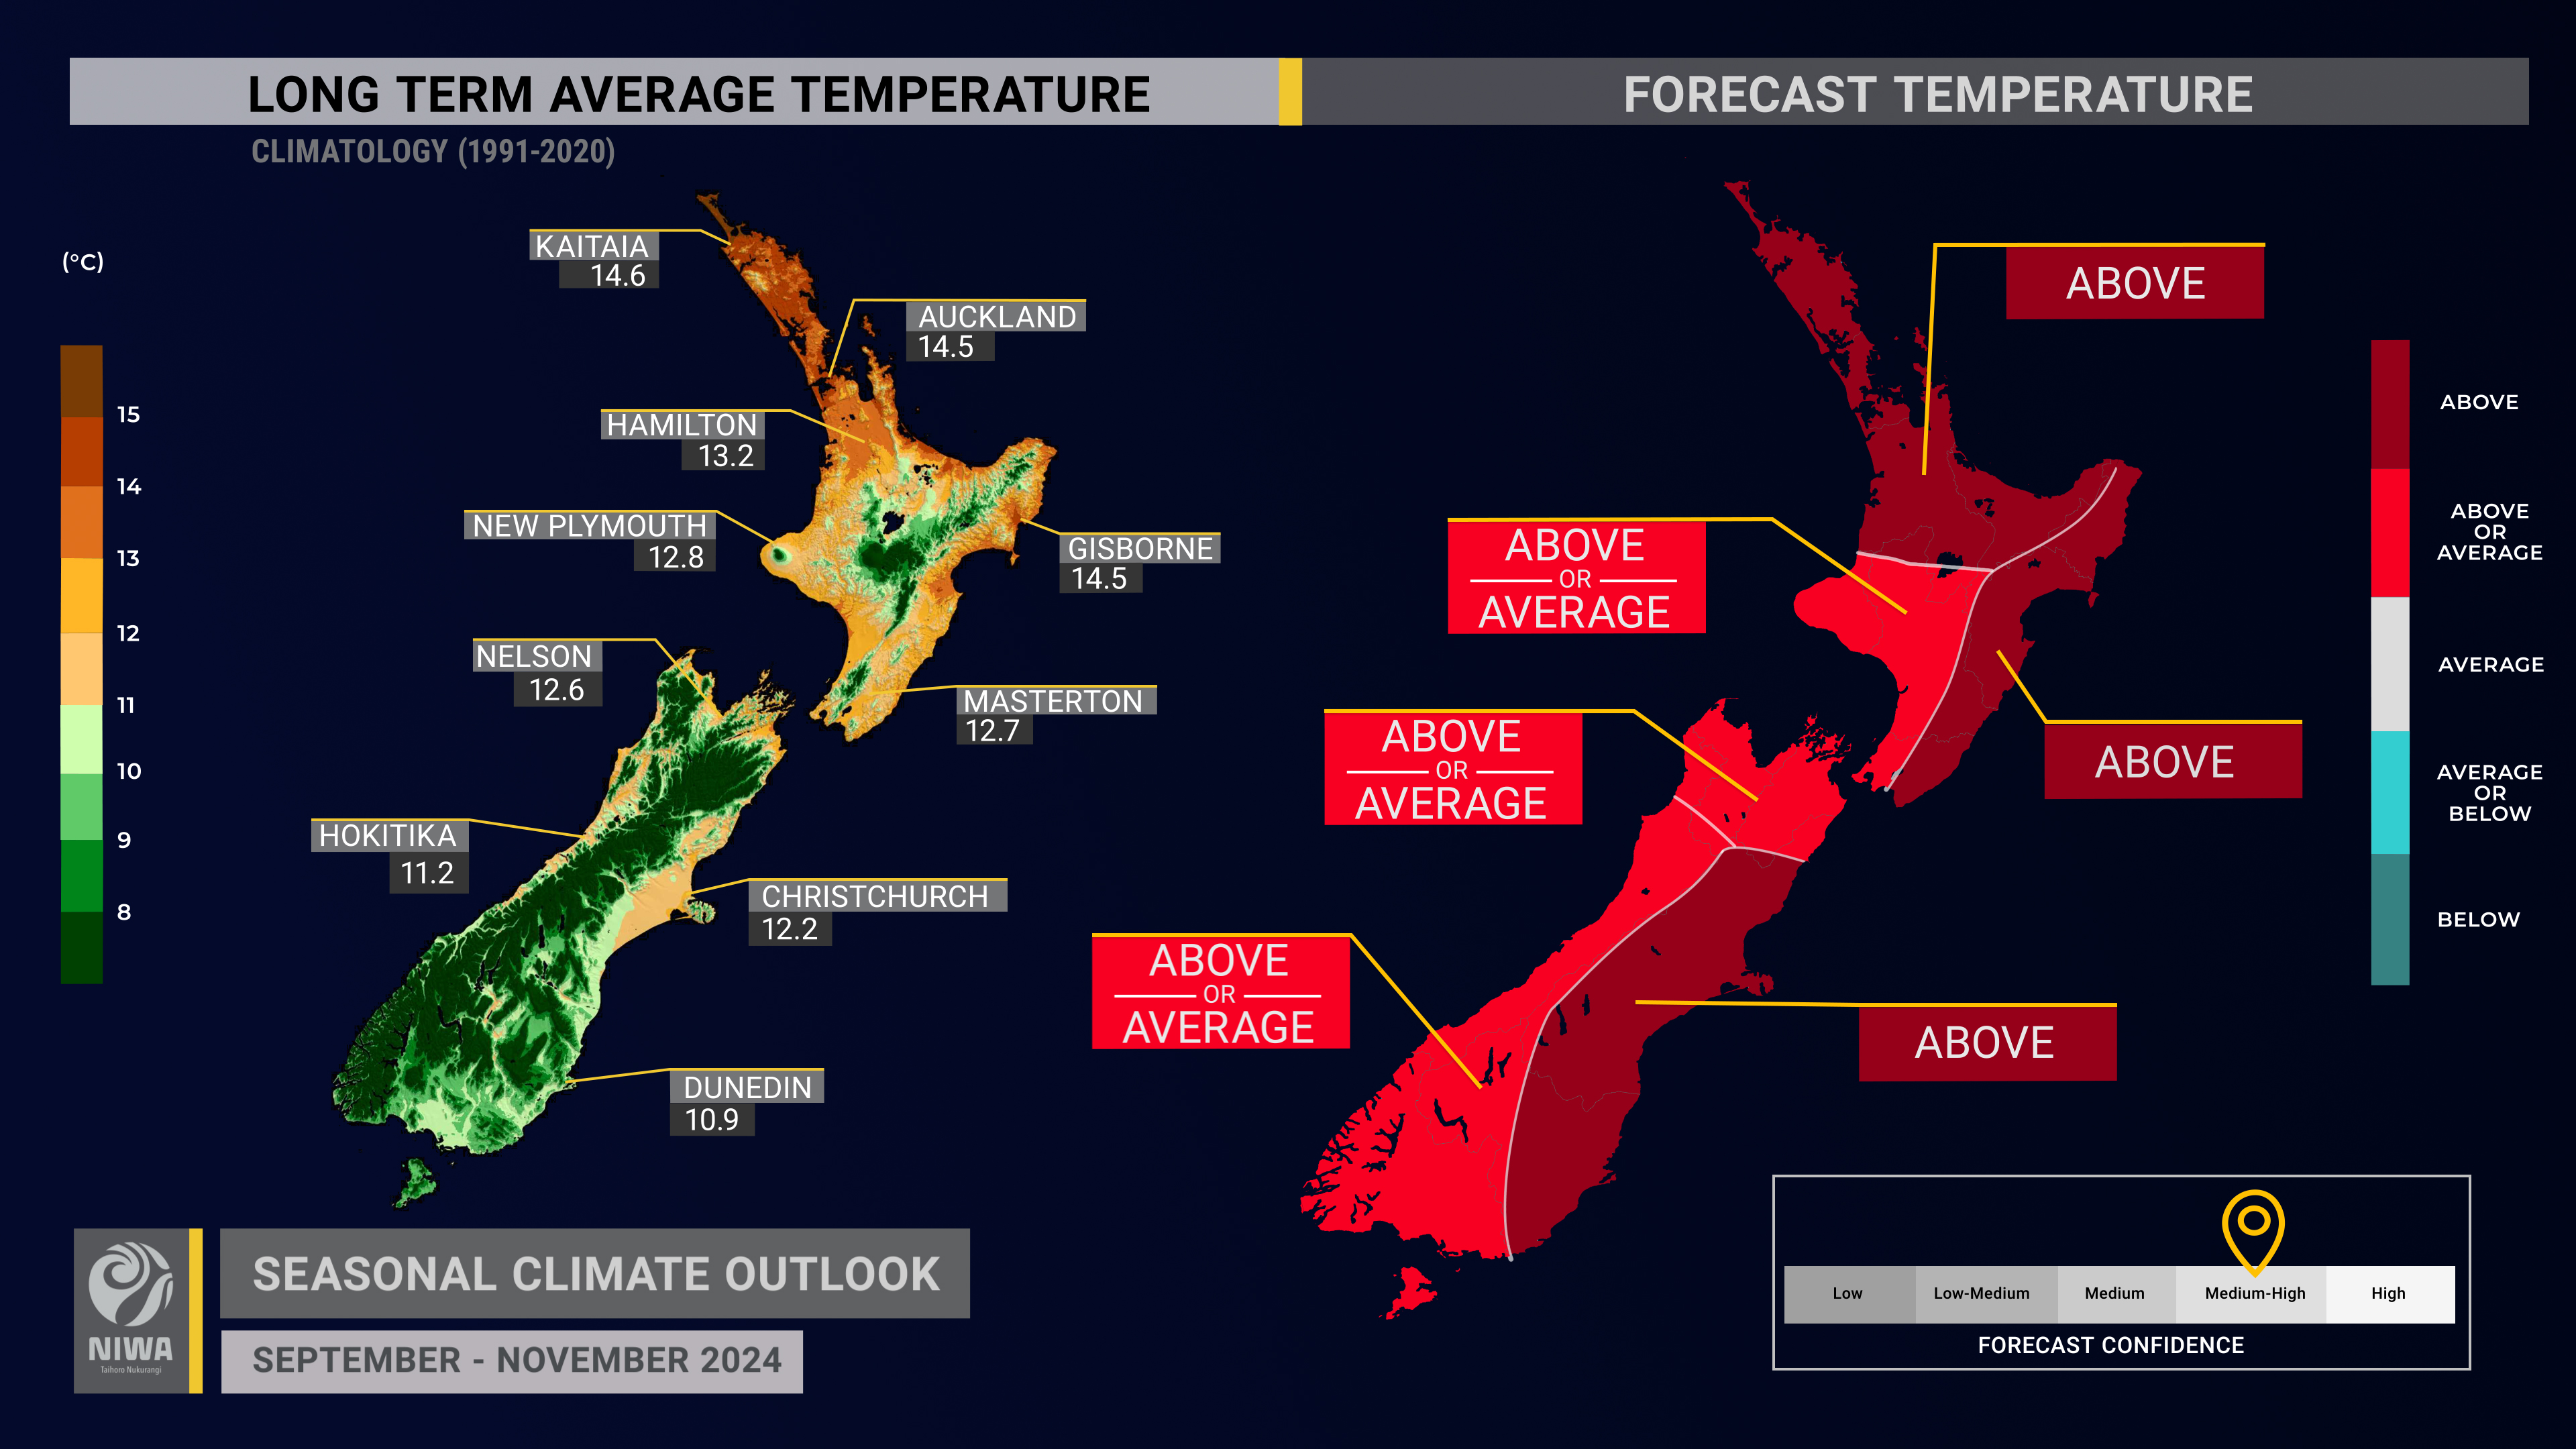
- Spring temperatures are most likely to be above average in the north and east of the North Island and east of the South Island. Spells of unusual spring warmth are likely as warm air masses from Australia occasionally flow eastward into New Zealand. Near average or above average temperatures are about equally likely for all remaining regions.
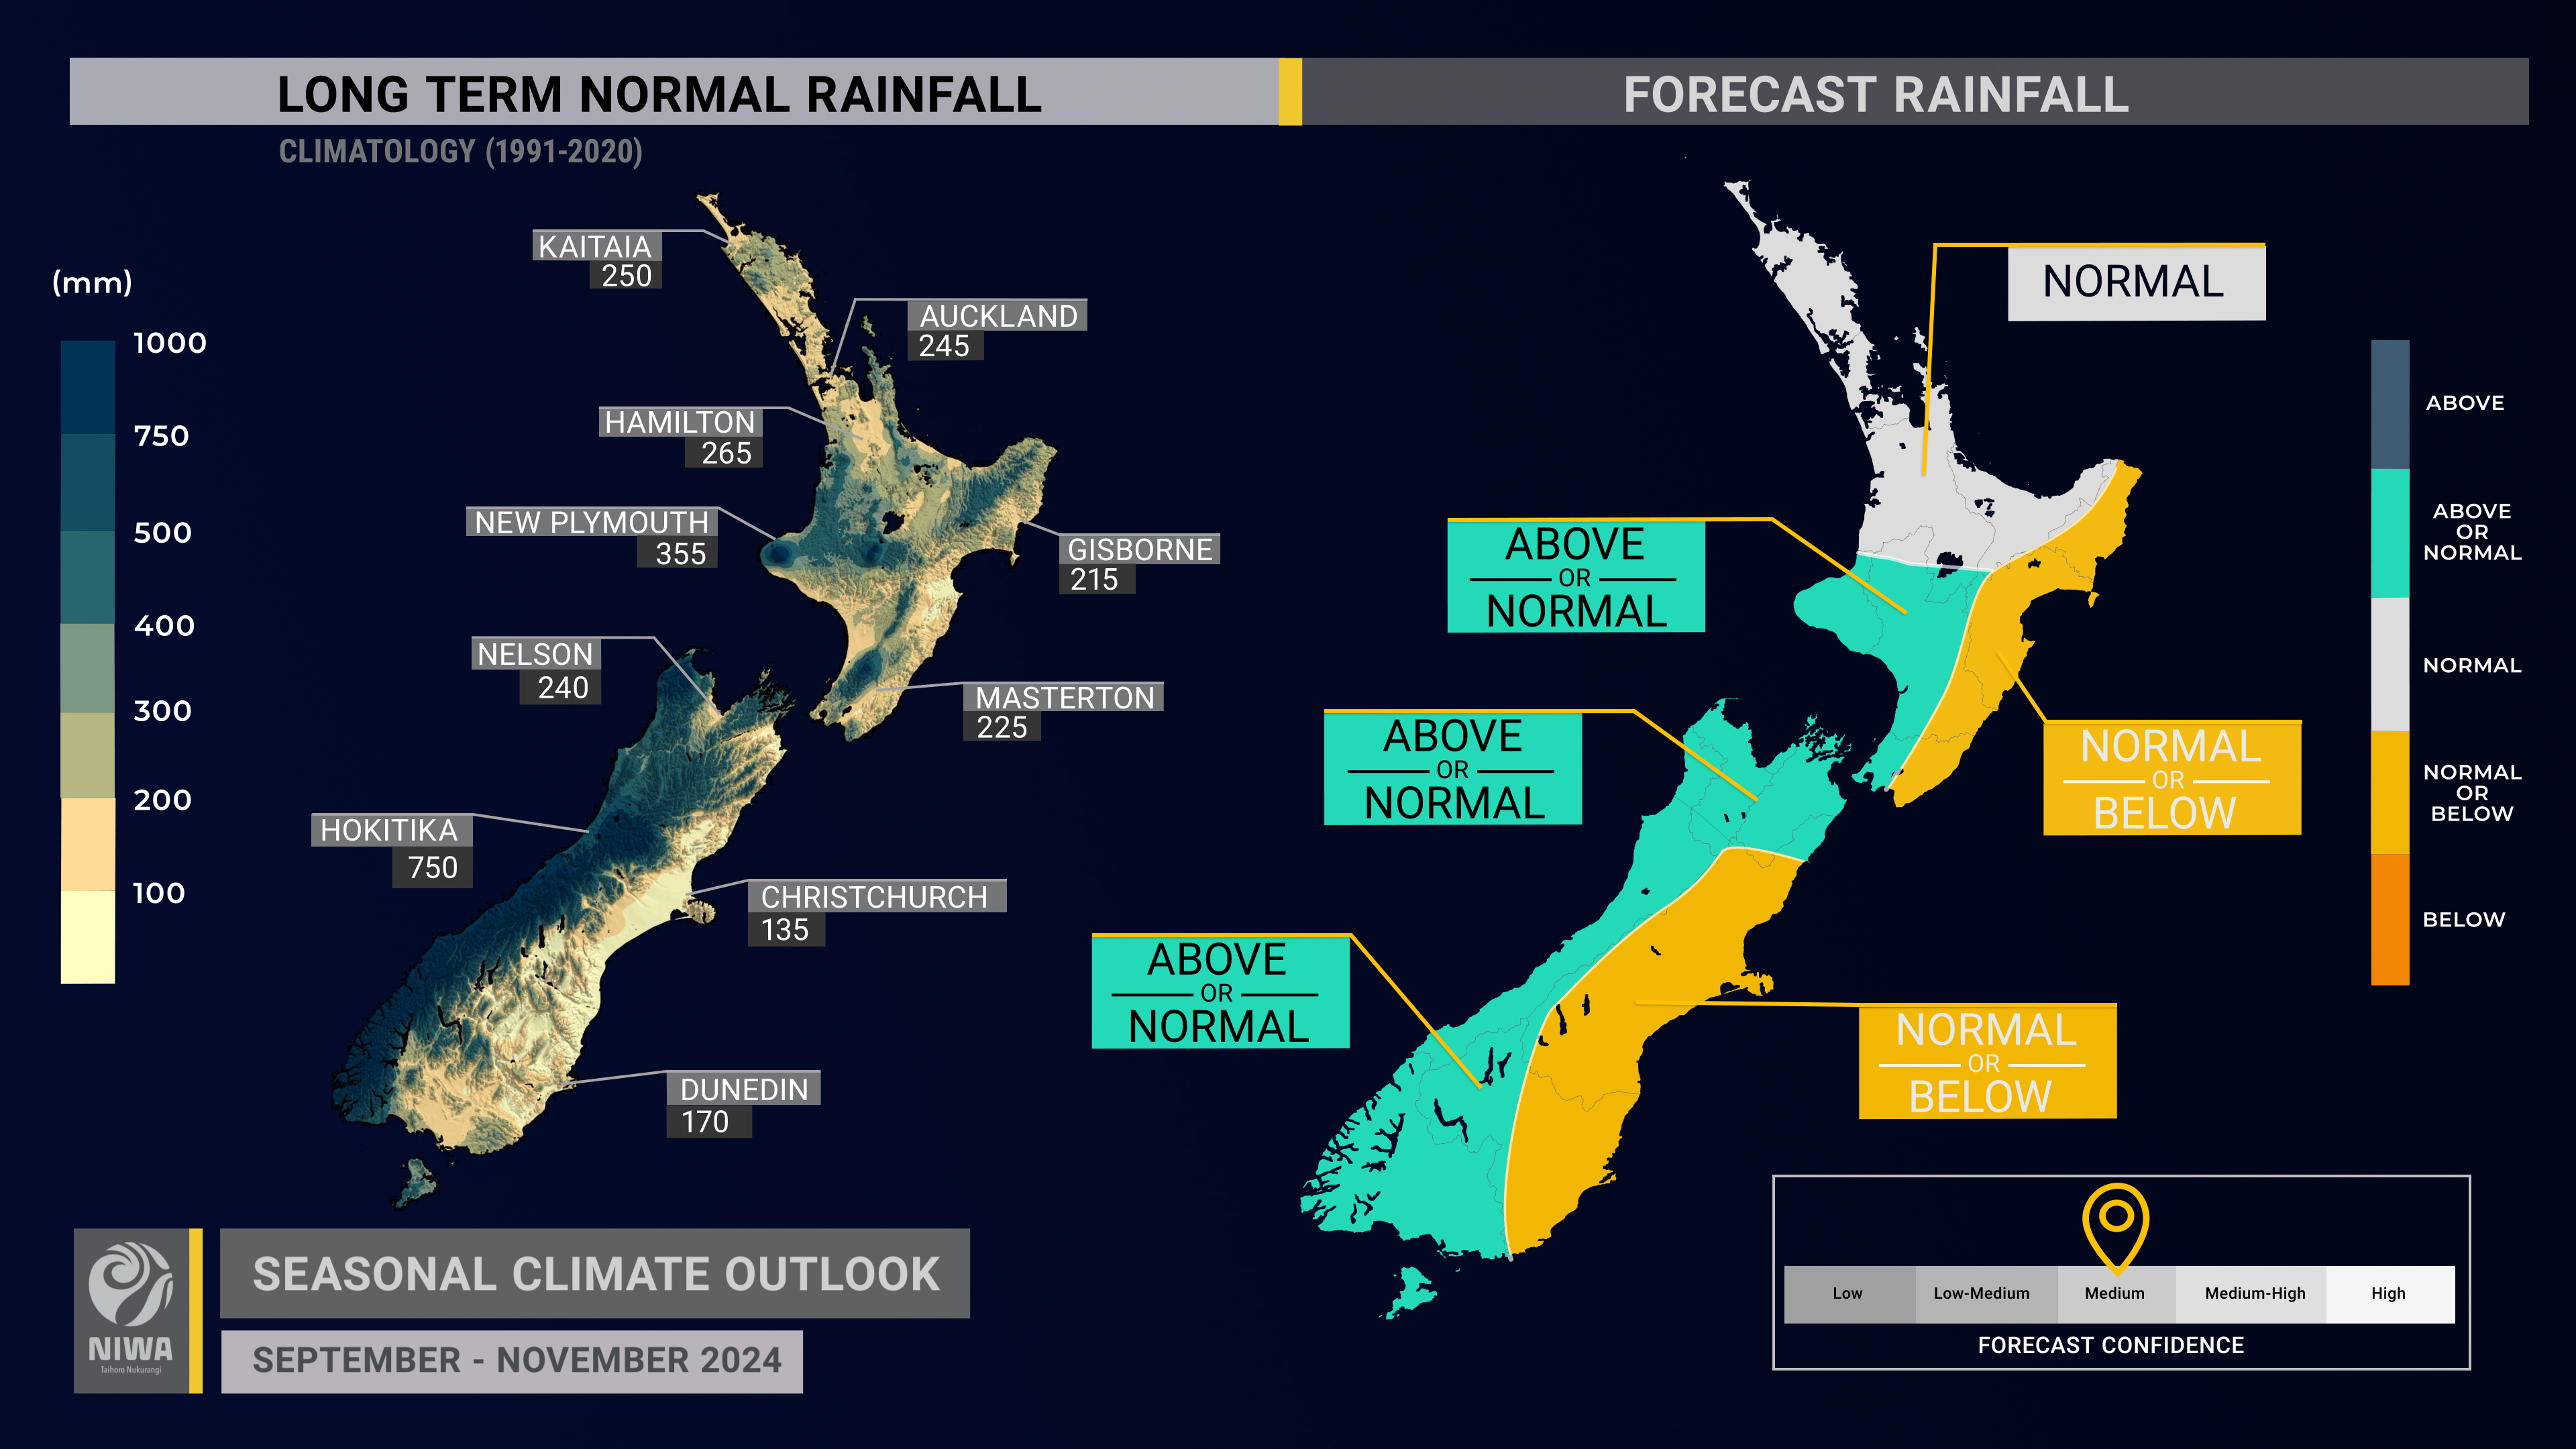
- Spring rainfall is about equally likely to be near normal or above normal in the west of the North Island and north and west of the South Island, consistent with more westerly quarter winds, fronts, and low pressure systems, especially early in spring. Near normal spring rainfall is most likely in the north of the North Island with near normal or below normal rainfall about equally likely in the east of both islands. Monitor NIWA35 for updates.
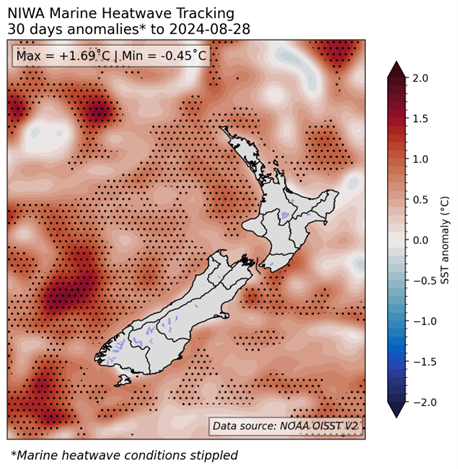
- Coastal sea surface temperatures (SSTs) ranged from 0.45˚C to 0.64˚C above average during August, an increase of 0.1˚C to 0.2˚C compared to July. Monitor the SST update for updates.
- Winter snowfall, catchment-level river flows, and groundwater recharge were below normal in several regions. These factors could present challenging conditions for water-reliant sectors heading into spring.
- Spring soil moisture levels are most likely to be near normal in all regions of the country.
- Spring river flows are most likely to be near normal in the west of the North Island and the north and west of the South Island and about equally likely to be near normal or below normal in all remaining regions.
Regional predictions for September – November 2024
The tables below show the probabilities (or percent chances) for each of three categories: above average, near average, and below average. In the absence of any forecast guidance there would be an equal likelihood (33% chance) of the outcome for any of the three categories. Forecast information from local and global guidance models is used to indicate the deviation from equal chance that is expected for the coming three-month period. All outlooks are for the three months as a whole. There will inevitably be relatively wet and dry days, and hot and cold days, within a season. The exact range in temperature and rainfall within each of the three categories varies with location and season. However, as a guide, the “near average” or middle category for the temperature predictions includes deviations up to ±0.5°C for the long-term mean, whereas for rainfall the “near normal” category lies between 80 per cent and 120 per cent of the long-term (1991-2020) mean.
Northland, Auckland, Waikato, Bay of Plenty
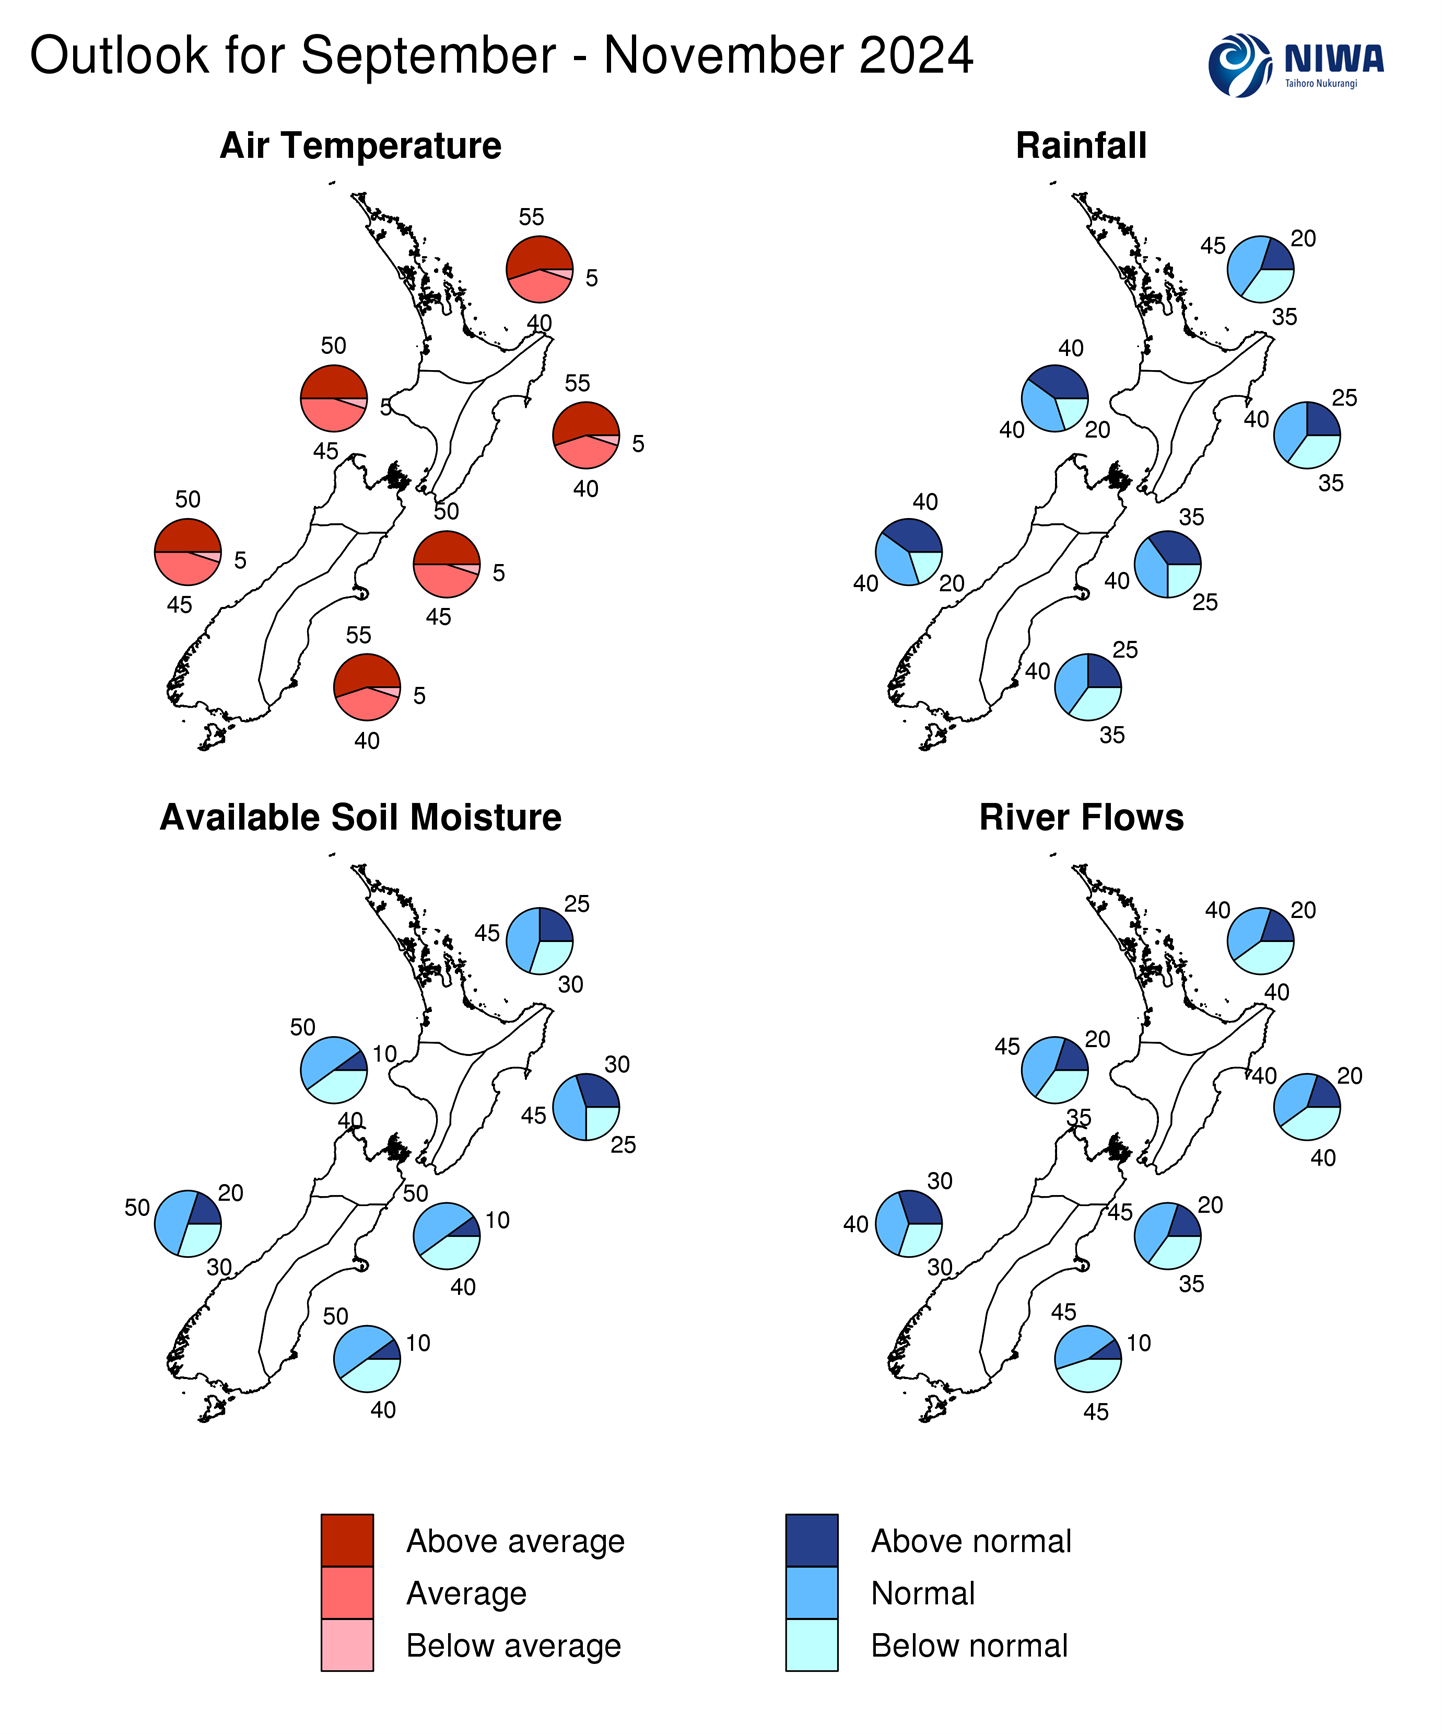
- Temperatures are most likely to be above average (55% chance).
- Rainfall totals are most likely to be near normal (45% chance). Regular fronts are expected to impact southern parts of the region during September, although a trend toward high pressure in mid-to-late spring could see rainfall turn less frequent.
- Soil moisture levels are most likely to be near normal (45% chance) while river flows are equally likely to be near normal or below normal (40% chance each).
| Temperature | Rainfall | Soil moisture | River flows | |
| Above average | 55 | 20 | 25 | 20 |
| Near average | 40 | 45 | 45 | 40 |
| Below average | 05 | 35 | 30 | 40 |
Central North Island, Taranaki, Whanganui, Manawatu, Wellington
Probabilities are assigned in three categories: above average, near average, and below average.
- Temperatures are about equally likely to be above average (50% chance) or near average (45% chance).
- Rainfall totals are equally likely to be near normal (40% chance) or above normal (40% chance). Frequent fronts are expected to deliver regular rainfall during September and may sometimes be heavy enough to cause flooding.
- Soil moisture levels and river flows are most likely to be near normal (45-50% chance).
| Temperature | Rainfall | Soil moisture | River flows | |
| Above average | 50 | 40 | 10 | 20 |
| Near average | 45 | 40 | 50 | 45 |
| Below average | 05 | 20 | 40 | 35 |
Gisborne, Hawke’s Bay, Wairarapa
Probabilities are assigned in three categories: above average, near average, and below average.
- Temperatures are most likely to be above average (55% chance). Occasional air masses from Australia will contribute to unusually warm conditions at times during September.
- Rainfall totals are about equally likely to be near normal (40% chance) or below normal (35% chance). Westerly flows during September will likely contribute to dry spells.
- Soil moisture levels are most likely to be near normal (45% chance) while river flows are equally likely to be near normal or below normal (40% chance each).
| Temperature | Rainfall | Soil moisture | River flows | |
| Above average | 55 | 25 | 30 | 20 |
| Near average | 40 | 40 | 45 | 40 |
| Below average | 05 | 35 | 25 | 40 |
Tasman, Nelson, Marlborough, Buller
Probabilities are assigned in three categories: above average, near average, and below average.
- Temperatures are about equally likely to be above average (50% chance) or near average (45% chance).
- Rainfall totals are about equally likely to be near normal (40% chance) or above normal (35% chance). Frequent fronts are expected to deliver regular rainfall during September and may sometimes be heavy enough to cause flooding.
- Soil moisture levels and river flows are most likely to be near normal (45-50% chance).
| Temperature | Rainfall | Soil moisture | River flows | |
| Above average | 50 | 35 | 10 | 20 |
| Near average | 45 | 40 | 50 | 45 |
| Below average | 05 | 25 | 40 | 35 |
West Coast, Southern Alps and foothills, inland Otago, Southland
Probabilities are assigned in three categories: above average, near average, and below average.
- Temperatures are about equally likely to be above average (50% chance) or near average (45% chance). The second week of September may come with a chance for frosts.
- Rainfall totals are equally likely to be near normal (40% chance) or above normal (40% chance). Frequent fronts and lows are expected to deliver regular rainfall during September and may sometimes be heavy enough to cause flooding.
- Soil moisture levels and river flows are most likely to be near normal (40-50% chance).
| Temperature | Rainfall | Soil moisture | River flows | |
| Above average | 50 | 40 | 20 | 30 |
| Near average | 45 | 40 | 50 | 40 |
| Below average | 05 | 20 | 30 | 30 |
Coastal Canterbury and the nearby plains, east Otago
Probabilities are assigned in three categories: above average, near average, and below average.
- Temperatures are most likely to be above average (55% chance). Occasional air masses from Australia will contribute to unusually warm conditions at times during spring.
- Rainfall totals are about equally likely to be near normal (40% chance) or below normal (35% chance). Westerly flows during September will likely contribute to dry spells.
- Soil moisture levels are most likely to be near normal (50% chance) while river flows are equally likely to be near normal or below normal (45% chance each).
The full probability breakdown is:
| Temperature | Rainfall | Soil moisture | River flows | |
| Above average | 55 | 25 | 10 | 10 |
| Near average | 40 | 40 | 50 | 45 |
| Below average | 05 | 35 | 40 | 45 |
Graphical representation of the regional probabilities
Background
Sea surface temperatures(SSTs) remained in the neutral range in the central equatorial Pacific (Niño 3.4 Index) during August (-0.08˚C), decreasing from +0.17˚C at the end of July. As of 27 August, the 30-day Relative Oceanic Niño 3.4 Index[1] (RONI) was -0.63˚C, reflective of the central equatorial Pacific being cooler than the average of the global tropics. A period of enhanced trade winds in September, at least during the first half of the month, will likely result in a cooling trend across the central part of the Pacific, including the Niño 3.4 region.
The Southern Oscillation Index (SOI) was on the La Niña side of neutral during August (+0.9) and neutral from June-August (0.0). Recent SOI variability is characteristic of an ENSO neutral ocean-atmosphere system.
During August, upper-oceanic heat content was 0.5˚C to 1.5˚C below average in the eastern and east-central equatorial Pacific while the West Pacific Warm Pool continued to recharge and was 0.5˚C to 1.5˚C warmer than average. These signatures suggest that the ocean system is leaning toward La Niña.
Because of above normal trade wind speeds, La Niña-like convective patterns, New Zealand weather regimes that have been consistent with La Niña, and an expectation for these conditions to persist, a La Niña Watch continues.
ENSO neutral conditions are favoured to continue through September, although a continued progression of the climate system toward La Niña is expected. There’s a 50% chance for La Niña to fully develop by the end of the spring season. Traditional oceanic indicators for monitoring ENSO are being considered alongside RONI which reveals a more advanced state of La Niña development. It is possible that traditional oceanic monitoring indices fail to reach La Niña thresholds, but RONI reaches the threshold. These differences highlight that weather-related impacts from this possible La Niña will likely differ from the last La Niña event in 2022-23. It is important to note that NIWA’s criteria for reaching La Niña does not solely rely on oceanic indices crossing threshold values.
The Southern Annular Mode (SAM) dipped to its lowest August value in 35 years or since 1989, linked to a minor Sudden Stratospheric Warming (SSW) event during July and led to a rapid stratosphere-troposphere high pressure coupling over the pole. As of the end of August, the high pressure anomaly continued to be present and was driving an abnormally strong and large area of low pressure in the Southern Ocean to the south of Australia and New Zealand, with this feature set to continue into September. Sub-seasonal guidance indicates an easing of this anomaly by October.
The Indian Ocean Dipole (IOD) was trending toward positive values at the end of August, reaching +0.57. Typically, positive IOD phases are associated with El Niño events – not developing a La Niña. Should the IOD continue to trend positive, it could reduce the level of moisture available for Australia and potentially parts of New Zealand during the spring season.
During August, convective forcing favoured Africa and the Indian Ocean, forced by an unusually active African monsoon. In September, the Madden-Julian Oscillation (MJO) is forecast to be active over the Maritime Continent (phases 4 and 5) to start the month before progressing eastward (phases 6 and 7). Another pulse may develop over Africa and the Indian Ocean (phases 2 and 3) around the same time, contributing to a variable tropical forcing pattern. For New Zealand, phases 4 and 5 historically favour above average temperatures in September, which looks likely in early September, while phases 6 and 7 historically favour near or below average temperatures, which looks likely in the second week of the month. The same phases tend to be wetter than normal in the western and inland South Island and drier than normal in the east of both islands. If a competing area of tropical forcing was to develop in the Indian Ocean, phases 2 and 3 favour above average temperatures, particularly in the east, as well as below normal rainfall in the north and east. In October, the MJO is forecast to track eastward, potentially favouring the Atlantic, Africa, and the Indian Ocean. This tends to favour more westerly-quarter winds (phases 1-3) and may also favour more high pressure in the New Zealand region.
Climate-sensitive sectors are encouraged to make use of the New Zealand drought dashboard, which provides 35-day outlooks of rainfall and drought, updated once daily: https://niwa.co.nz/weather-forecasting/seasonal-climate-outlook
SSTs in New Zealand’s coastal waters were slightly above average during August, with anomaly values increasing by 0.08˚C to 0.24˚C during the month. Model guidance suggests that increasing SST anomalies are likely in the New Zealand region over the spring season with the potential for marine heatwave conditions developing by November. For more info, see the NIWA Sea Surface Temperature Update.
NZ 30-day coastal SST anomalies (to 28 August)
| North NI | +0.45˚C |
| West NI | +0.64˚C |
| East NI | +0.47˚C |
| North SI | +0.55˚C |
| West SI | +0.49˚C |
| East SI | +0.50˚C |
Forecast Confidence

Forecast confidence for temperatures is medium-high. With sea surface temperatures now running slightly above average and wind flows not expected to favour the southerly quarter from September-November, a cooler than average three-month period is very unlikely. The combined effect of air masses from Australia and more high pressure from mid-to-late spring increases the odds for above average temperatures in several regions.
Rainfall

Forecast confidence for rainfall is medium. A Sudden Stratospheric Warming (SSW) event in July-August modified jet stream and pressure patterns across the Southern Hemisphere. These modifications have seemingly increased the level of sub-seasonal predictability, favouring westerly-quarter winds near New Zealand to start spring. As the effect of the SSW likely wanes in mid spring, a potential developing La Niña may lead to more high pressure around New Zealand, which may lead to a broad reduction in rainfall.
