Outlook Summary
- ENSO-neutral (El Niño – Southern Oscillation) conditions remain present in the tropical Pacific.
- In June 2025, atmospheric patterns in the Pacific continued to be intermittently consistent with weak La Niña conditions. In contrast, ocean temperatures shifted away from previous La Niña-like characteristics.
- A consensus of international guidance indicates about a 70% chance for the tropical Pacific to remain in an ENSO-neutral state over the outlook period. Chances for La Niña conditions to re-emerge by the end of the calendar year have diminished.
- For New Zealand, lower than normal atmospheric pressure is expected northwest of the country. There is a high likelihood for tropical and sub-tropical influences and low pressure systems to affect the country over the three-month period, leading to potentially significant rainfall and flooding events.
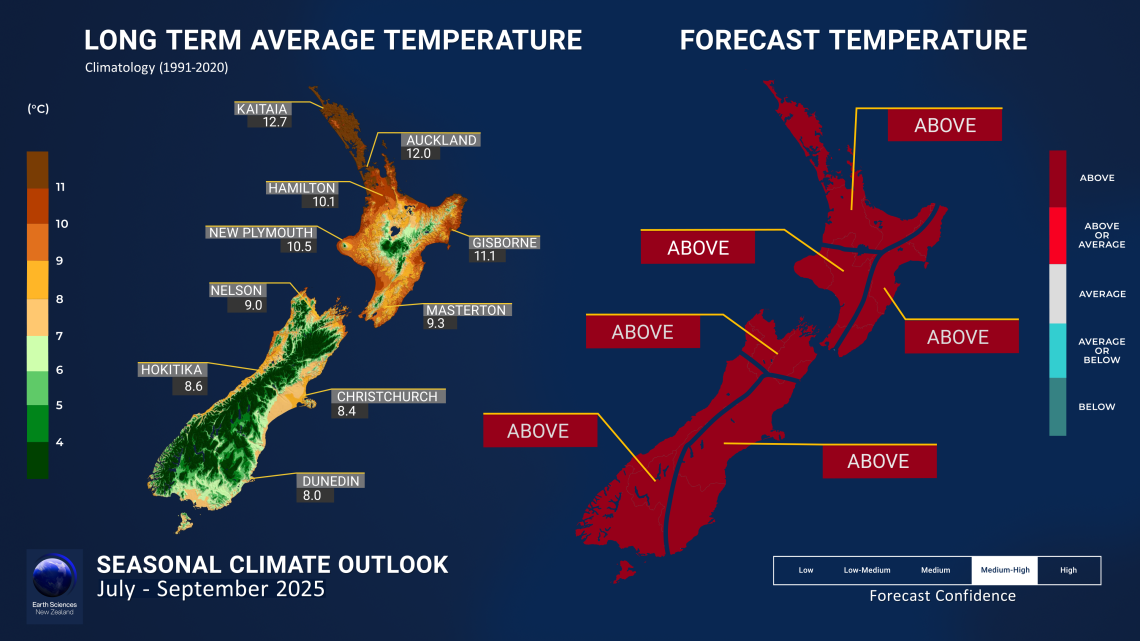
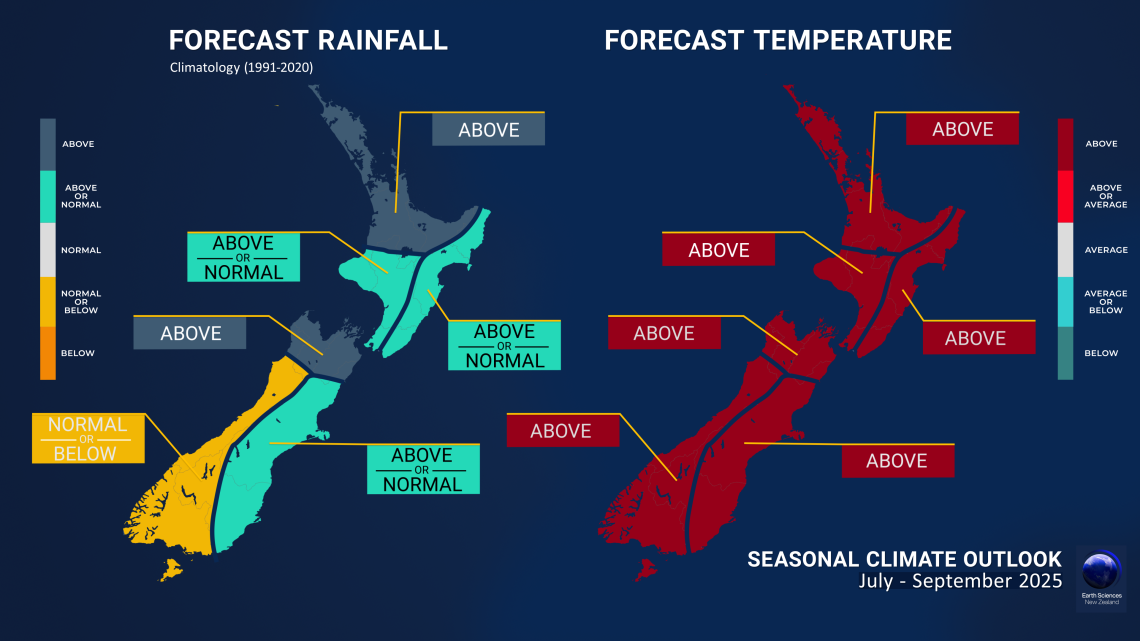
- Seasonal air temperatures are expected to be above average across all regions of New Zealand for the three-month period. Thus, while cold snaps and frost will occur, they are expected to be less frequent than usual.
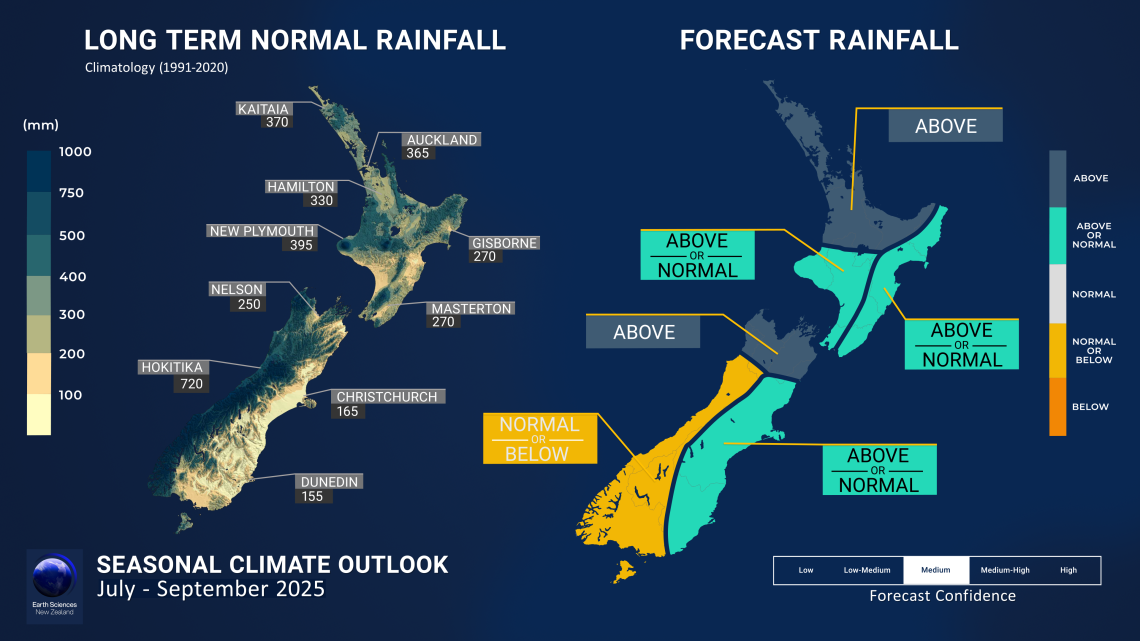
- July – September rainfall totals are expected to be above normal for the north of the North Island and the north of the South Island. Near normal or below normal rainfall is forecast for the west of the South Island. For all remaining regions of New Zealand, near normal or above normal rainfall totals are about equally likely. Chances for heavy rainfall events are considered elevated during the three-month period, potentially leading to flooding, particularly in areas with saturated soils. Sub-seasonal, or monthly, projections of rainfall and dryness are updated daily through the NIWA35 forecast.
- During July – September 2025, near normal or above normal soil moisture levels are expected for all regions of New Zealand, except for the North of the South Island, where above normal soil moisture levels are most likely. River flows are forecast to be near normal in the north and west of the North Island and the west of the South Island, while above normal river flows are expected in the north of the South Island. In the eastern regions of both islands, near normal or above normal river flows are equally likely.
- Sea surface temperatures (SSTs) remain above average mostly off the west coasts of both the North and South Islands. These areas continue to experience Marine Heatwave (MHW) conditions—defined as five or more consecutive days with SSTs above the 90th percentile. In contrast, ocean waters off the east coasts of the North and South Islands have cooled compared to previous months and in some areas are slightly below average. Coastal SST anomalies for the month of June (estimated using data to 29 June) ranged from +0.25°C to +1.04°C. Forecasts for July–September 2025 indicate that above-average SSTs are likely to persist around New Zealand, although the intensity of these anomalies is expected to lessen. Monitor the SST update for updates.
Regional predictions for July – September 2025
The tables below show the probabilities (or percent chances) for each of three categories: above average, near average, and below average. In the absence of any forecast guidance there would be an equal likelihood (33% chance) of the outcome for any of the three categories. Forecast information from local and global guidance models is used to indicate the deviation from equal chance that is expected for the coming three-month period. All outlooks are for the three months averaged as a whole. During these three months, there will inevitably be relatively wet and dry periods, as well as hot and cold periods. The exact range in temperature and rainfall within each of the three categories varies with location and season. However, as a guide, the “near average” or middle category for the temperature predictions includes deviations up to ±0.5°C relative to the long-term mean, whereas for rainfall the “near normal” category lies between 80 percent and 120 percent of the long-term (1991-2020) mean.
Northland, Auckland, Waikato, Bay of Plenty
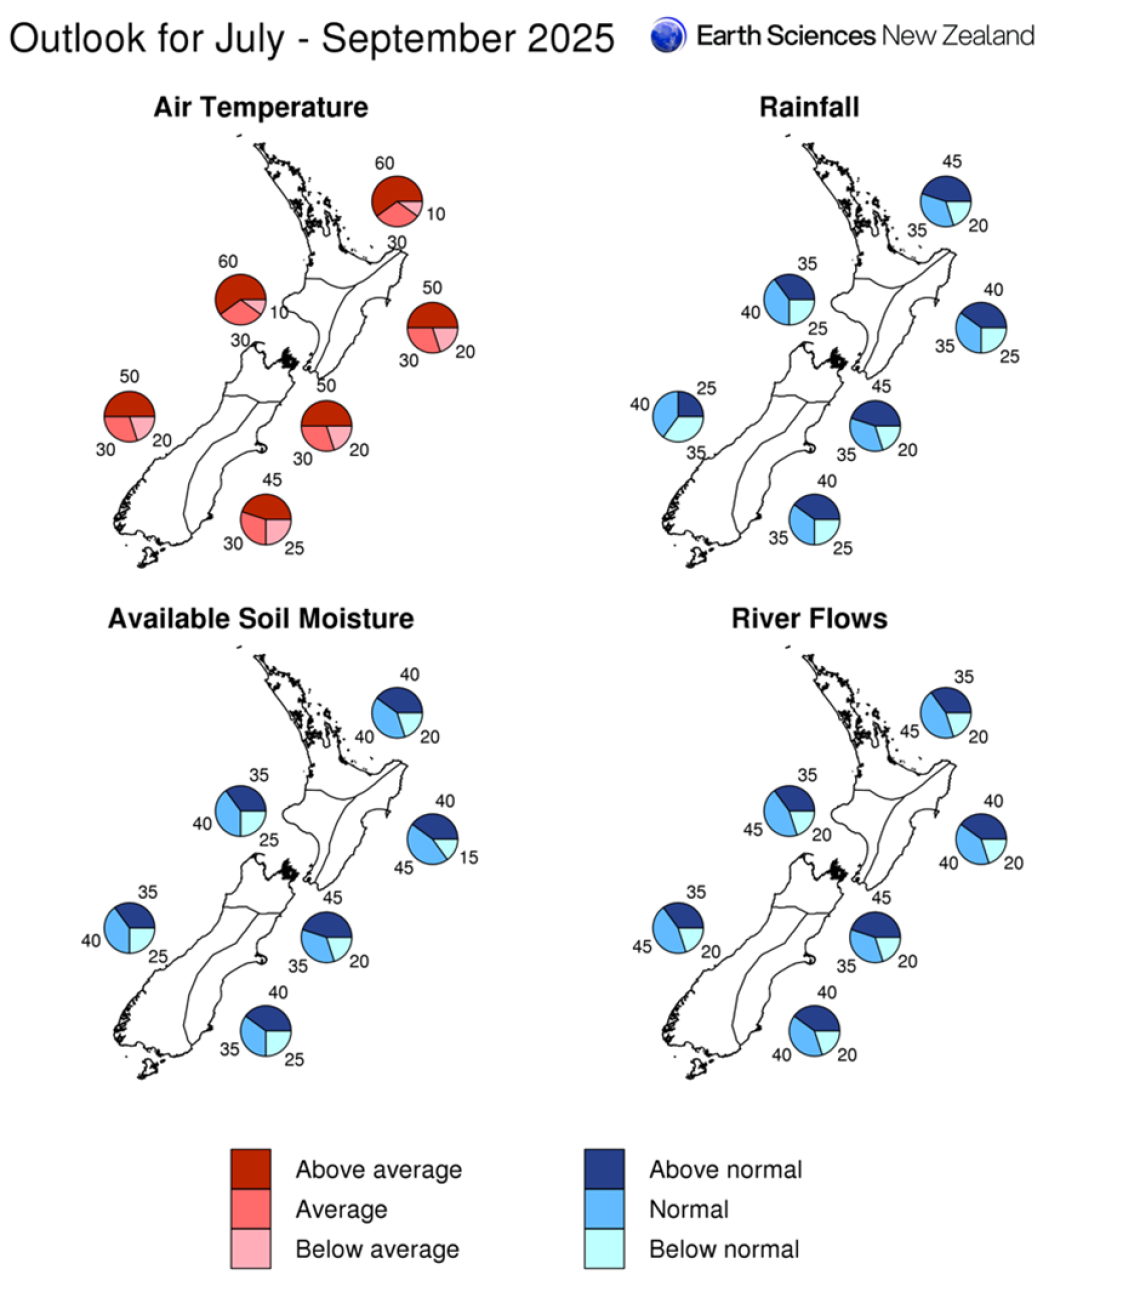
- Temperatures are very likely to be above average (60% chance).
- Rainfall totals are most likely to be above normal (45% chance) for July – September 2025 as a whole, with heavy rain events expected at times leading to increased chances of flooding.
- Soil moisture levels are equally likely to be near normal (40% chance) or above normal (40% chance), while river flows are most likely (45% chance) to be near normal.
| Temperature | Rainfall | Soil moisture | River flows | |
| Above average | 60 | 45 | 40 | 35 |
| Near average | 30 | 35 | 40 | 45 |
| Below average | 10 | 20 | 20 | 20 |
Central North Island, Taranaki, Whanganui, Manawatu, Wellington
Probabilities are assigned in three categories: above average, near average, and below average.
- Temperatures are very likely to be above average (60% chance).
- Rainfall totals are about equally likely to be near normal (40% chance) or above normal (35% chance) as a whole, with heavy rain events expected at times leading to increased chances of flooding.
- Soil moisture levels are about equally likely to be near normal (40% chance) or above normal (35% chance).
- River flows are most likely (45% chance) to be near normal.
| Temperature | Rainfall | Soil moisture | River flows | |
| Above average | 60 | 35 | 35 | 35 |
| Near average | 30 | 40 | 40 | 45 |
| Below average | 10 | 25 | 25 | 20 |
Gisborne, Hawke’s Bay, Wairarapa
Probabilities are assigned in three categories: above average, near average, and below average.
- Temperatures are most likely to be above average (50% chance).
- Rainfall totals are about equally likely to be above normal (40% chance) or near normal (35% chance).
- Soil moisture levels and river flows are about equally likely to be near normal (40-45% chance) or above normal (40% chance).
| Temperature | Rainfall | Soil moisture | River flows | |
| Above average | 50 | 40 | 40 | 40 |
| Near average | 30 | 35 | 45 | 40 |
| Below average | 20 | 25 | 15 | 20 |
Tasman, Nelson, Marlborough, Buller
Probabilities are assigned in three categories: above average, near average, and below average.
- Temperatures are most likely to be above average (50% chance).
- Rainfall totals are most likely to be above normal (45% chance), with significant rainfall events expected at times and increased chances of flooding.
- Soil moisture levels and river flows are most likely to be above normal (45% chance).
| Temperature | Rainfall | Soil moisture | River flows | |
| Above average | 50 | 45 | 45 | 45 |
| Near average | 30 | 35 | 35 | 35 |
| Below average | 20 | 20 | 20 | 20 |
West Coast, Southern Alps and foothills, inland Otago, Southland
Probabilities are assigned in three categories: above average, near average, and below average.
- Temperatures are most likely to be above average (50% chance).
- Rainfall totals are about equally likely to be near normal (40% chance) or below normal (35% chance).
- Soil moisture levels are about equally likely to be near normal (40% chance) or above normal (35% chance), while river flows are most likely (45% chance) to be near normal.
| Temperature | Rainfall | Soil moisture | River flows | |
| Above average | 50 | 25 | 35 | 35 |
| Near average | 30 | 40 | 40 | 45 |
| Below average | 20 | 35 | 25 | 20 |
Coastal Canterbury and the nearby plains, east Otago
Probabilities are assigned in three categories: above average, near average, and below average.
- Temperatures are most likely to be above average (45% chance).
- Rainfall totals are about equally likely to be above normal (40% chance) or near normal (35% chance).
- Soil moisture levels and river flows are about equally likely to be near normal (35-40% chance) or above normal (40% chance).
The full probability breakdown is:
| Temperature | Rainfall | Soil moisture | River flows | |
| Above average | 45 | 40 | 40 | 40 |
| Near average | 30 | 35 | 35 | 40 |
| Below average | 25 | 25 | 25 | 20 |
Background
Sea surface temperature (SSTs) anomalies in the central equatorial Pacific (Niño 3.4 Index) in June (estimated using data from <n days> to 29 June) are in the ENSO-neutral range and very close to climatological values (+0.06˚C). SSTs are generally warmer than normal all along the equator in the Pacific, and only isolated pockets of cooler than normal water temperatures remain in parts of the central-eastern Pacific. On the other hand, warmer than normal ocean waters emerged in the far eastern equatorial Pacific, especially when considered in relative terms (i.e. compared to the average SSTs in the global tropics). The relative Niño 3.4 Index* (RONI) has warmed significantly over the past two weeks, and its latest 30 day value (to 29 June) is -0.24˚C, in the neutral range.
As of 26 June 2025, the preliminary Southern Oscillation Index (SOI) value for June is +0.7, indicating conditions on the La Niña side of neutral. The SOI has been consistently on the La Niña side of neutral since April 2025; accordingly, atmospheric patterns were and continue to be intermittently consistent with weak La Niña conditions.
During June 2025, upper-oceanic heat content anomalies (temperature anomalies in the upper 300 metres of the ocean) have become less warm in the western Pacific, and warmer than normal subsurface ocean waters have spread eastward. Currently, positive heat content anomalies are present along the equator throughout much of the Pacific basin. It constitutes a clear departure from the anomaly patterns that were present in the previous months.
This significant change in ocean heat content anomalies is also reflected in the subsurface temperature anomalies, which are now positive (anomalies of +1oC to +2oC) from the Western Pacific Warm Pool (WPWP) to about 120oW between about 100 - 150 metres depth. Above average subsurface temperature anomalies now prevail across the western and central equatorial Pacific Ocean.
In summary, oceanic conditions have clearly shifted away from the weak La Niña-like pattern that persisted through April 2025. This transition is supported by the recent decline in heat content anomalies in the Western Pacific Warm Pool and the widespread warming of both surface and subsurface waters across the central and equatorial Pacific.
For the New Zealand region, a significant signal that emerged in the global climate models’ forecasts is the possibility for enhanced low-level convergence in the western Pacific and areas north of the country. This could draw tropical and subtropical air masses into our region, increasing the likelihood of wetter-than-normal conditions over the next three months. There is therefore an elevated risk for heavy rainfall events, including those associated with landfalling atmospheric rivers.
Based on the dynamical and statistical models monitored by Earth Sciences New Zealand, ENSO-neutral conditions remain the most likely outcome (71% chance) over the next three-month period (July – September 2025). ENSO-neutral conditions are expected to persist for the remainder of the calendar year. Compared to last month, international guidance indicates a decreased probability for La Niña conditions to re-emerge before the end of the calendar year.
The Southern Annular Mode (SAM) alternated between positive and negative values during the month of June (with an about even split of 52% of days positive and 48% of days negative) and the monthly average index value (estimated using data to 29 June) was +0.06. Over the next two weeks, the SAM is forecast to become temporarily negative and then return to slightly positive values.
The Indian Ocean Dipole (IOD) is currently in the neutral range, with the average anomaly for the month of June 2025 (estimated using data to 29 June) being +0.05oC. The guidance from the Australian Bureau of Meteorology is for the IOD to become slightly negative over the next three-month period but generally remain in the neutral range.
At the start of June 2025, a moderate strength pulse of the Madden–Julian Oscillation (MJO) moved across the Western Pacific then weakened in the Western Hemisphere and Africa. The MJO signal had been indiscernible since about mid-June, but currently increased intra-seasonal convective activity associated with the MJO has emerged over the Maritime Continent (MJO phase 5). Increased MJO activity in the first two weeks of July might contribute to a temporary increase in trade-winds strength over the same period.
Sea Surface Temperatures (SSTs): SSTs remain above average mostly off the west coasts of both the North and South Islands. These areas continue to experience Marine Heatwave (MHW) conditions—defined as five or more consecutive days with SSTs above the 90th percentile. In contrast, waters off the east coasts of the North and South Islands have cooled compared to previous months and in some areas are slightly below average. Forecasts for July–September 2025 indicate that above-average SSTs are likely to persist around New Zealand, although the intensity of these warm anomalies is expected to lessen.
[1]The Relative Oceanic Niño 3.4 Index (RONI) is a modern way of measuring oceanic El Niño and La Niña that is complementary to oceanic traditional indices. While traditional oceanic indices like the Niño 3.4 Index monitor SSTs in one region, the RONI compares the average SST in the central equatorial Pacific with the average SST across the global tropics. Since tropical rainfall patterns respond to changes in ocean temperatures, this new relative index can help forecasters better determine if the equatorial Pacific is warmer or cooler than the rest of the global tropics, which has become more challenging to discern as seas warm because of climate change.
NZ 30-day coastal SST anomalies (to 29 June 2025):
| North NI | +0.62°C |
| West NI | +1.04°C |
| East NI | +0.25°C |
| North SI | +0.83°C |
| West SI | +0.69°C |
| East SI | +0.77°C |
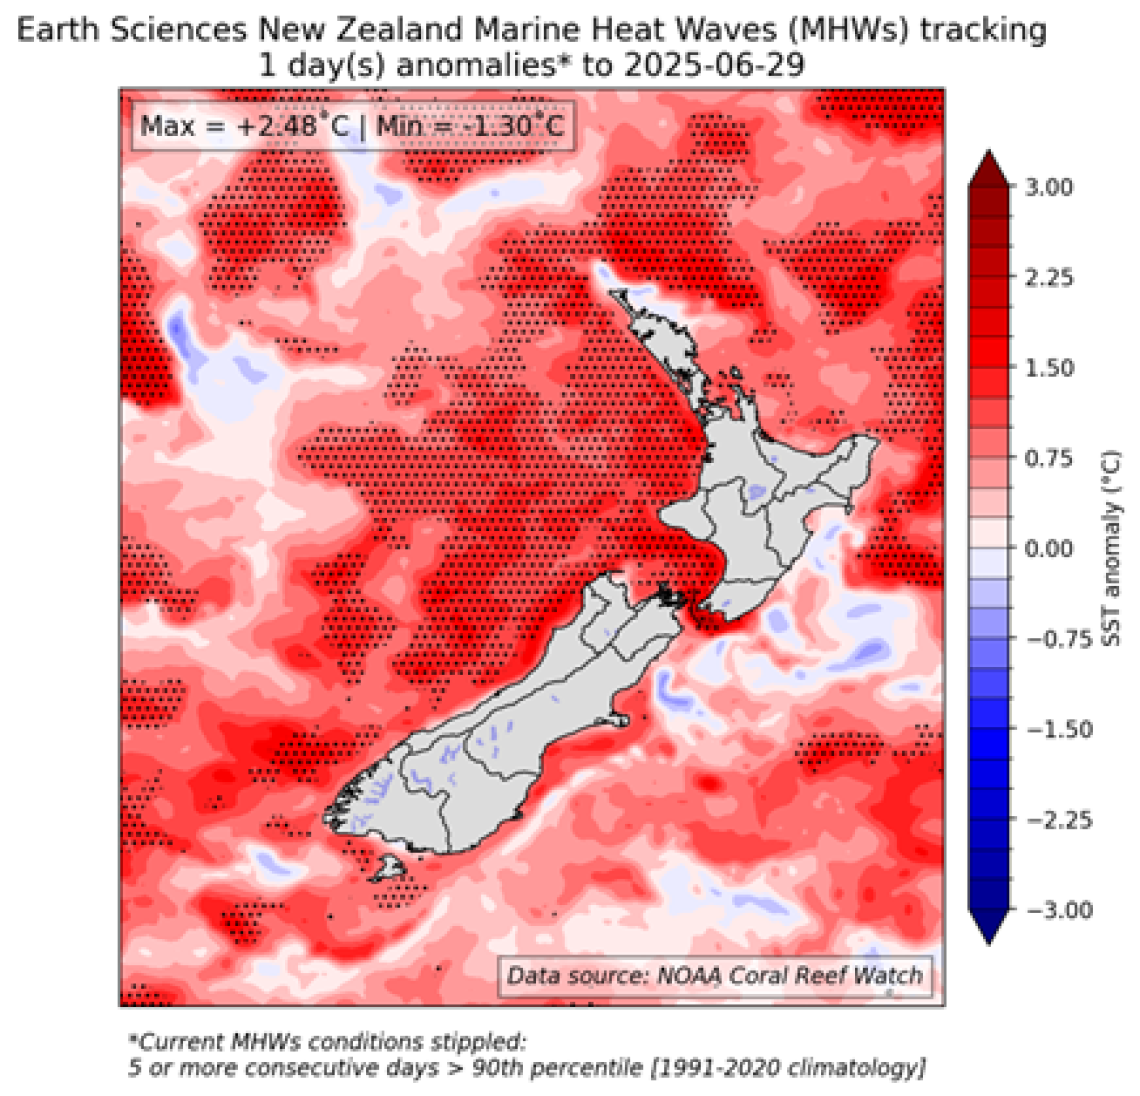
Figure 1: Daily SST anomalies and marine heatwave conditions (stippled), for the 29th of June 2025, calculated with respect to the 1991-2020 climatological period:
Forecast Confidence

Temperature
Forecast confidence for temperatures is Medium-High. The General Circulation Models’ forecasts that are leveraged for the Seasonal Climate Outlook indicate warmer than normal temperatures are the most likely outcome for the next three months. Note however that warmer than normal ocean temperatures around New Zealand are expected to weaken over the same period.
Rainfall
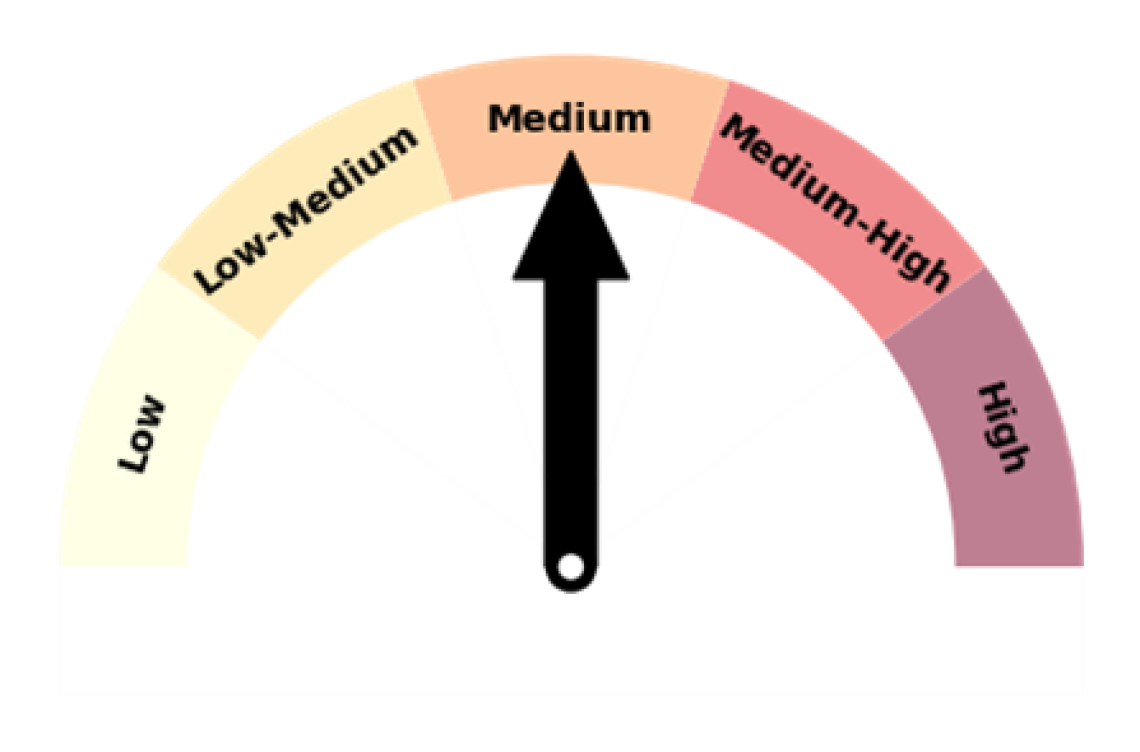
Forecast confidence for rainfall is Medium. The General Circulation Models indicate a tendency toward wetter-than-normal conditions, driven by increased low-level convergence north of the country and in the western Pacific. However, there remains uncertainty around the prevailing circulation patterns over the next three-month period.