Outlook summary
- La Niña-like atmospheric patterns continued during July and a La Niña Watch continues. Oceanic La Niña may develop during spring (60% chance).
- A unique climate driver in the stratosphere will have an impact on Southern Hemisphere weather patterns during August, leading to a strongly negative Southern Annular Mode (SAM) and disturbed polar vortex. This will contribute to a colder than average start to August in New Zealand.
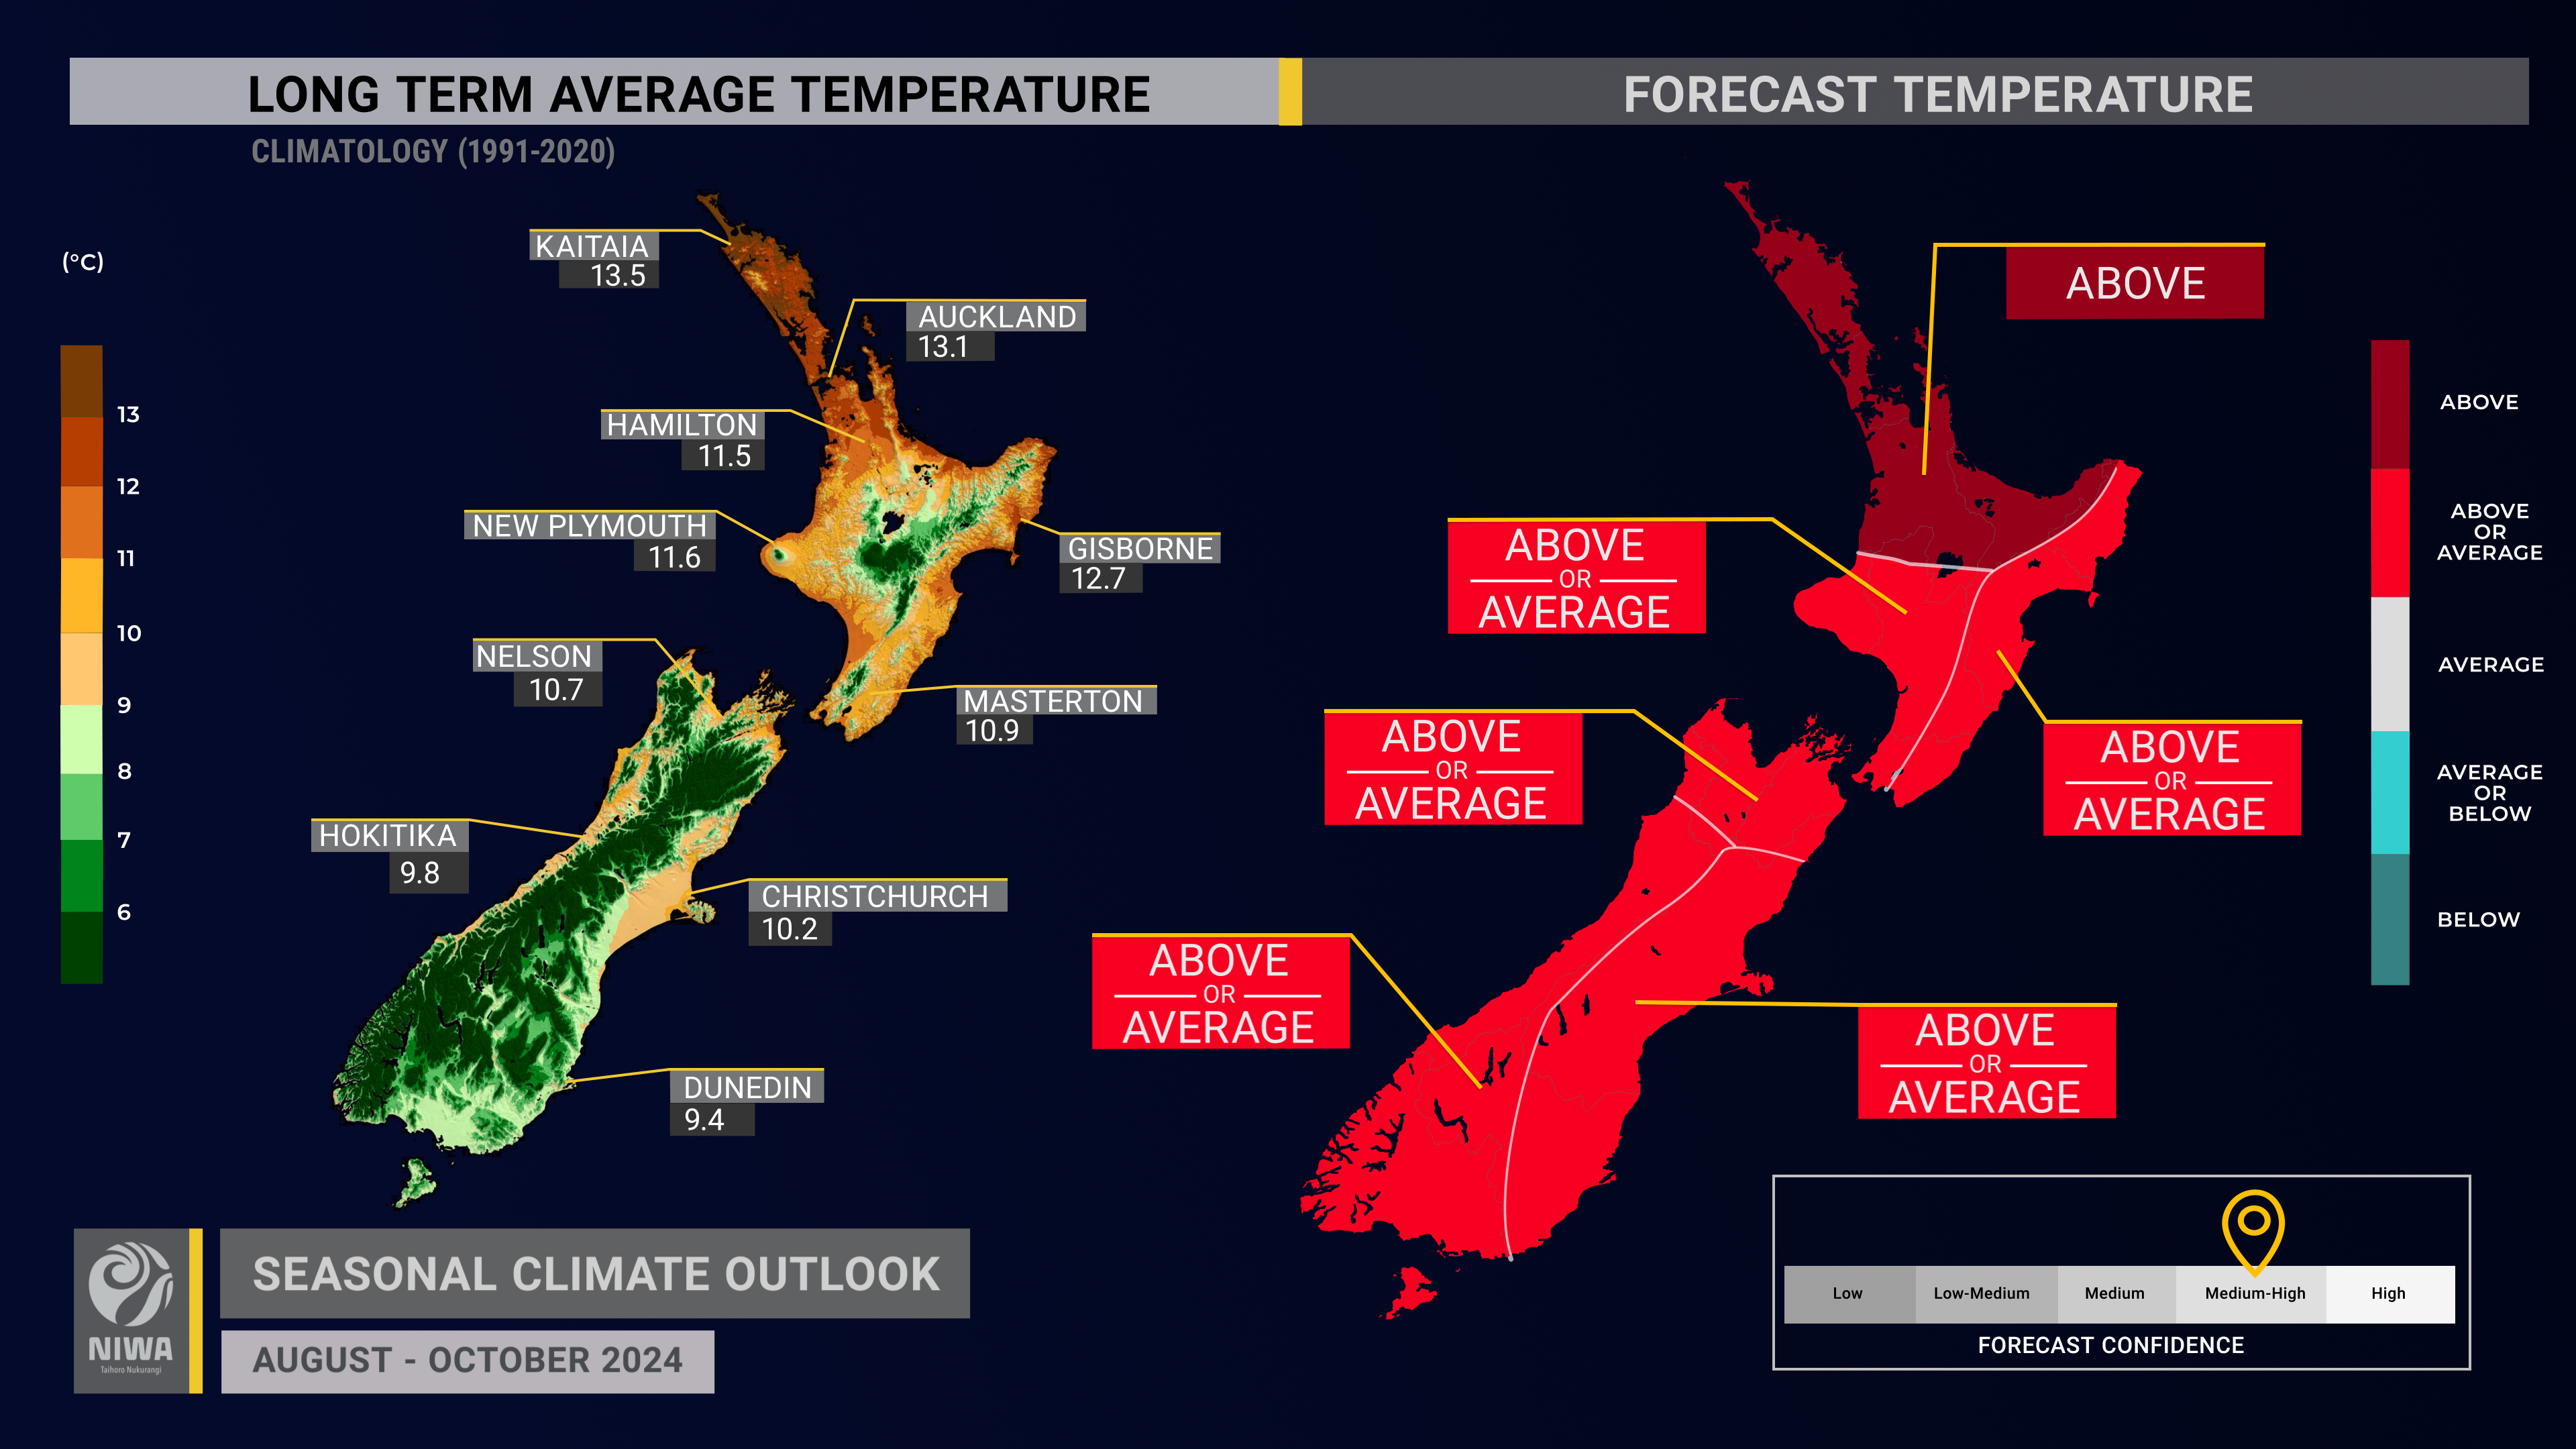
- For the August-October period as a whole, however, air temperatures are most likely to be above average in the north of the North Island and about equally likely to be near average or above average in all remaining regions. More northerly quarter air flows than normal are expected from mid-August, likely contributing to spells of unseasonable warmth.
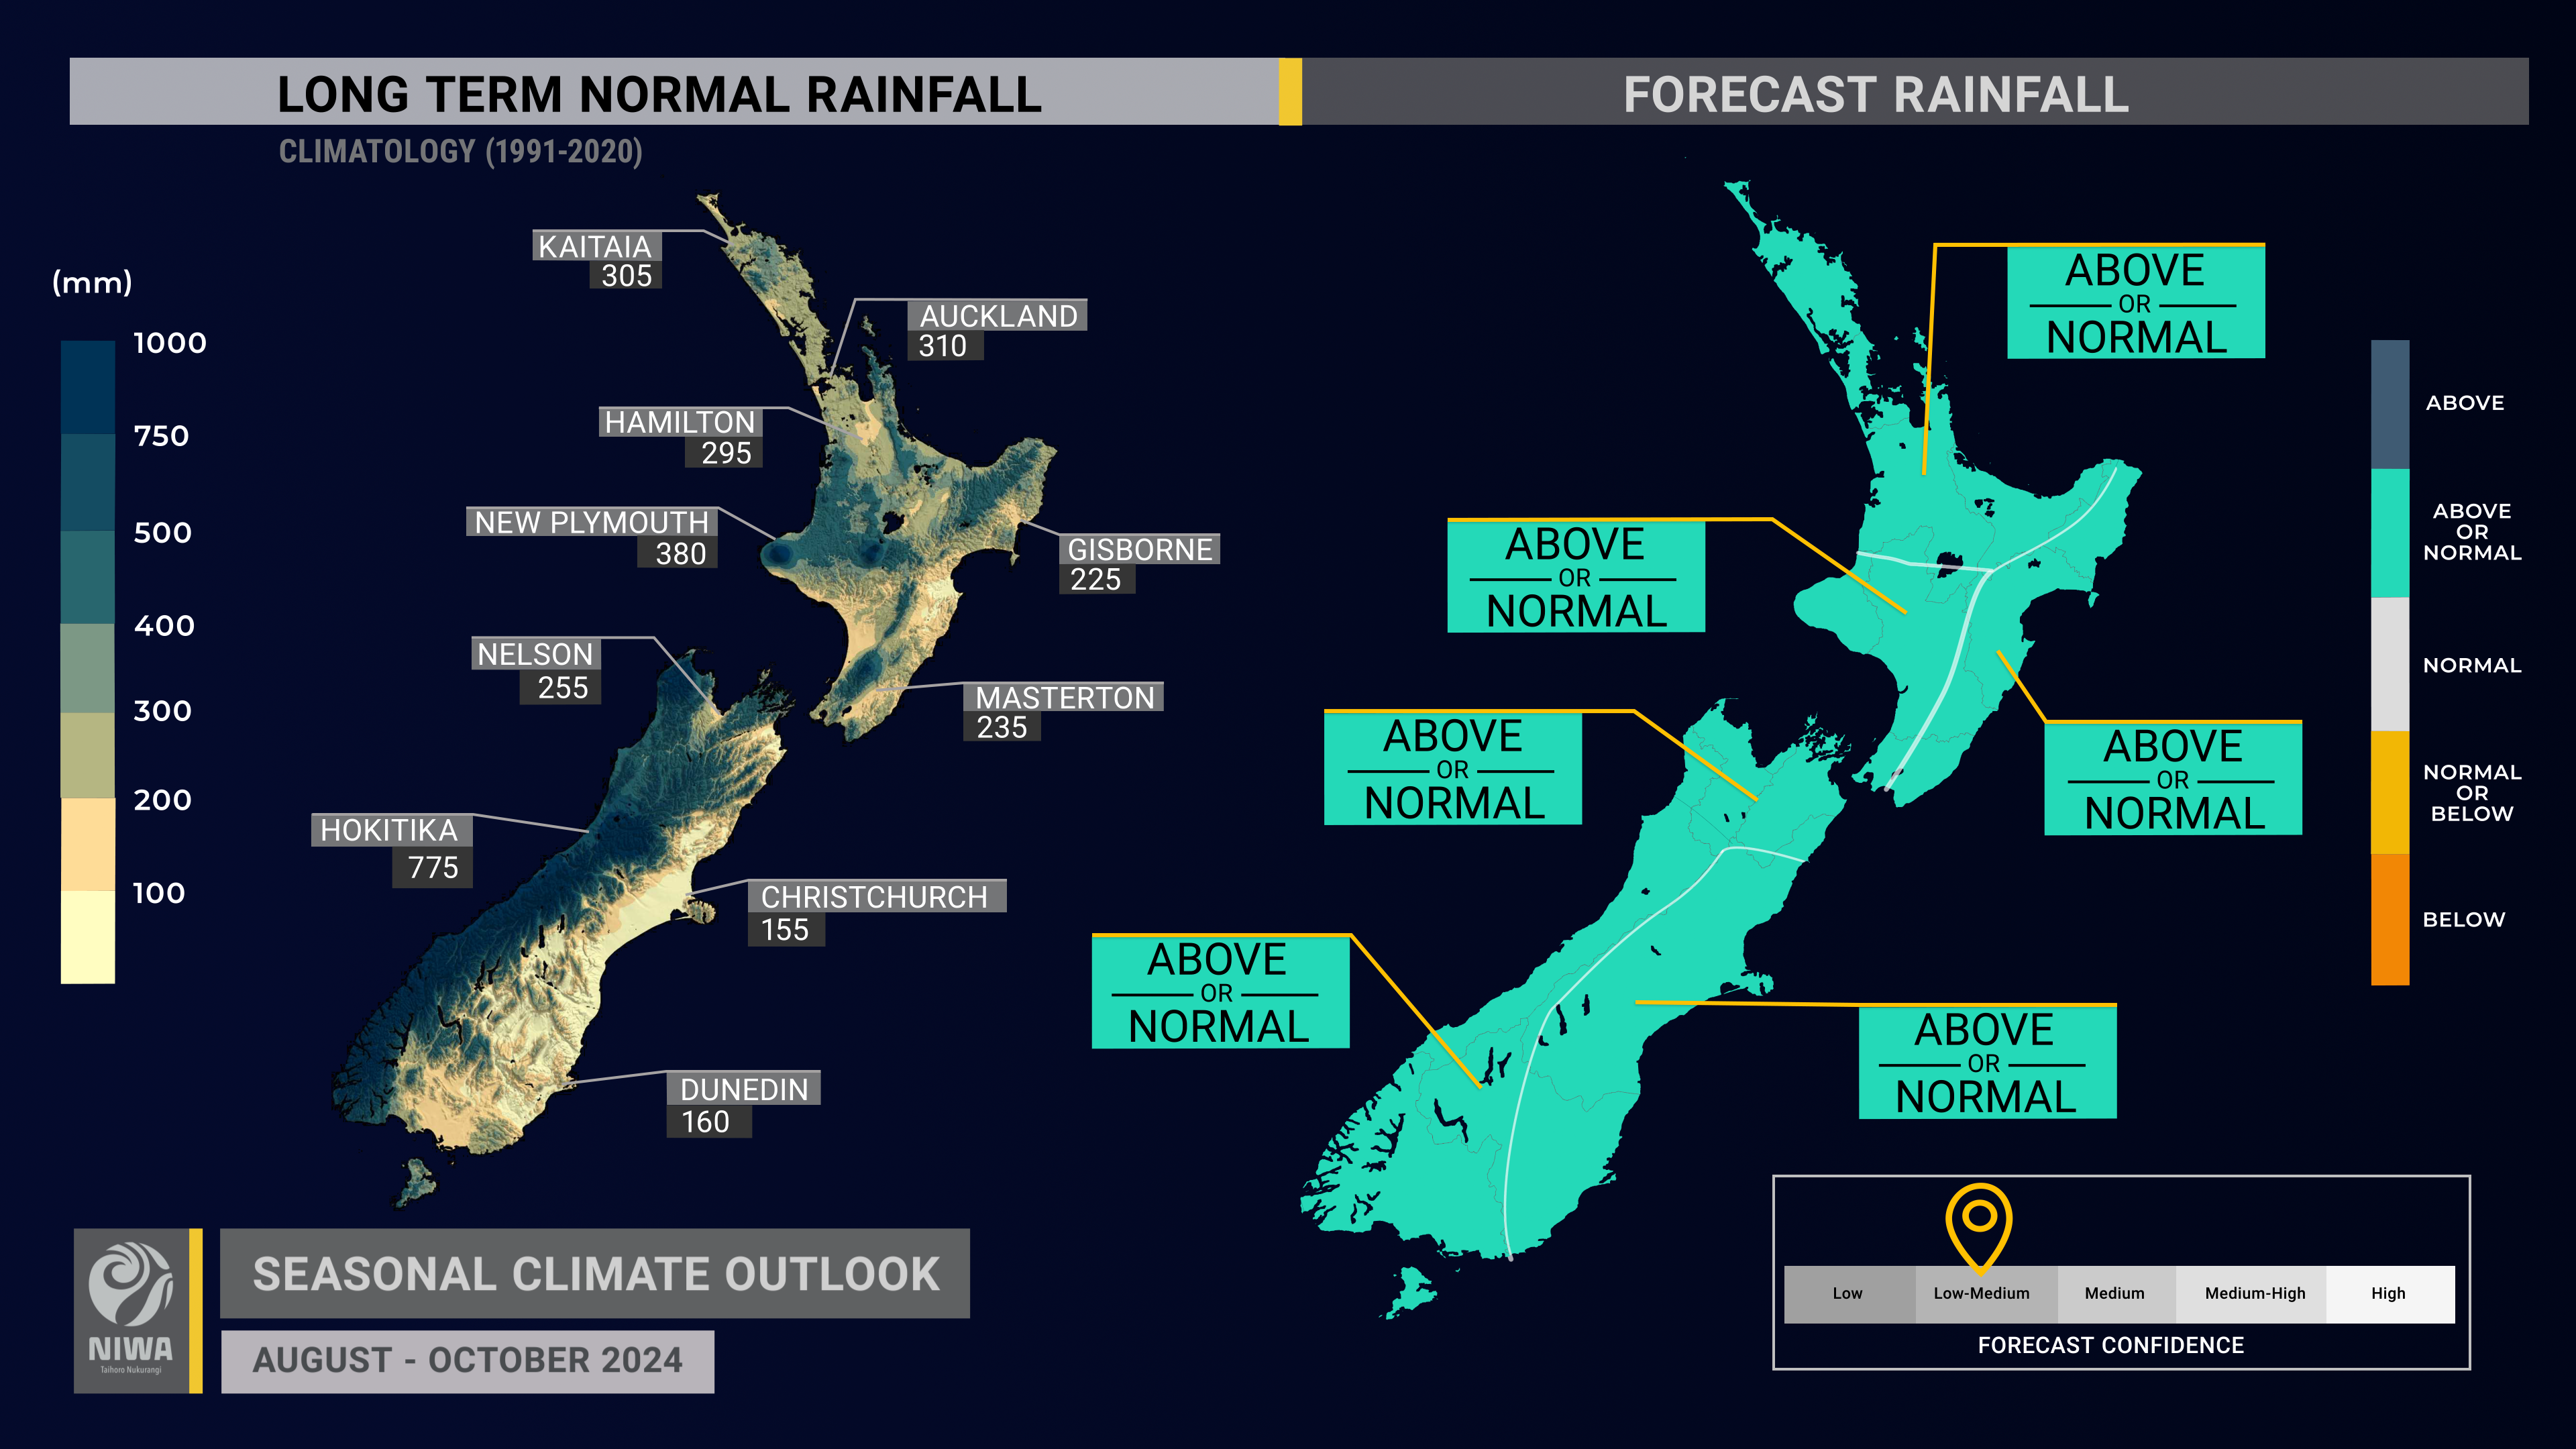
- Although the first half of August looks drier than normal in many regions, near normal or above normal rainfall is about equally likely for all regions of the country during August-October. An increase in rainfall is possible from mid-August. Monitor NIWA35 for updates.
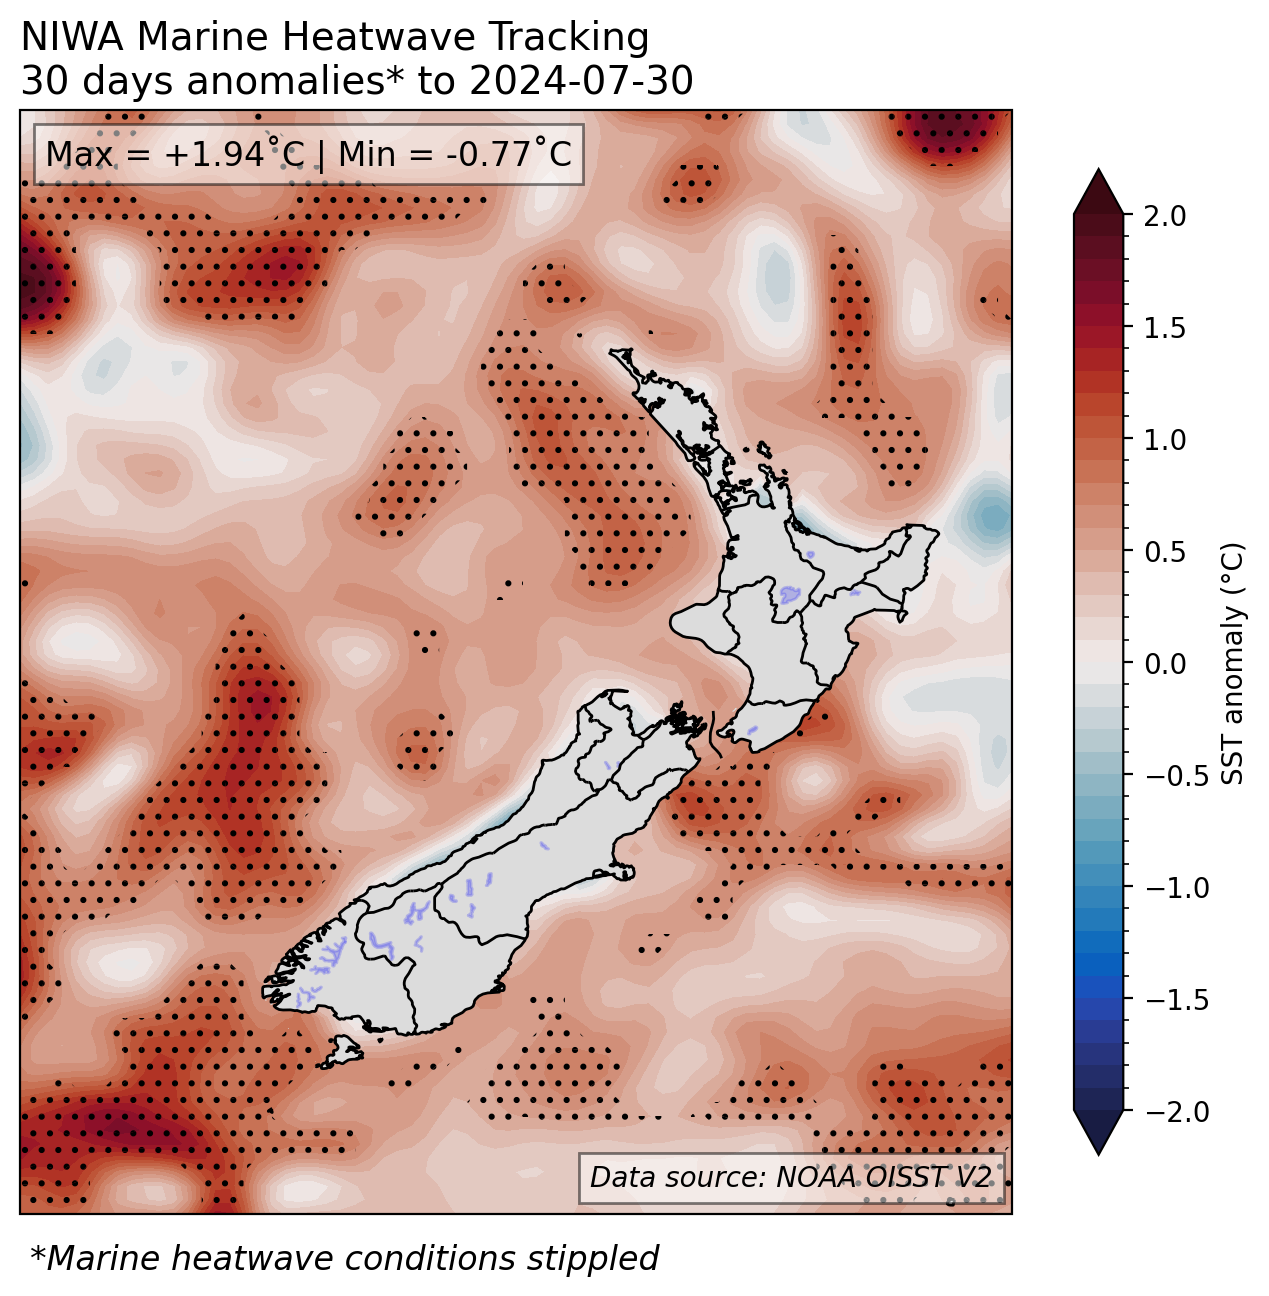
- Coastal sea surface temperatures (SSTs) ranged from 0.25˚C to 0.46˚C above average during July, an increase of 0.1˚C to 0.5˚C compared to June. Monitor the SST update for updates.
- Catchment-level river flows from May-July were below normal or well below normal in many parts of the country. Despite an expected increase in rainfall over this three-month period, flows will recover gradually. This will continue to affect water availability for some sectors, such as hydro scheme operators and for agricultural applications.
- Soil moisture levels are most likely to be near normal in the north and east of the North Island and west and east of the South Island and equally likely to be near normal or below normal in the west of the North Island and north of the South Island.
- River flows are most likely to be below normal in the north of the North Island, near normal in the west of both islands, and equally likely to be near normal or below normal in all remaining regions.
Regional predictions for August – October 2024
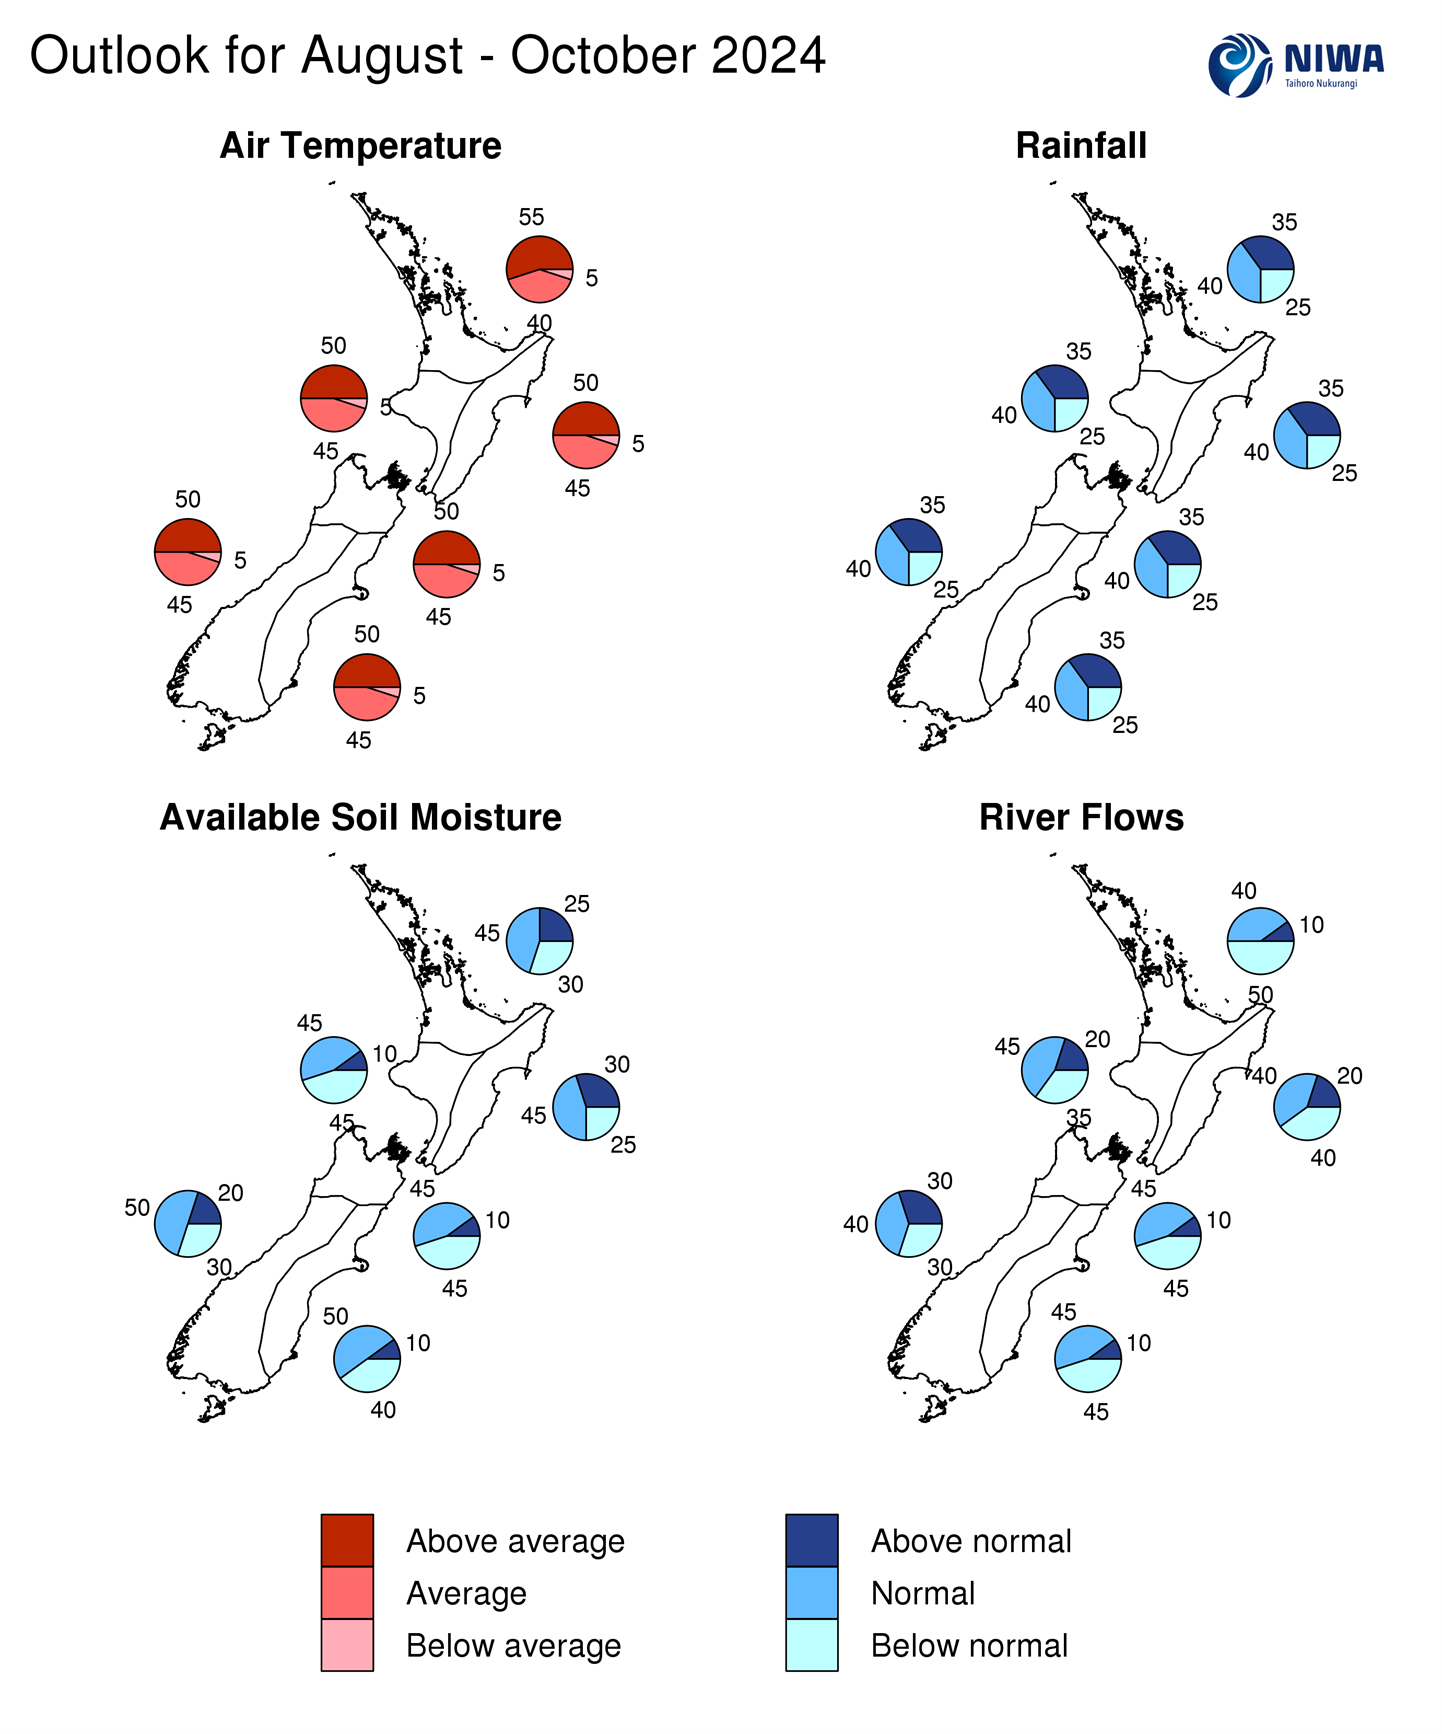
The tables below show the probabilities (or percent chances) for each of three categories: above average, near average, and below average. In the absence of any forecast guidance there would be an equal likelihood (33% chance) of the outcome for any of the three categories. Forecast information from local and global guidance models is used to indicate the deviation from equal chance that is expected for the coming three-month period. All outlooks are for the three months as a whole. There will inevitably be relatively wet and dry days, and hot and cold days, within a season. The exact range in temperature and rainfall within each of the three categories varies with location and season. However, as a guide, the “near average” or middle category for the temperature predictions includes deviations up to ±0.5°C for the long-term mean, whereas for rainfall the “near normal” category lies between 80 per cent and 120 per cent of the long-term (1991-2020) mean.
Northland, Auckland, Waikato, Bay of Plenty
- Temperatures are most likely to be above average (55% chance). However, a cold snap, along with possible frosts, is expected in early August.
- Rainfall totals are about equally likely to be near normal (40% chance) or above normal (35% chance). Periods of heavy rainfall will affect Northland in early August with a dry spell for the remainder of the region. A more unsettled pattern may develop in late August.
- Soil moisture levels are most likely to be near normal (45% chance) while river flows are most likely to be below normal (50% chance).
| Temperature | Rainfall | Soil moisture | River flows | |
| Above average | 55 | 35 | 25 | 10 |
| Near average | 40 | 40 | 45 | 40 |
| Below average | 05 | 25 | 30 | 50 |
Central North Island, Taranaki, Whanganui, Manawatu, Wellington
Probabilities are assigned in three categories: above average, near average, and below average.
- Temperatures are about equally likely to be above average (50% chance) or near average (45% chance). However, a cold snap, along with likely frosts, is expected in early August.
- Rainfall totals are about equally likely to be near normal (40% chance) or above normal (35% chance). The first half of August looks drier than normal, followed by a trend toward more unsettled conditions later in the month.
- Soil moisture levels are equally likely to be near normal or below normal (45% chance each) while river flows are most likely to be near normal (45% chance).
| Temperature | Rainfall | Soil moisture | River flows | |
| Above average | 50 | 35 | 10 | 20 |
| Near average | 45 | 40 | 45 | 45 |
| Below average | 05 | 25 | 45 | 35 |
Gisborne, Hawke’s Bay, Wairarapa
Probabilities are assigned in three categories: above average, near average, and below average.
- Temperatures are about equally likely to be above average (50% chance) or near average (45% chance). However, a cold snap, along with likely frosts, is expected in early August.
- Rainfall totals are about equally likely to be near normal (40% chance) or above normal (35% chance).
- Soil moisture levels are most likely to be near normal (45% chance) while river flows are equally likely to be near normal or below normal (40% chance each).
| Temperature | Rainfall | Soil moisture | River flows | |
| Above average | 50 | 35 | 30 | 20 |
| Near average | 45 | 40 | 45 | 40 |
| Below average | 05 | 25 | 25 | 40 |
Tasman, Nelson, Marlborough, Buller
Probabilities are assigned in three categories: above average, near average, and below average.
- Temperatures are about equally likely to be above average (50% chance) or near average (45% chance). However, a cold snap, along with likely frosts, is expected in early August.
- Rainfall totals are about equally likely to be near normal (40% chance) or above normal (35% chance). The first half of August looks drier than normal, followed by a trend toward more unsettled conditions later in the month.
- Soil moisture levels and river flows are equally likely to be near normal or below normal (45% chance each).
| Temperature | Rainfall | Soil moisture | River flows | |
| Above average | 50 | 35 | 10 | 10 |
| Near average | 45 | 40 | 45 | 45 |
| Below average | 05 | 25 | 45 | 45 |
West Coast, Southern Alps and foothills, inland Otago, Southland
Probabilities are assigned in three categories: above average, near average, and below average.
- Temperatures are about equally likely to be above average (50% chance) or near average (45% chance). However, a cold snap, along with likely frosts, is expected in early August.
- Rainfall totals are about equally likely to be near normal (40% chance) or above normal (35% chance). The first half of August looks drier than normal, followed by a trend toward more unsettled conditions later in the month.
- Soil moisture levels and river flows are most likely to be near normal (40-50% chance).
| Temperature | Rainfall | Soil moisture | River flows | |
| Above average | 50 | 35 | 20 | 30 |
| Near average | 45 | 40 | 50 | 40 |
| Below average | 05 | 25 | 30 | 30 |
Coastal Canterbury and the nearby plains, east Otago
Probabilities are assigned in three categories: above average, near average, and below average.
- Temperatures are about equally likely to be above average (50% chance) or near average (45% chance). However, a cold snap, along with likely frosts, is expected in early August.
- Rainfall totals are about equally likely to be near normal (40% chance) or above normal (35% chance).
- Soil moisture levels are most likely to be near normal (50% chance) while river flows are equally likely to be near normal or below normal (45% chance each).
The full probability breakdown is:
| Temperature | Rainfall | Soil moisture | River flows | |
| Above average | 50 | 35 | 10 | 10 |
| Near average | 45 | 40 | 50 | 45 |
| Below average | 05 | 25 | 40 | 45 |
Graphical representation of the regional probabilities
Background
Sea surface temperatures (SSTs) remained in the neutral range in the central equatorial Pacific (Niño 3.4 Index) during July (+0.20˚C). A strong trade wind surge at the end of the month saw the daily Niño 3.4 value drop to -0.34˚C, the lowest since early March 2023. As of 30 July, the 30-day relative Niño 3.4 Index was -0.42˚C, reflective of the central equatorial Pacific being cooler than the average of the global tropics.
The Southern Oscillation Index (SOI) was on the El Niño side of neutral during July (-0.7) and neutral from May-July (+0.1). Recent variability is characteristic of an ENSO neutral ocean-atmosphere system.
However, other atmospheric patterns lean more toward La Niña, such as above normal trade wind speeds, tropical convection/thunderstorm patterns, and weather regimes around New Zealand. For these reasons, a La Niña Watch continues.
Overall, ENSO neutral conditions are favoured to continue through August. Oceanic La Niña may develop during spring (60% chance). A surge of westerly winds during August may halt or temporarily reverse the La Niña-like trend in the ocean-atmosphere system. This will likely push out the potential development of La Niña to mid or late spring. Traditional oceanic indicators for monitoring ENSO are being considered alongside the new, relative Niño 3.4 Index which shows a more advanced state of La Niña development. It is possible that this event will fail to reach traditional La Niña thresholds but the relative index will reach the threshold.
Trade wind strengthwas generally above normal in the eastern and central equatorial Pacific during July. A significant trade wind surge during the last week of the month saw the Niño 3.4 Index drop to its most unusually cool value since February 2023. However, a significant surge in westerly winds is likely during the first half of August – this will likely halt and potentially reverse the cooling trend.
During July, upper-oceanic heat content was 0.5˚C to 1.5˚C below average in the eastern and central equatorial Pacific. Compared to June, conditions trended cooler in the central and slightly warmer in the east. These conditions suggest the ocean system is leaning toward La Niña.
The subsurface equatorial Pacific was 3˚C to 5˚C cooler than average between 50m and 100m depth in the central and east. The West Pacific Warm Pool continued to recharge and was 0.5 to 1.5˚C warmer than average at the end of July.
The Southern Annular Mode (SAM) was variable during the first half of July before going sharply negative during the second half. A minor sudden stratospheric warming event during the middle part of the month contributed to a stratosphere-troposphere coupling that favoured the development of higher than normal air pressure over Antarctica. This led to the most negative value of the Southern Annular Mode during the month of July since 2011. This unusual climate driver is expected to continue to play an important role right across the Southern Hemisphere during August. This will involve high pressure zones consistently extending into the Southern Ocean and toward the South Island, particularly in the first half of the month.
During July, convective forcing favoured the eastern Indian Ocean, Maritime Continent, and western Pacific, as forced by a developing La Niña-like state and a pulse of the MJO.
During August, the MJO is forecast to propagate from the eastern Pacific, into the Americas, the Atlantic, and then Africa and the western Indian Ocean (phases 8-1-2), a sequence that may destructively interfere with the developing La Niña-like state. Historically, these phases have favoured more southerly quarter winds than normal across the country, near-to-below average temperatures, and reduced rainfall in the north and west.
In September, the MJO is forecast to continue to track eastward, potentially reaching the Maritime Continent and western Pacific. This would favour the development of more westerly and northerly quarter air flows and wetter than normal conditions in the north and west of both islands.
Climate-sensitive sectors are encouraged to make use of the New Zealand drought dashboard, which provides 35-day outlooks of rainfall and drought, updated once daily: https://niwa.co.nz/weather-forecasting/seasonal-climate-outlook
SSTs in New Zealand’s coastal waters were slightly above average during July, with anomaly values increasing by 0.1˚C to 0.5˚C during the month. Seas are favoured to display a gradual warming trend in the months ahead and some guidance suggests marine heatwave conditions may form late in the year. For more info, see the NIWA Sea Surface Temperature Update.
NZ 30-day coastal SST anomalies (to 30 July)
| North NI | +0.25˚C |
| West NI | +0.46˚C |
| East NI | +0.39˚C |
| North SI | +0.36˚C |
| West SI | +0.27˚C |
| East SI | +0.39˚C |
Forecast confidence
Temperature

Forecast confidence for temperatures is medium-high. With sea surface temperatures now running slightly above average and wind flows not expected to favour the southerly quarter in September-October, a cooler than average three-month period is very unlikely. La Niña-like patterns may influence more northerly quarter winds later in the period.
Rainfall

Forecast confidence for rainfall is low-medium. Several climate drivers are expected to battle for dominance over this three-month period, such as high latitude blocking, a negative Southern Annular Mode, and ENSO neutral and/or La Niña-like patterns. Despite this, the models are quite confident that below normal rainfall is unlikely in all regions of the country. Note: climate model guidance generally has lower skill during ENSO neutral periods.