Outlook Summary
- ENSO-neutral (El Niño – Southern Oscillation) conditions remain present in the tropical Pacific, but a La Niña Watch is in effect.
- Negative sea surface temperature (SSTs) anomalies (cooler than average ocean waters) strengthened in the central and eastern equatorial Pacific in September 2025.
- Subsurface ocean temperatures also became increasingly La Niña-like, characterised by cooler-than-average waters in the eastern Pacific and warmer-than-average waters in the western Pacific.
- International guidance suggests La Niña conditions are likely (about a 60% chance) to become established before the end of the calendar year. This is further supported by forecasts developed by Earth Sciences New Zealand for the Relative Oceanic Niño Index (RONI), which accounts for the broader warming trend across the tropical Pacific. These forecasts suggest a high probability (about 85%) of La Niña conditions prevailing during the October–December 2025 period.
- A minor Sudden Stratospheric Warming (SSW) event developed over the South Pole in September 2025, near the top of the atmosphere. The impacts of this SSW will propagate downwards towards the troposphere (the part of the atmosphere where our weather occurs) over the next month. Possible impacts include changing the normal strength and position of the jet stream, storm tracks, and surface pressure patterns, resulting in wetter conditions over parts of New Zealand. The effects of this SSW are expected to be most pronounced during October, influencing short-term atmospheric circulation and weather patterns.
- For New Zealand, the combined influences of the recent SSW and developing La Niña are expected to drive notable circulation changes over October–December 2025. October is likely to begin on a relatively active note, with increased chances of rainfall and storm activity. As the month, and in particular the season progresses, a shift toward more anticyclonic conditions, or settled weather, occasionally interrupted by northeasterly flow anomalies, is expected. The risk of tropical influences and heavy rainfall events remains elevated, particularly for the northern North Island.
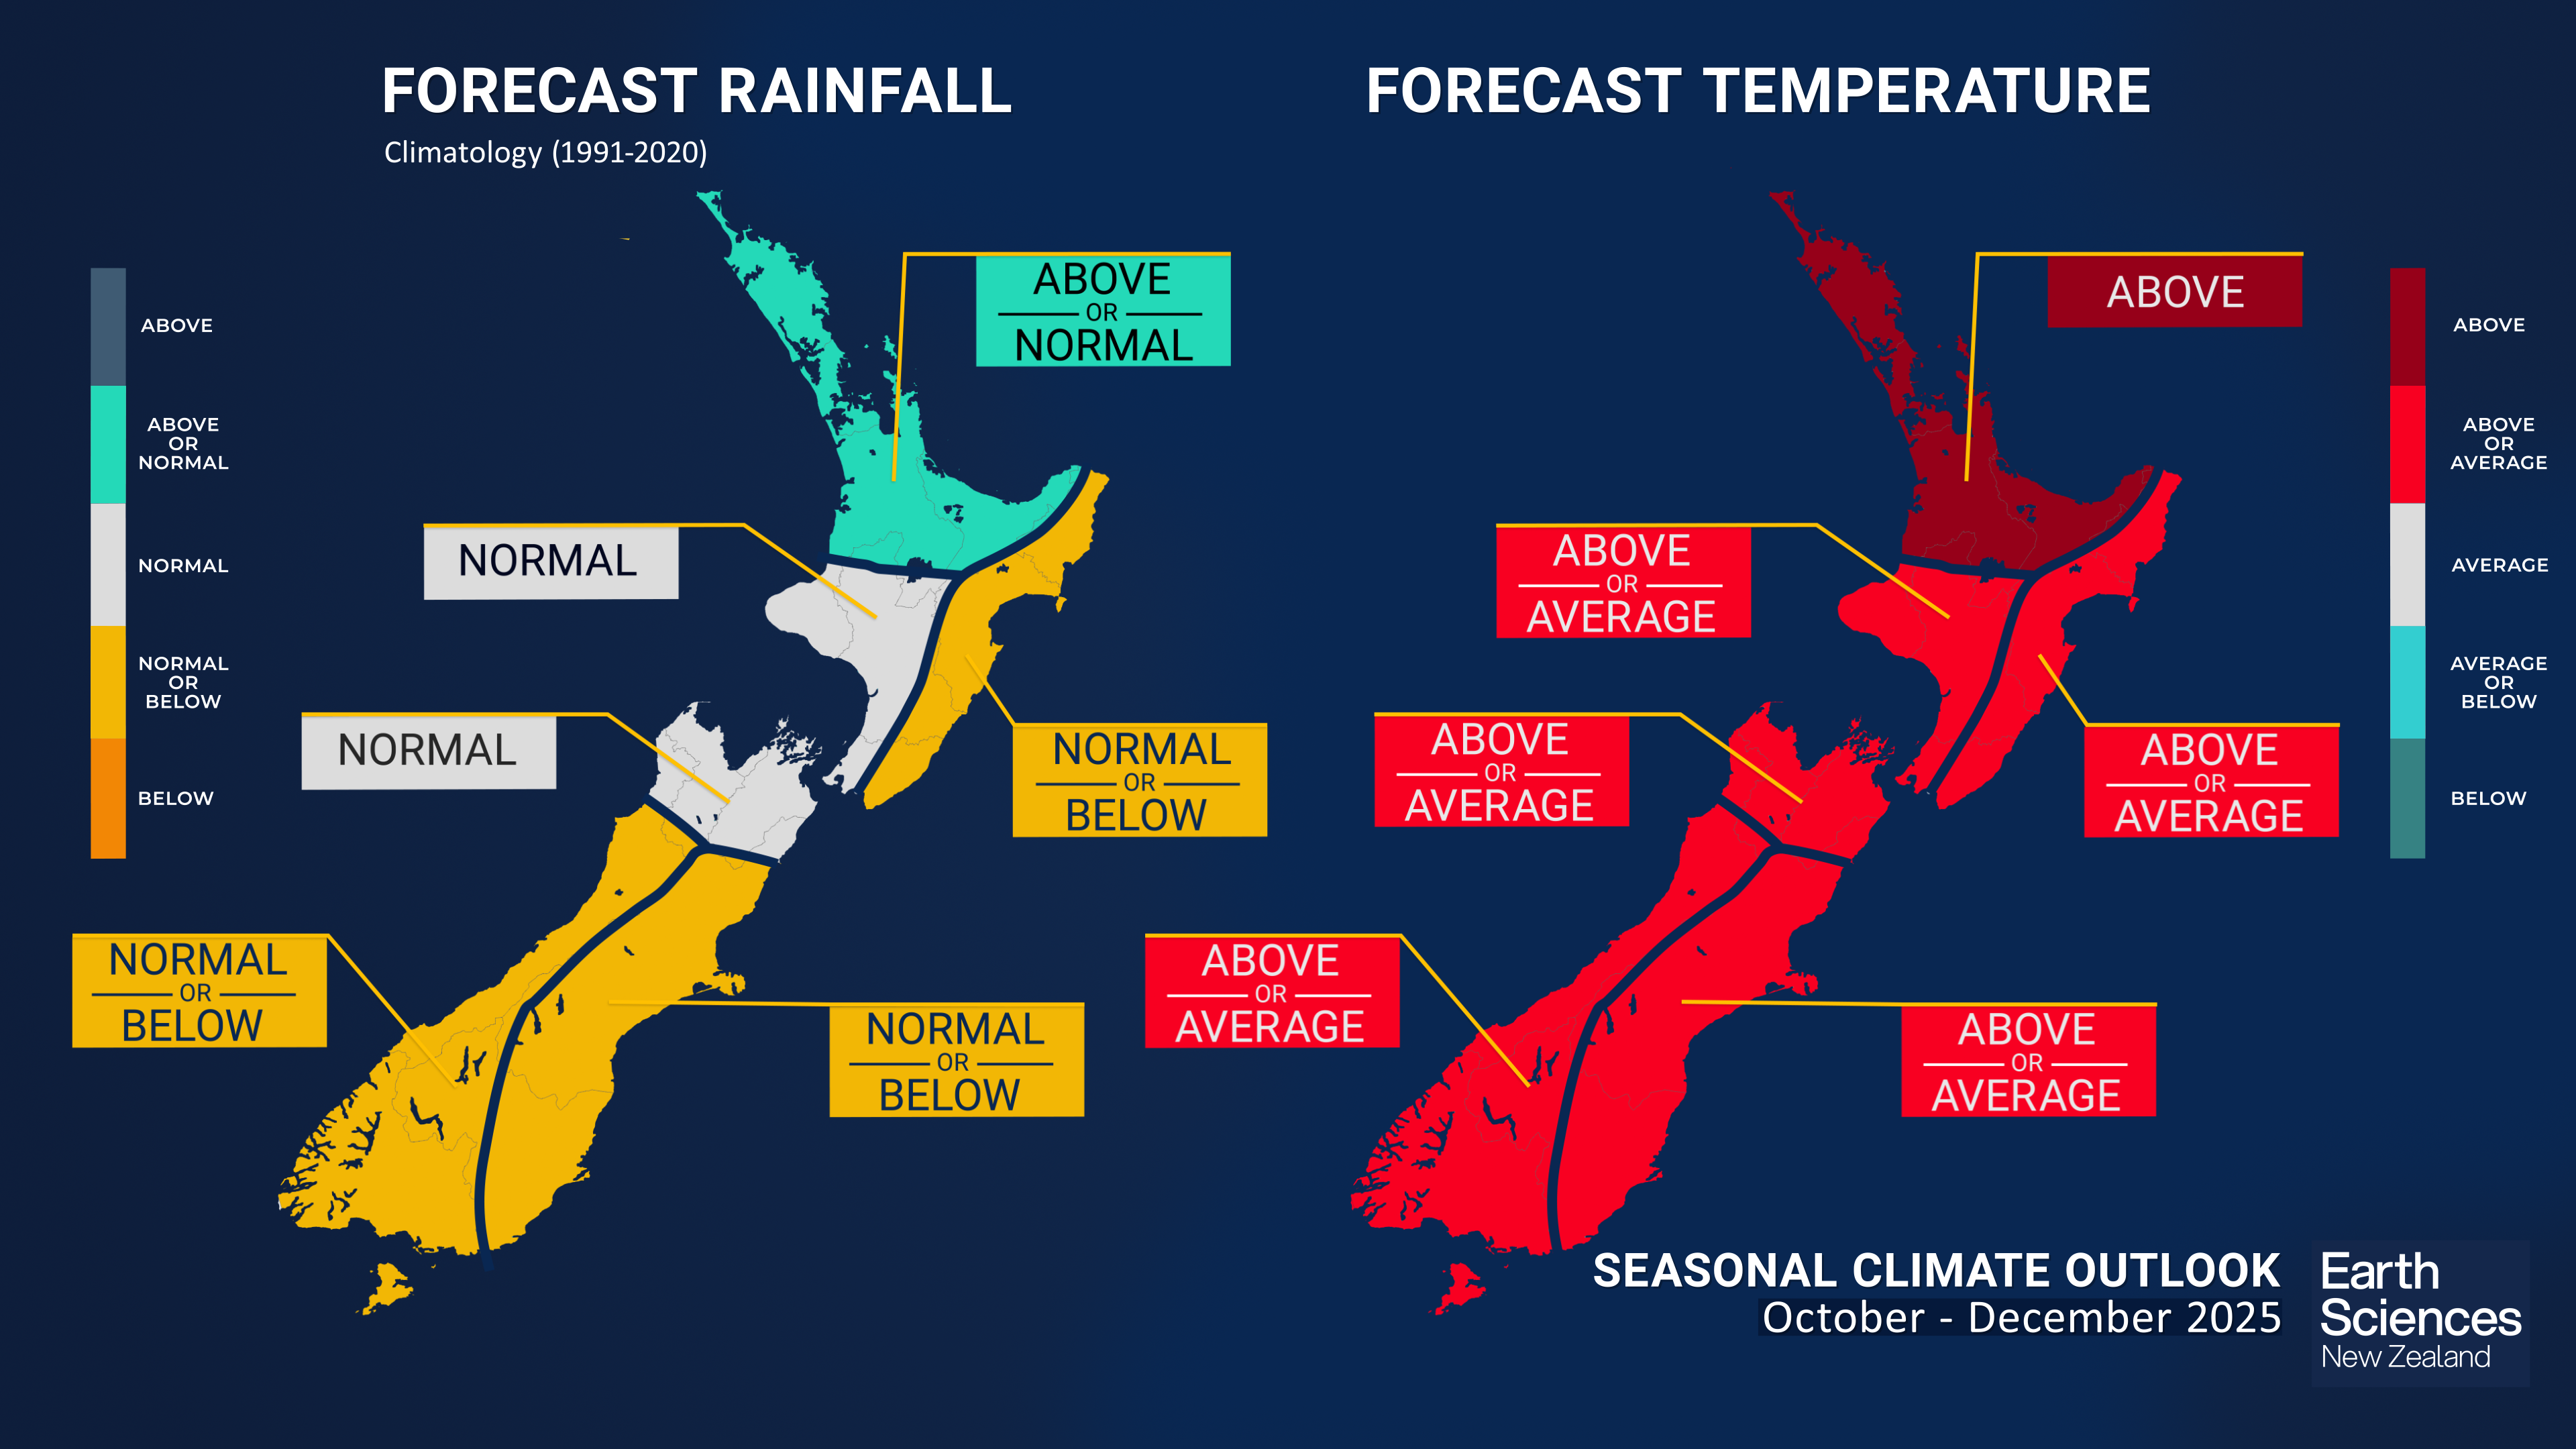
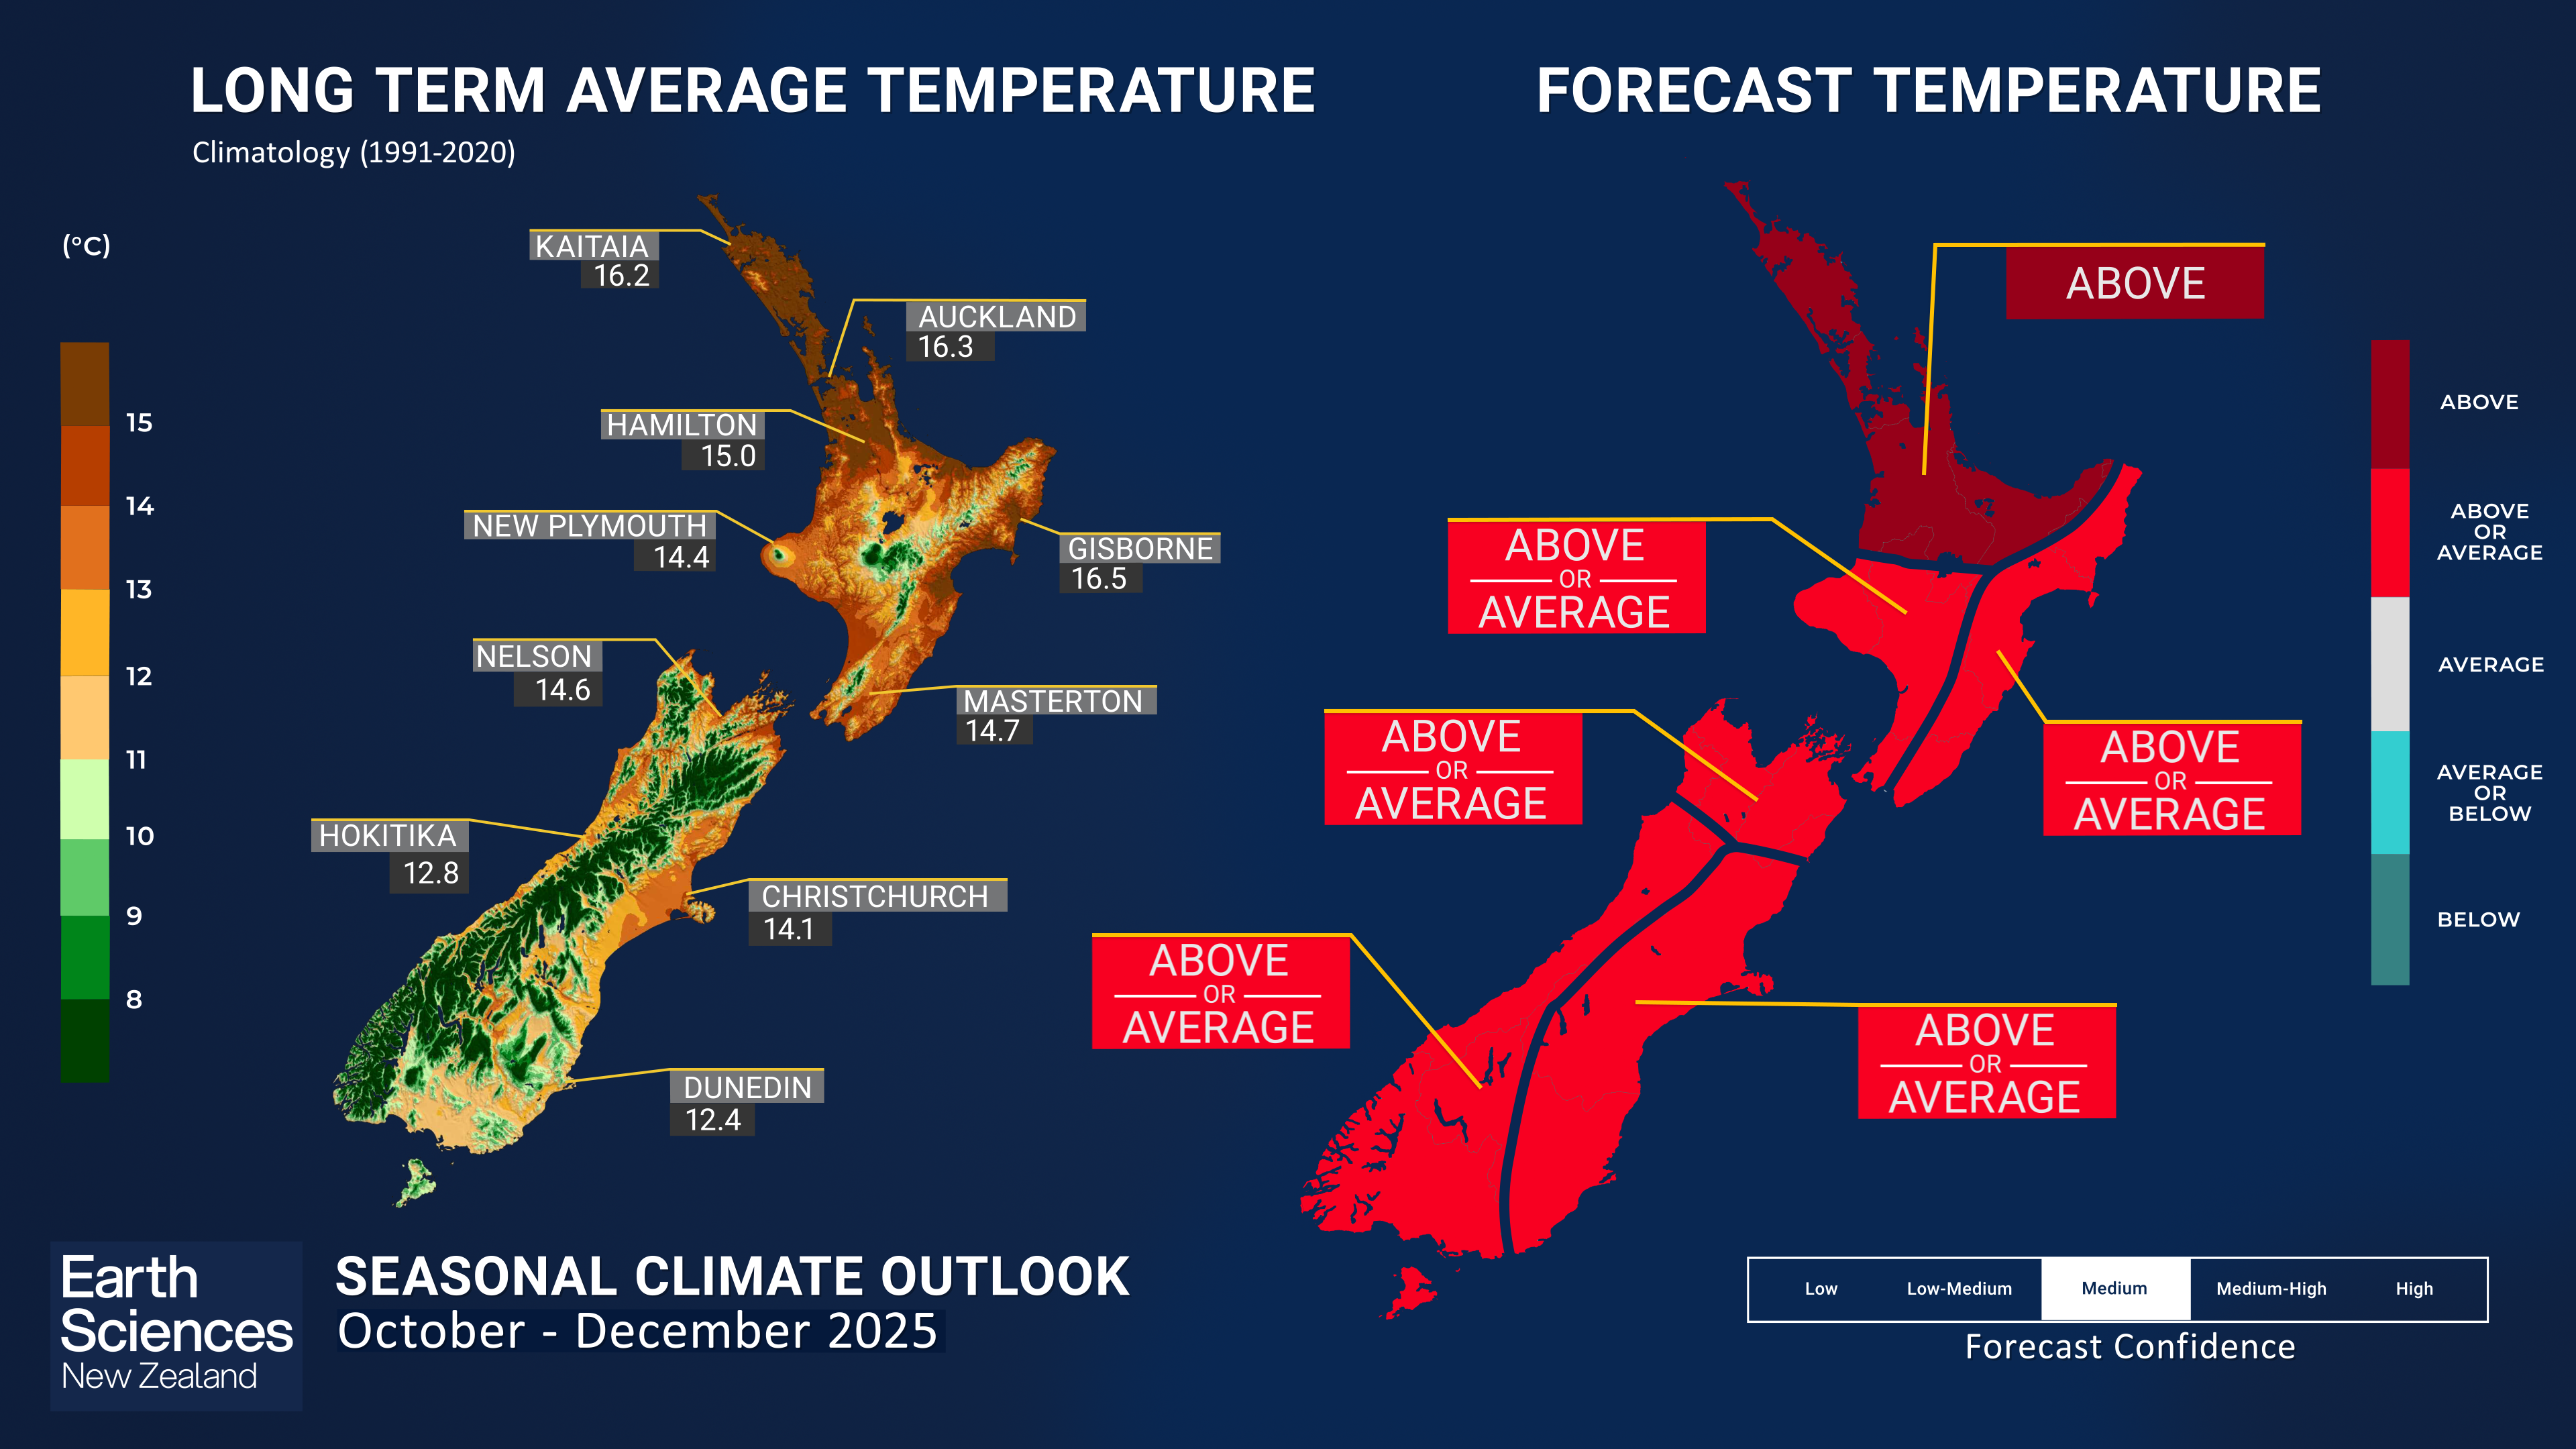
- Seasonal air temperatures for the next three-month period are about equally likely to be near average or above average for all regions of New Zealand, except for the north of the North Island, where above average temperatures are most likely.
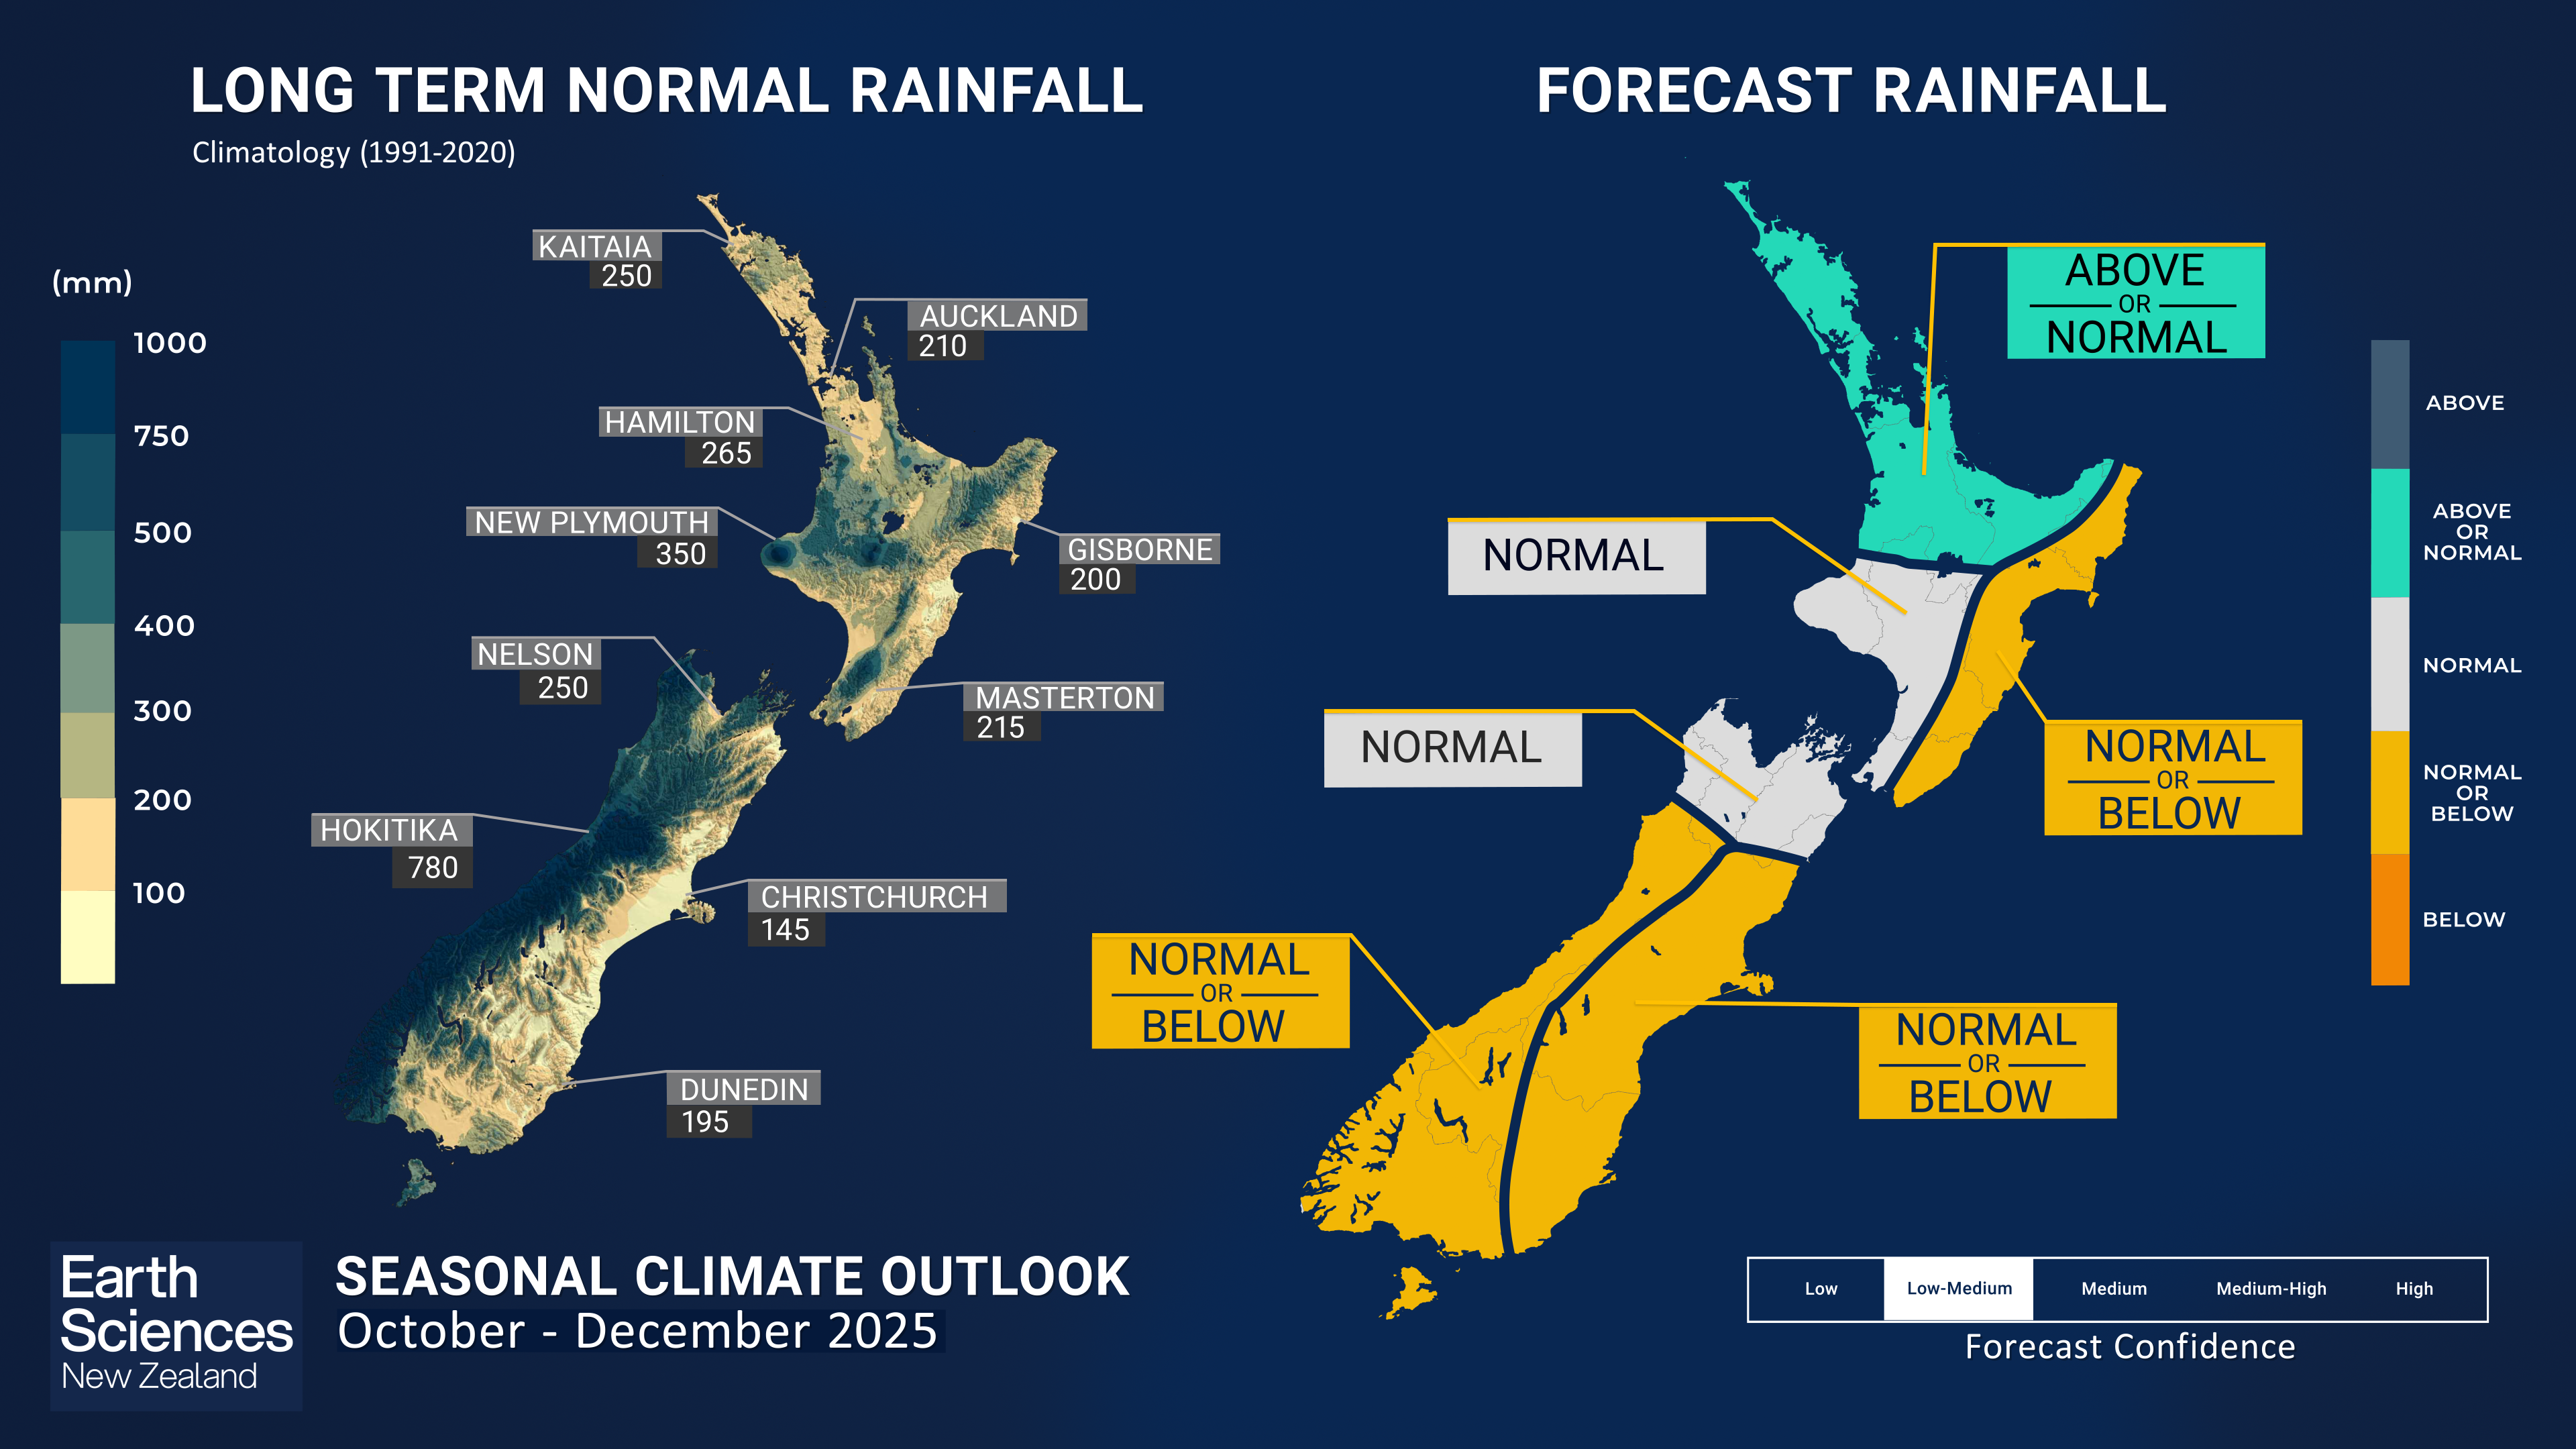
- October – December rainfall totals are expected to be near normal or above normal for the north of the North Island. Near normal or below normal rainfall is forecast for the east of the North Island as well as the west and east of the South Island. Near normal rainfall is expected for the west of the North Island and the north of the South Island. Sub-seasonal, or monthly, projections of rainfall and dryness are updated daily through the NIWA35 forecast.
- During October – December 2025, soil moisture levels and river flows are forecast to be below normal or near normal for the north and east of the North Island, while near normal or above normal soil moisture levels and river flows are forecast for the west of the South Island. Near normal soil moisture levels and river flows are expected in the remaining regions of New Zealand.
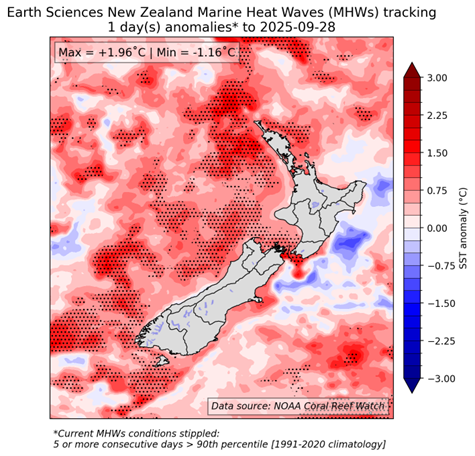
- SSTs cooled markedly around New Zealand during September 2025. Notably, large areas east of the North Island are now experiencing below-average ocean temperatures. Meanwhile, the extent and intensity of marine heatwave (MHW) conditions off the west coast of the South Island have diminished. Coupled General Circulation Model (GCM) forecasts suggest SSTs will generally remain near or slightly above average for the remainder of the year, with warming expected later in the period, particularly off the east coast of the North Island. Monitor the SST update for updates.
Regional predictions for October – December 2025
The tables below show the probabilities (or percent chances) for each of three categories: above average, near average, and below average. In the absence of any forecast guidance there would be an equal likelihood (33% chance) of the outcome for any of the three categories. Forecast information from local and global guidance models is used to indicate the deviation from equal chance that is expected for the coming three-month period. All outlooks are for the three months averaged as a whole. During these three months, there will inevitably be relatively wet and dry periods, as well as hot and cold periods. The exact range in temperature and rainfall within each of the three categories varies with location and season. However, as a guide, the “near average” or middle category for the temperature predictions includes deviations up to ±0.5°C relative to the long-term mean, whereas for rainfall the “near normal” category lies between 80 percent and 120 percent of the long-term (1991-2020) mean.
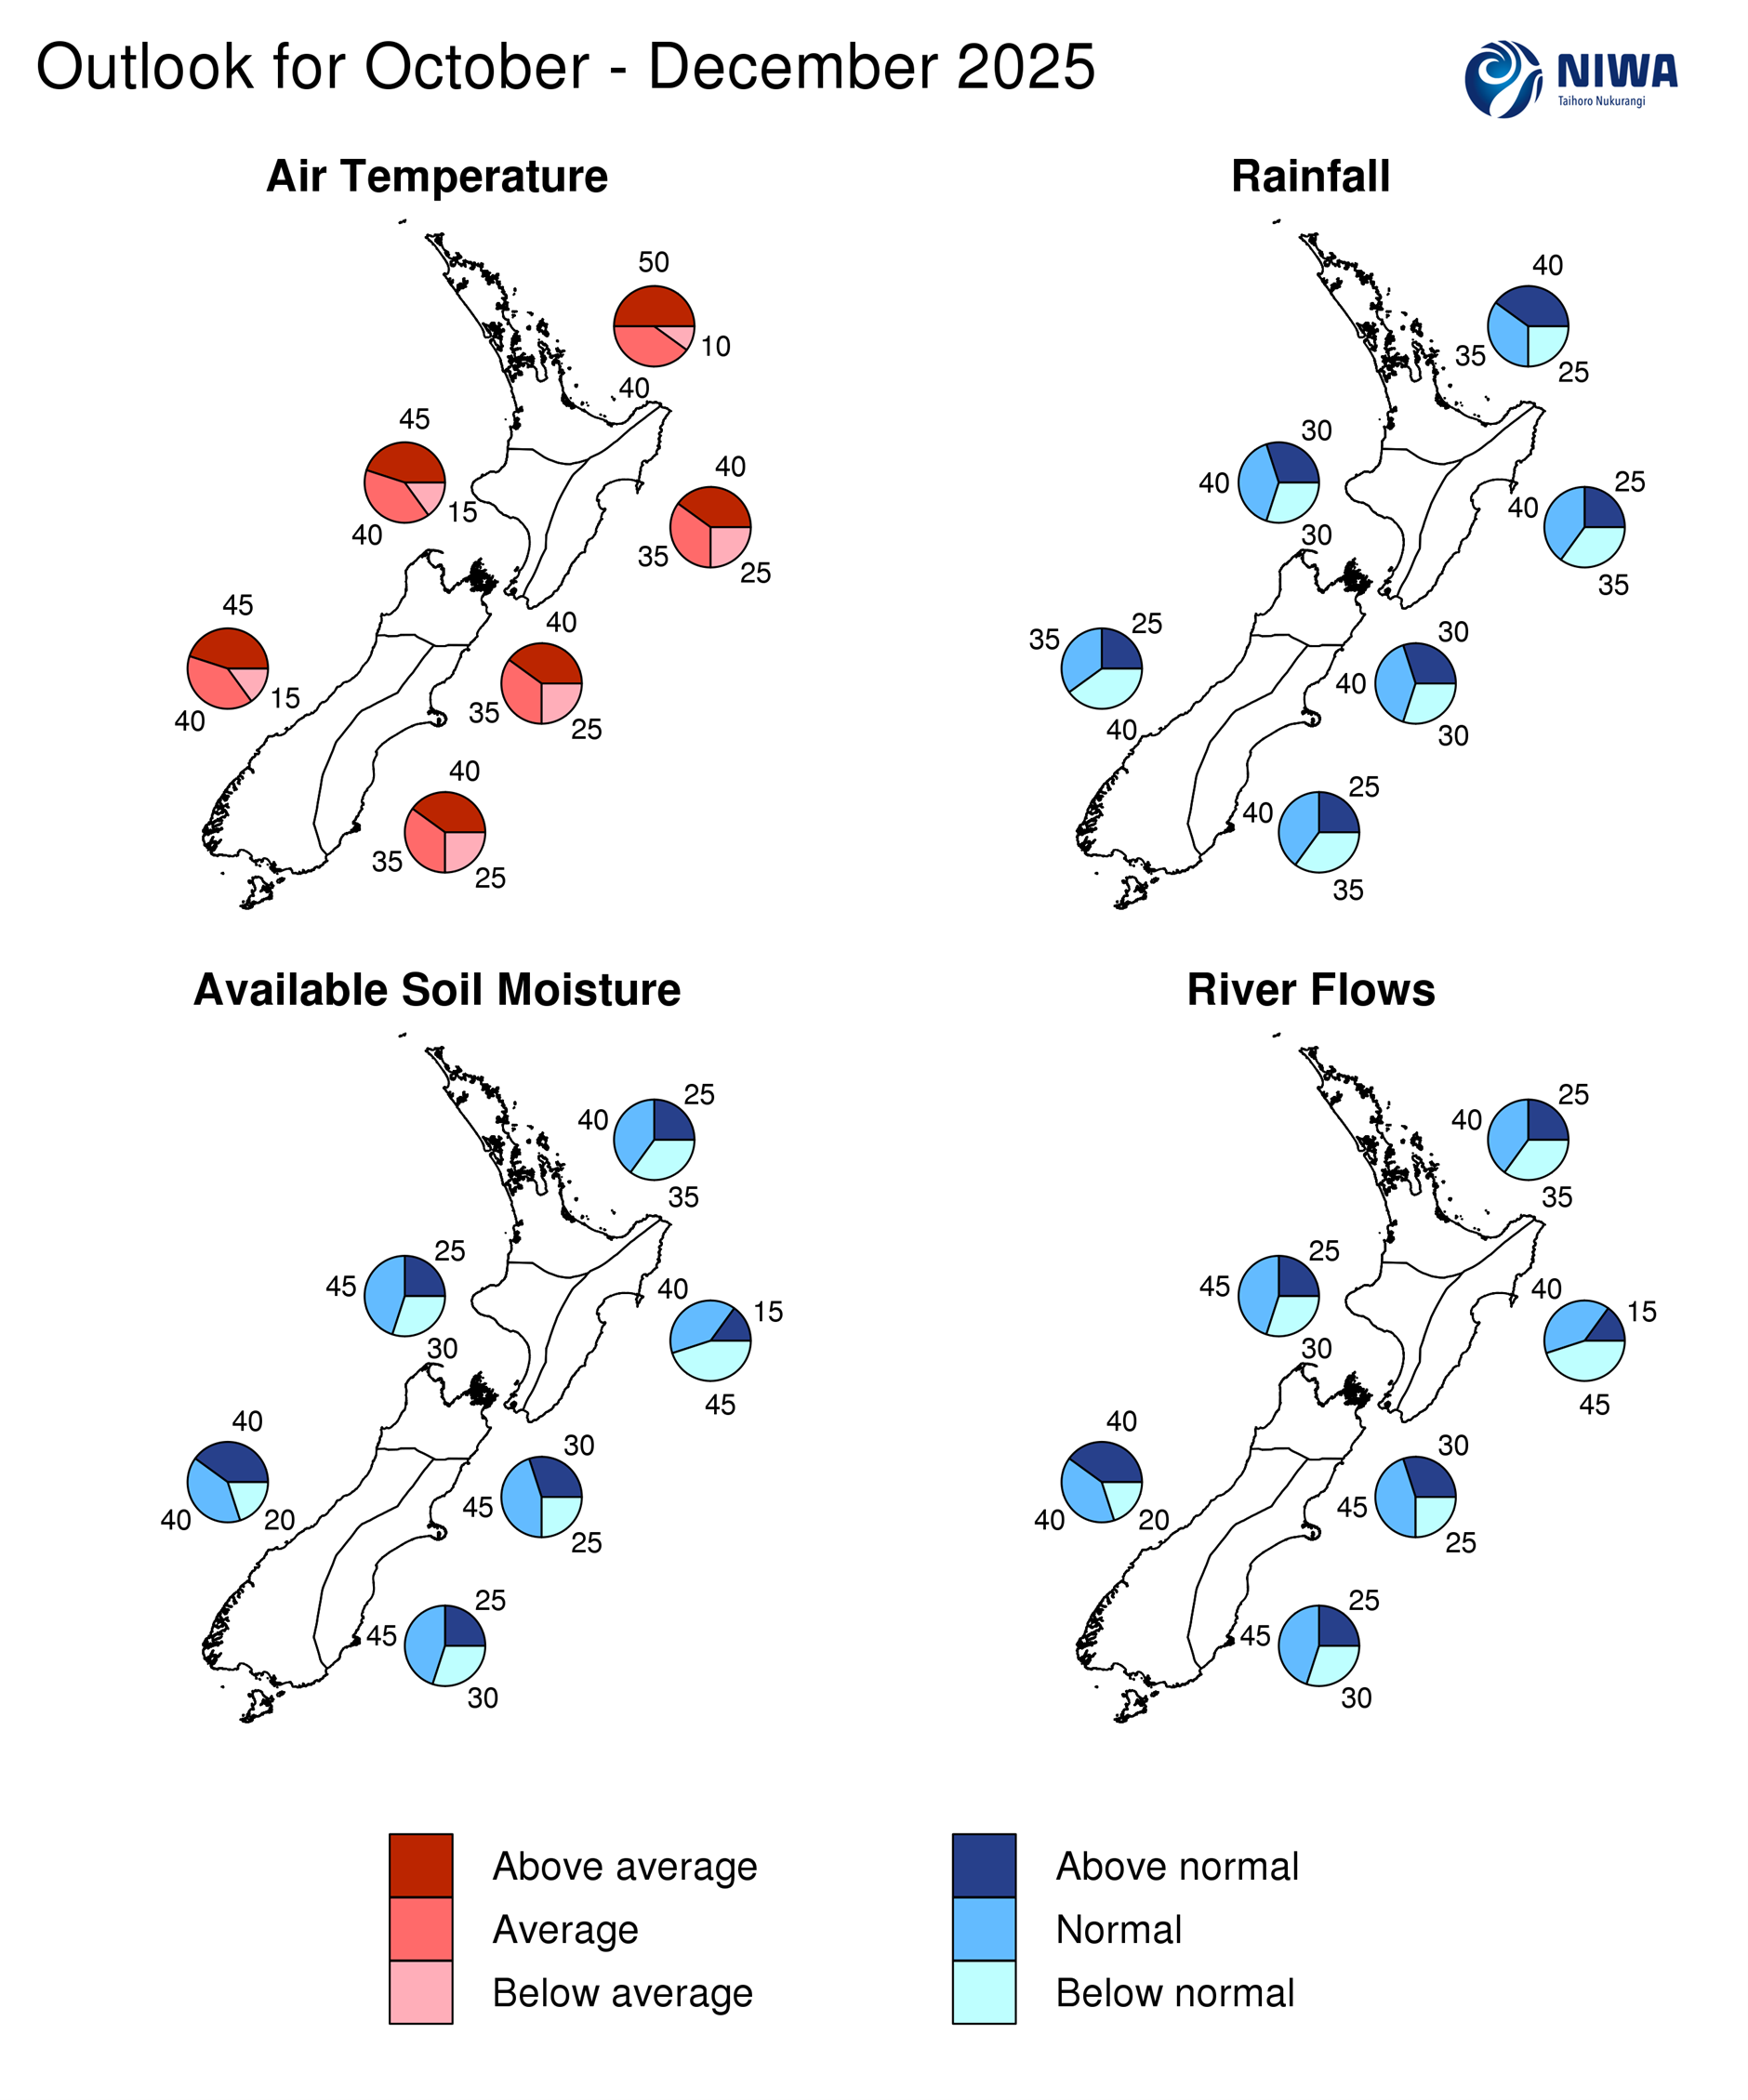
Northland, Auckland, Waikato, Bay of Plenty
- Temperatures are most likely to be above average (50% chance).
- Rainfall totals are about equally likely to be above normal (40% chance) or near normal (35% chance).
- This region will have the greatest chance to see irregular short and sharp rain events as the season progresses, including the possibility for atmospheric rivers or an ex-tropical cyclone.
- Soil moisture levels and river flows are about equally likely to be near normal (40% chance) or below normal (35% chance).
| Temperature | Rainfall | Soil moisture | River flows | |
| Above average | 50 | 40 | 25 | 25 |
| Near average | 40 | 35 | 40 | 40 |
| Below average | 10 | 25 | 35 | 35 |
Central North Island, Taranaki, Whanganui, Manawatu, Wellington
Probabilities are assigned in three categories: above average, near average, and below average.
- Temperatures are about equally likely to be above average (45% chance) or near average (40% chance).
- Rainfall totals are most likely to be near normal (40% chance)
- Soil moisture levels and river flows are most likely to be near normal (45% chance).
| Temperature | Rainfall | Soil moisture | River flows | |
| Above average | 45 | 30 | 25 | 25 |
| Near average | 40 | 40 | 45 | 45 |
| Below average | 15 | 30 | 30 | 30 |
Gisborne, Hawke’s Bay, Wairarapa
Probabilities are assigned in three categories: above average, near average, and below average.
- Temperatures are about equally likely to be above average (40% chance) or near average (35% chance).
- Rainfall totals are about equally likely to be near normal (40% chance) or below normal (35% chance).
- Soil moisture levels and river flows are about equally likely to be below normal (45% chance) or near normal (40% chance).
| Temperature | Rainfall | Soil moisture | River flows | |
| Above average | 40 | 25 | 15 | 15 |
| Near average | 35 | 40 | 40 | 40 |
| Below average | 25 | 35 | 45 | 45 |
Tasman, Nelson, Marlborough, Buller
Probabilities are assigned in three categories: above average, near average, and below average.
- Temperatures are about equally likely to be above average (40% chance) or near average (35% chance).
- Rainfall totals are most likely to be near normal (40% chance).
- Soil moisture levels and river flows are most likely to be near normal (45% chance).
| Temperature | Rainfall | Soil moisture | River flows | |
| Above average | 40 | 30 | 30 | 30 |
| Near average | 35 | 40 | 45 | 45 |
| Below average | 25 | 30 | 25 | 25 |
West Coast, Southern Alps and foothills, inland Otago, Southland
Probabilities are assigned in three categories: above average, near average, and below average.
- Temperatures are about equally likely to be above average (45% chance) or near average (40% chance).
- Rainfall totals are about equally likely to be below normal (40% chance) or near normal (35% chance) for the October-December season as a whole.
- Soil moisture levels and river flows are equally likely to be near normal (40% chance) or above normal (40% chance).
| Temperature | Rainfall | Soil moisture | River flows | |
| Above average | 45 | 25 | 40 | 40 |
| Near average | 40 | 35 | 40 | 40 |
| Below average | 15 | 40 | 20 | 20 |
Coastal Canterbury and the nearby plains, east Otago
Probabilities are assigned in three categories: above average, near average, and below average.
- Temperatures are about equally likely to be above average (40% chance) or near average (35% chance).
- Rainfall totals are about equally likely to be near normal (40% chance) or below normal (35% chance).
- Soil moisture levels and river flows are most likely to be near normal (45% chance).
The full probability breakdown is:
| Temperature | Rainfall | Soil moisture | River flows | |
| Above average | 40 | 25 | 25 | 25 |
| Near average | 35 | 40 | 45 | 45 |
| Below average | 25 | 35 | 30 | 30 |
Background
Sea surface temperatures (SSTs) in the central equatorial Pacific (Niño 3.4 Index) have continued to cool significantly, and below average water temperatures dominate the equatorial Pacific near and east of the International Date Line. The traditional Niño 3.4 Index anomaly for the month (to 28 September) is -0.42°C, on the La Niña side of neutral. In addition, the relative Niño 3.4 Index (RONI*)’s latest 30-day value (to 28 September) now exceeds the −0.7°C threshold typically utilised to define a La Niña event, at −0.75°C.
The Southern Oscillation Index (SOI) weakened significantly in September 2025 and is now close to zero, with the value for September (estimated using data to 27 September) being -0.06 (in the neutral range).
Subsurface ocean temperature anomalies intensified markedly in September across the central and eastern Pacific, with values now exceeding -4°C locally between 150°W and 120°W at depths of 50 to 150 meters. In contrast, subsurface temperatures in the western Pacific remained above average. This sharp east-west contrast forms a pronounced equatorial dipole, a characteristic signature of typical La Niña conditions.
Accordingly, negative upper-ocean heat content anomalies (ocean temperature anomalies integrated over the top 300m of the ocean) are present between 150°W and about 100°W, with anomalies exceeding -1.5°C.
In summary, the oceanic component of the coupled ENSO system continued to shift towards a more definitive La Niña state in September 2025. In contrast to the clear oceanic signals of La Niña, in the atmosphere intraseasonal variability, including shorter-frequency Equatorial Rossby Waves and a slackening of trade winds, interfered with the coherence of the anomalous walker circulation. This is reflected in the SOI which considers the pressure difference between Tahiti (eastern Pacific) and Darwin (western Pacific), which transitioned to a more neutral state in September. Nevertheless, strong negative outgoing long wave radiation (OLR) anomalies persisted across much of the Maritime Continent with positive anomalies in the central and eastern Pacific, suggesting that La Niña like circulation patterns may be emerging.
ENSO-neutral conditions persist across the tropical Pacific, but a La Niña Watch is in effect. While the Southern Oscillation Index is currently in the neutral range, the oceanic anomalies have intensified, both at and below the surface. SST anomalies in the central and eastern Pacific are close to La Niña thresholds, and the Relative Oceanic Niño Index (RONI) is now (as of the past 30 days to 28 September) below the conventional -0.7oC La Niña threshold.
Based on the traditional Niño 3.4 index, and the dynamical and statistical models monitored by Earth Sciences New Zealand, La Niña conditions are the most likely outcome (60% chance) over the forecast period (October – December 2025). An alternative perspective is provided by a Relative Oceanic Niño Index (RONI) forecast developed by Earth Sciences New Zealand, which accounts for the broader warming trend across the tropical Pacific. According to this RONI forecast, La Niña conditions are much more likely (87% chance) to become established during October-December.
The Southern Annular Mode (SAM) has been mostly negative during the month of September 2025 (about 91% of days negative). The latest 30-day SAM index value is in the neutral range (below 1 Standard Deviation) but negative at -0.73. The forecast from the Australian Bureau of Meteorology (BoM) is for the SAM to switch to positive values but to remain in the neutral range overall. Note that SAM forecasts are very uncertain beyond about two weeks.
The Indian Ocean Dipole (IOD) remained strongly negative in September, with a value of -0.72oC. According to guidance from the Australian Bureau of Meteorology, the IOD is expected to return to the neutral range by the end of the calendar year. It’s worth noting that the IOD typically peaks during austral spring (October–December), and negative IOD phases often coincide with the early development of La Niña conditions.
During September 2025, the Madden–Julian Oscillation (MJO) was mostly inactive. MJO-related convective activity is expected to pick up in the Indian Ocean in about two weeks, and this would be associated with a short period of suppressed convective activity over the Maritime Continent and the western Pacific Ocean, temporarily counteracting any La Niña-like pattern in convection and rainfall.
Local Sea Surface Temperatures (SSTs): SSTs cooled markedly around New Zealand during September. Notably, large areas east of the North Island are now experiencing below-average temperatures. Meanwhile, the extent and intensity of marine heatwave (MHW) conditions off the west coast of the South Island have diminished. Coupled General Circulation Model (GCM) forecasts suggest SSTs will generally remain near or slightly above average for the remainder of the year, with warming expected later in the period, particularly off the east coast of the North Island.
| North NI | +0.57°C |
| West NI | +0.70°C |
| East NI | +0.09°C |
| North SI | +0.70°C |
| West SI | +0.69°C |
| East SI | +0.68°C |
The Relative Oceanic Niño 3.4 Index (RONI) is a modern way of measuring oceanic El Niño and La Niña that is complementary to traditional oceanic indices. While traditional oceanic indices like the Niño 3.4 Index monitor SSTs in one region, the RONI compares the average SST in the central equatorial Pacific with the average SST across the global tropics. Since tropical rainfall patterns respond to changes in ocean temperatures, this new relative index can help forecasters better determine if the equatorial Pacific is warmer or cooler than the rest of the global tropics, which has become more challenging to discern as seas warm because of climate change.
Forecast Confidence
Temperature
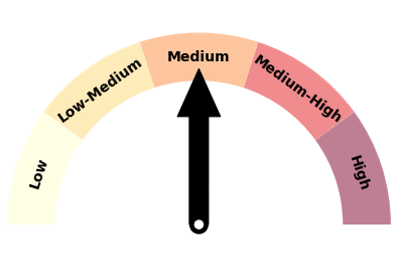
Forecast confidence for temperatures is medium. A mix of circulation patterns over the course of the next three-month period might lead to increased variability in both daytime and nighttime temperatures, leading to some uncertainty with regards to the average temperature outcome for the season.
Rainfall
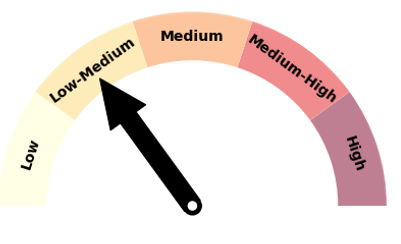
Forecast confidence for rainfall is low-medium. Several climate drivers are currently in play and their interactions and evolution over the next three-month period is uncertain. A significant transition in dominant circulation patterns is also expected over the course of the forecast period, and this will affect the rainfall totals for the season as a whole.
