Outlook Summary
- The coupled ocean-atmosphere system transitioned to ENSO-neutral (El Niño – Southern Oscillation) during February (i.e. neither La Niña nor El Niño). However, some remnant La Niña like circulations are expected to linger over the next few months, which may contribute to rain-bearing systems coming from the north.
- The Relative Oceanic Niño Index weakened (became less negative) in February 2026. With a value of –0.67°C, it no longer meets the La Niña threshold of –0.7 °C.
- Subsurface temperature anomalies now show a clear departure from previous La Niña‑like patterns.
- A sharp increase in Sea Surface Temperatures (SSTs) along the South American coast signalled the development of a so-called ‘coastal El Niño’, expected to be short-lived.
- There is a 95% chance for ENSO-neutral conditions to remain in the Tropical Pacific over the forecast period (March – May 2026).
- Despite the seasonal predictability barrier, the development of El Niño by winter is looking increasingly likely.
- For the next three-month period, the atmospheric circulation pattern over New Zealand is expected to see anomalous high pressure to the south of the country, and anomalous low pressure just to the north, leading to an easterly quarter flow anomaly overall.
- While autumn begins on an anticyclonic note, the risk of tropical incursions resumes from the second week of March, with unsettled conditions for the country. Although high pressure will most likely follow behind this and bring settled conditions, there is potential for another northerly sourced rainmaker near the end of the month, or in early April.
- For the remainder of April, and for May, the most likely source of significant weather is still to our north. Southern Ocean systems may be reduced in frequency, and the South Island in particular could see some prolonged settled periods.
- The Tropical Cyclone Outlook for the November 2025 – April 2026 southwest Pacific Tropical Cyclone (TC) season indicates a normal or elevated risk for ex-TC interaction for New Zealand. Although the season has been quiet so far, we remain in the peak climatological risk period for part of the outlook period, and there are indications of increased tropical activity over the next month compared with earlier in the season.
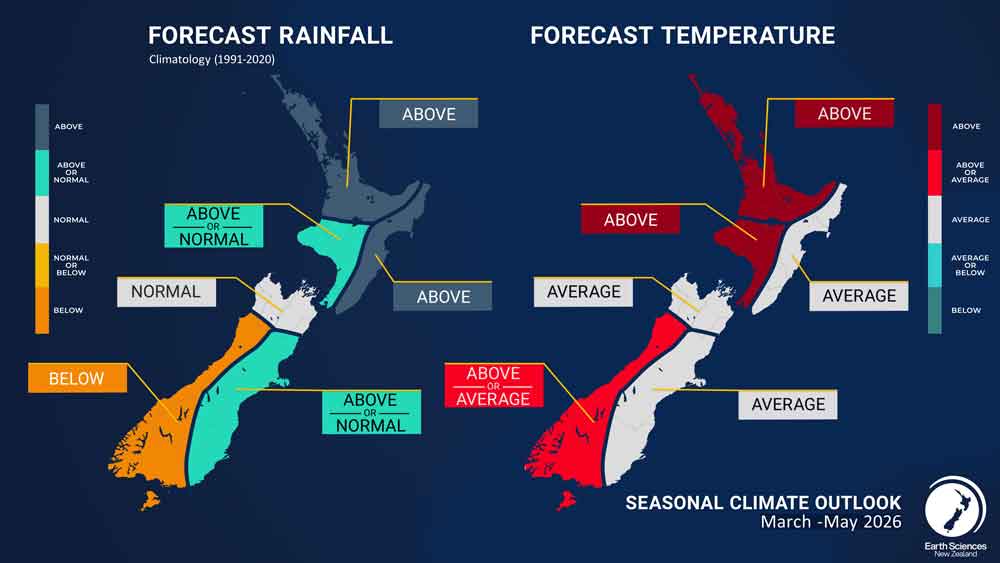
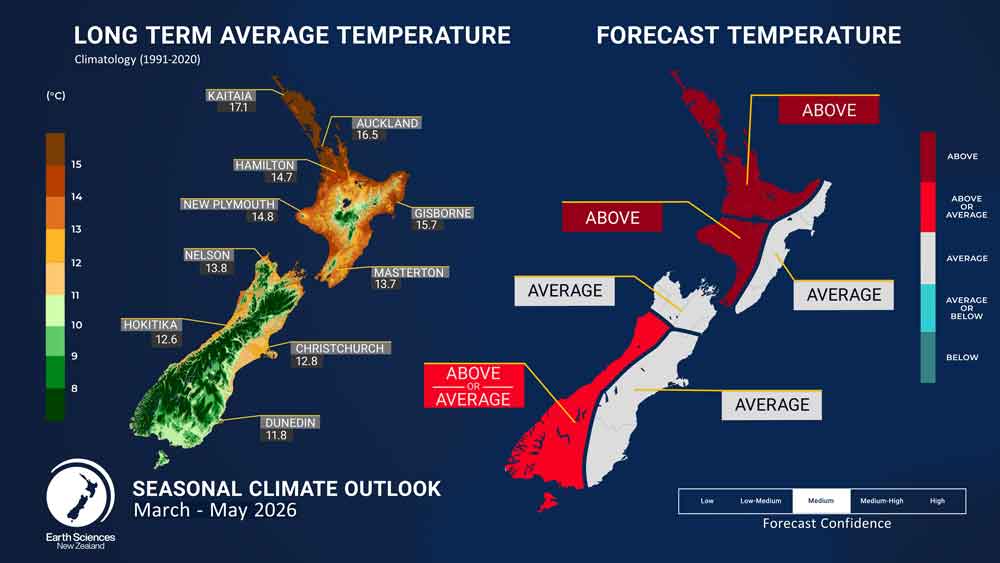
- Seasonal air temperatures for March – May 2026 are most likely to be above average for the north and west of the North Island, near average for the east of the North Island and the north and east of the South Island, and near or above average for the west of the South Island.
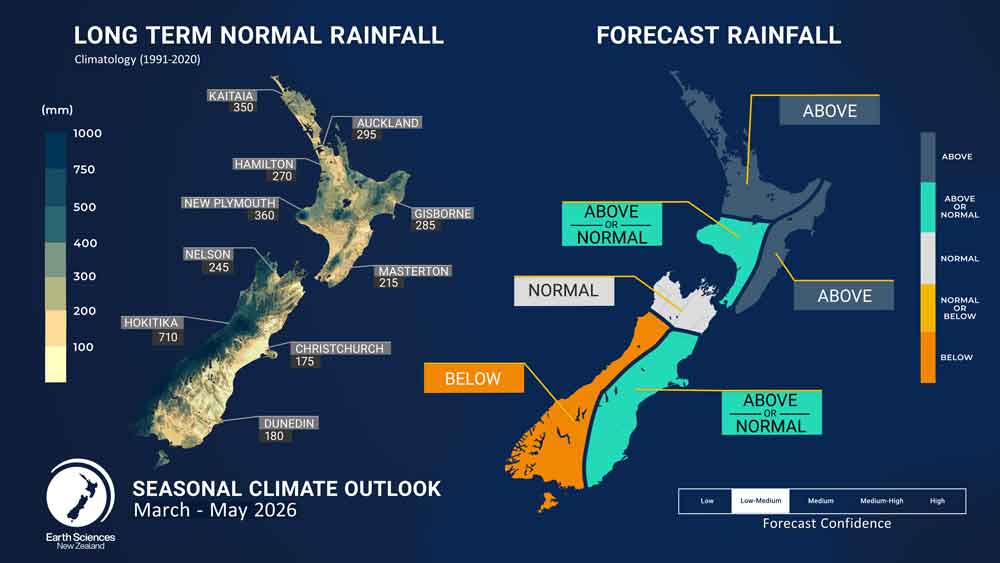
- Rainfall totals for March–May are most likely to be above normal in the north and east of the North Island. Near normal or above normal rainfall is forecast for the west of the North Island and east of the South Island, while near normal rainfall is expected in the north of the South Island. Below normal rainfall is most likely for the west of the South Island. There is an elevated risk of tropical‑influenced weather systems bringing significant rainfall to parts of the North Island, especially at intervals in March and April.
- During March – May 2026, near normal soil moisture levels and river flows are expected for the west of the North Island and the east of the South Island. Near or below normal soil moisture levels and river flows are forecast for the north of the North Island and the north of the South Island, while near or above normal soil moisture levels and river flows are forecast for the east of the North Island. In the west of the South Island, near normal soil moisture levels are most likely, while near or below normal river flows are equally likely.
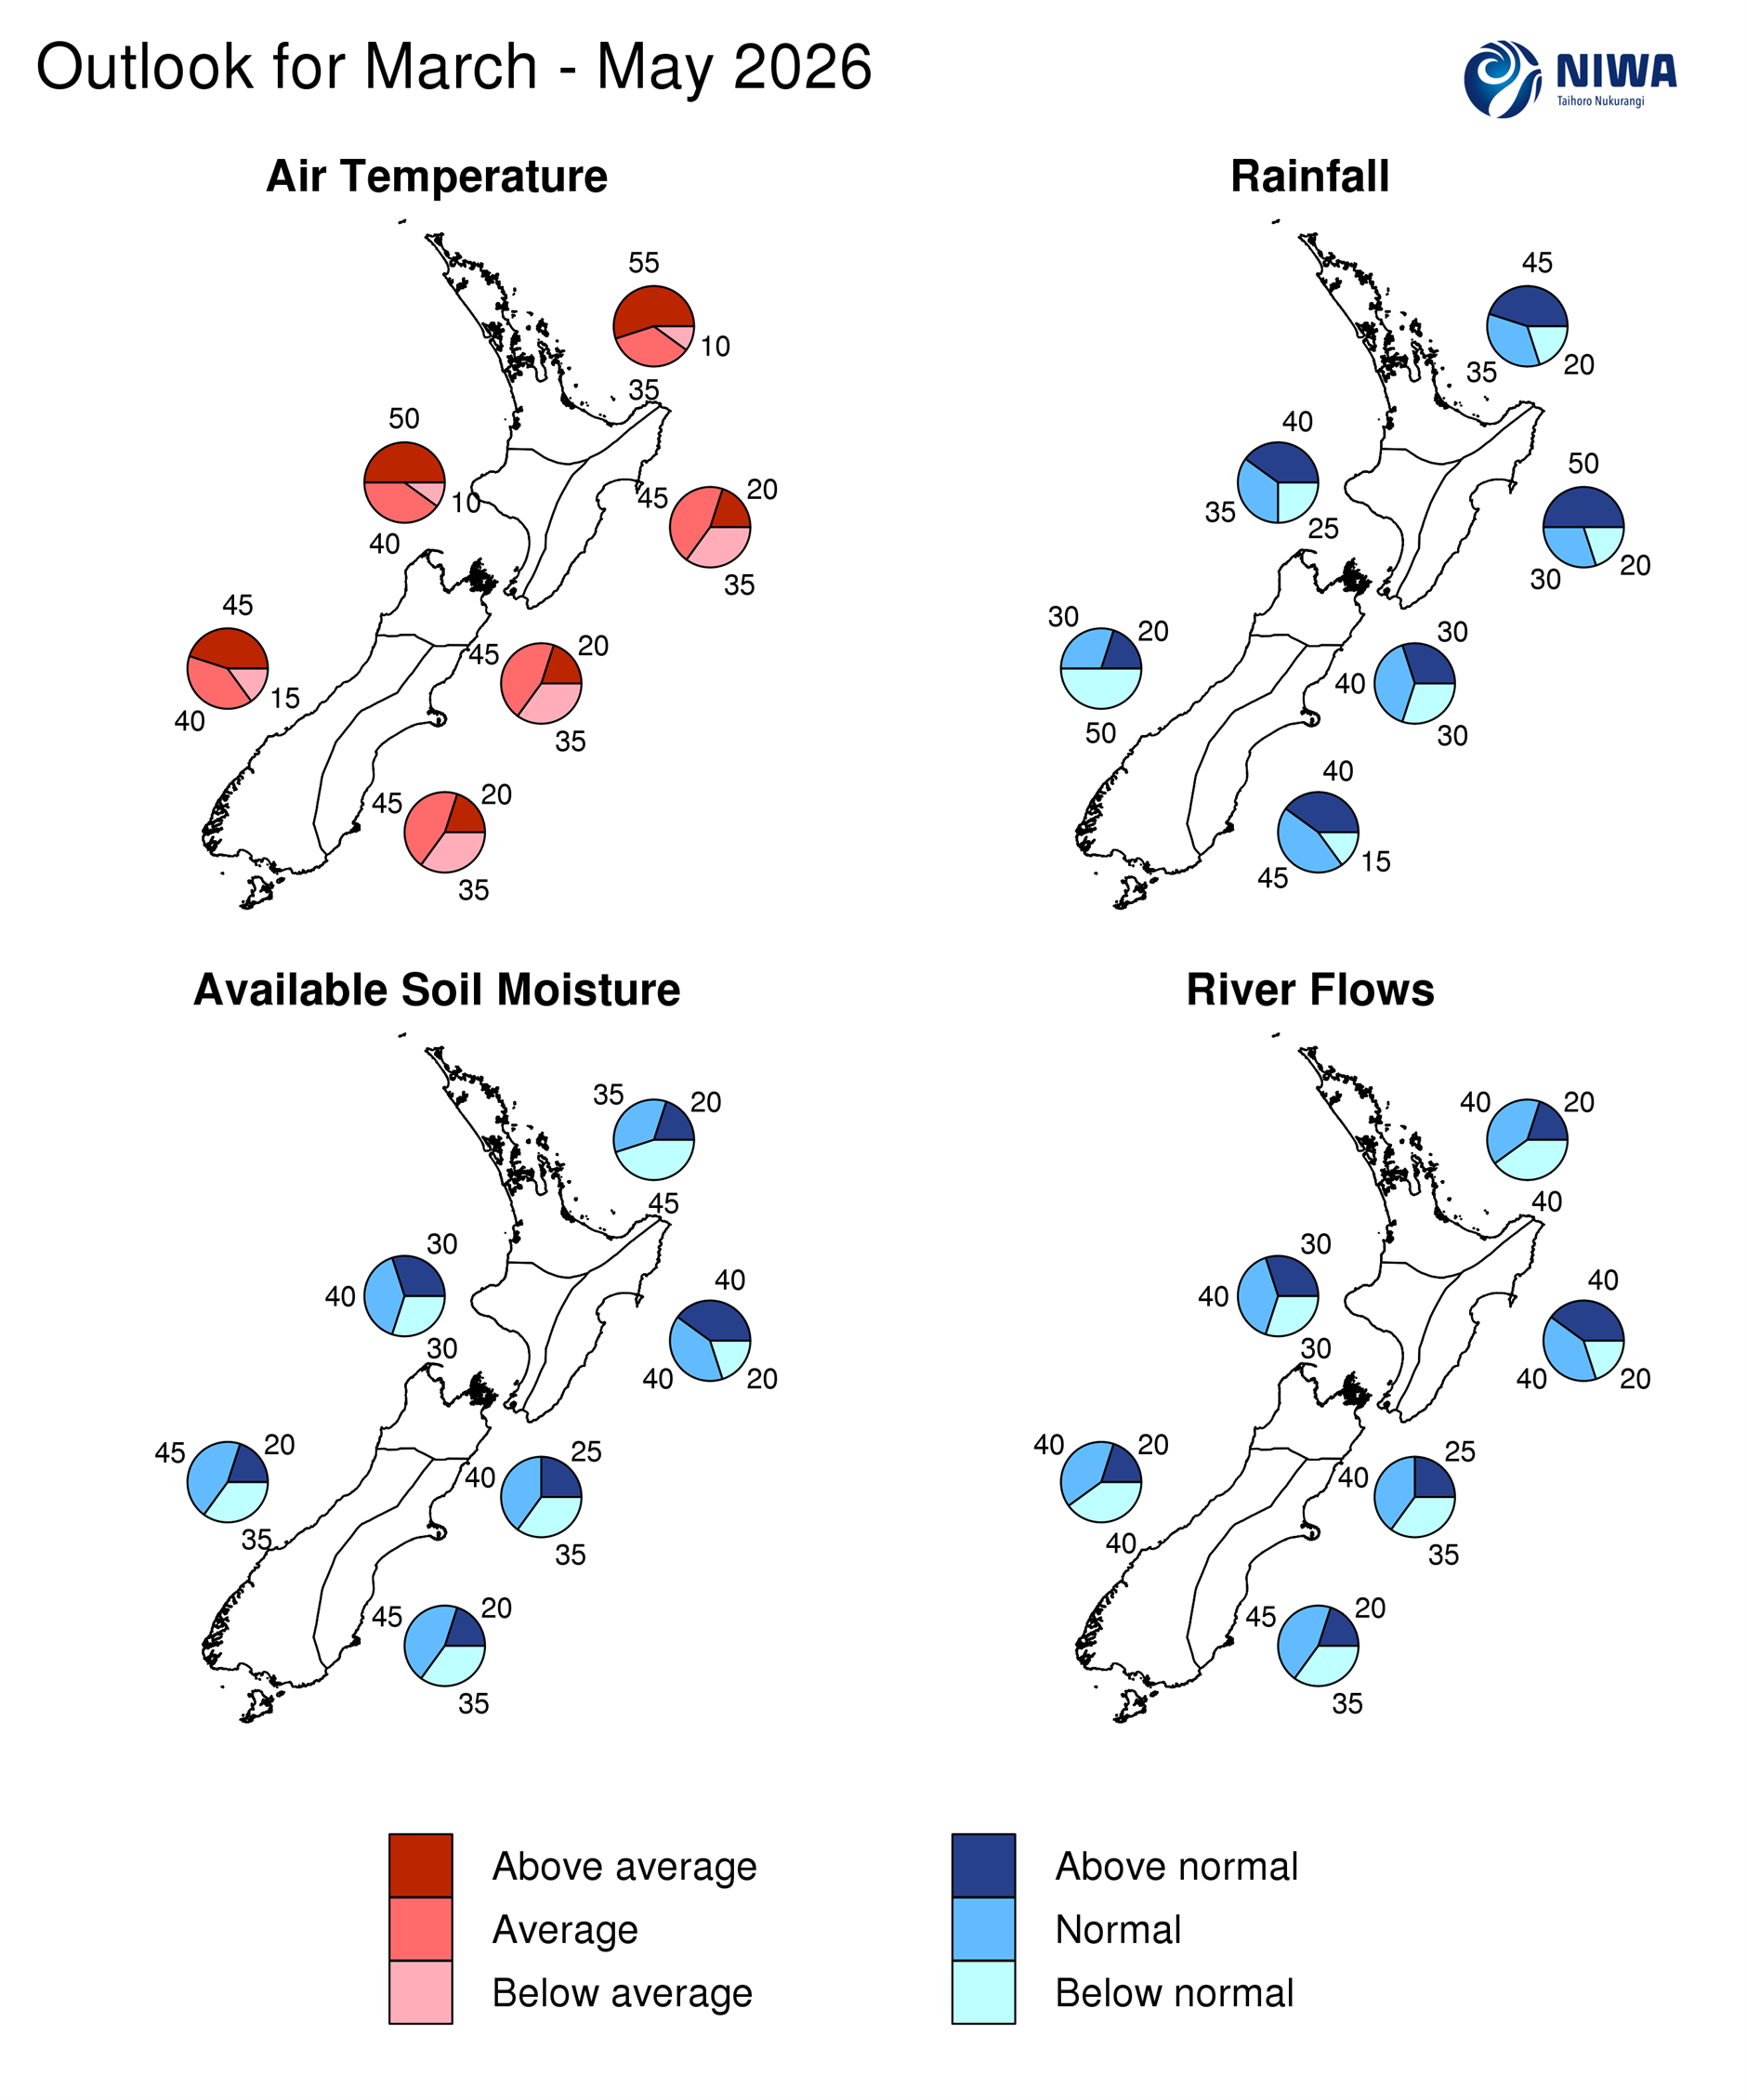
Regional predictions for March – May 2026
The tables below show the probabilities (or percent chances) for each of three categories: above average, near average, and below average. In the absence of any forecast guidance there would be an equal likelihood (33% chance) of the outcome for any of the three categories. Forecast information from local and global guidance models is used to indicate the deviation from equal chance that is expected for the coming three-month period. All outlooks are for the three months averaged as a whole. During these three months, there will inevitably be relatively wet and dry periods, as well as hot and cold periods. The exact range in temperature and rainfall within each of the three categories varies with location and season. However, as a guide, the “near average” or middle category for the temperature predictions includes deviations up to ±0.5°C relative to the long-term mean, whereas for rainfall the “near normal” category lies between 80 percent and 120 percent of the long-term (1991-2020) mean.
Northland, Auckland, Waikato, Bay of Plenty
- Temperatures are most likely to be above average (55% chance).
- Rainfall totals are most likely to be above normal (45% chance). Weather systems with subtropical or tropical connections may lead to episodes of heavy rainfall, perhaps most likely in March or April
- Soil moisture levels are most likely to be below normal (45% chance)
- River flows are equally likely to be below normal (40% chance) or near normal (40% chance).
| Temperature | Rainfall | Soil moisture | River flows | |
| Above average | 55 | 45 | 20 | 20 |
| Near average | 35 | 35 | 35 | 40 |
| Below average | 10 | 20 | 45 | 40 |
Central North Island, Taranaki, Whanganui, Manawatu, Wellington
Probabilities are assigned in three categories: above average, near average, and below average.
- Temperatures are most likely to be above average (50% chance)
- Rainfall totals are about equally likely to be above normal (40% chance) or near normal (35% chance). Weather systems linked to the subtropics or tropics may bring periods of heavy rainfall
- Soil moisture levels and river flows are most likely to be near normal (40% chance), although the near‑even spread of probabilities indicates notable forecast uncertainty.
| Temperature | Rainfall | Soil moisture | River flows | |
| Above average | 50 | 40 | 30 | 30 |
| Near average | 40 | 35 | 40 | 40 |
| Below average | 10 | 25 | 30 | 30 |
Gisborne, Hawke’s Bay, Wairarapa
Probabilities are assigned in three categories: above average, near average, and below average.
- Temperatures are most likely to be near average (45% chance)
- Rainfall is most likely to be above normal (50% chance). Weather systems linked to the subtropics or tropics may bring periods of heavy rainfall
- Soil moisture levels and river flows are equally likely to be above normal (40% chance) or near normal (40% chance).
| Temperature | Rainfall | Soil moisture | River flows | |
| Above average | 20 | 50 | 40 | 40 |
| Near average | 45 | 30 | 40 | 40 |
| Below average | 35 | 20 | 20 | 20 |
Tasman, Nelson, Marlborough, Buller
Probabilities are assigned in three categories: above average, near average, and below average.
- Temperatures are most likely to be near average (45% chance)
- Rainfall totals are most likely to be near normal (40% chance), although the near‑even spread of probabilities indicates notable forecast uncertainty
- Soil moisture levels and river flows are about equally likely to be near normal (40% chance) or below normal (35% chance)
| Temperature | Rainfall | Soil moisture | River flows | |
| Above average | 20 | 30 | 25 | 25 |
| Near average | 45 | 40 | 40 | 40 |
| Below average | 35 | 30 | 35 | 35 |
West Coast, Southern Alps and foothills, inland Otago, Southland
Probabilities are assigned in three categories: above average, near average, and below average.
- Temperatures are about equally likely to be above average (45% chance) or near average (40% chance)
- Rainfall totals are most likely to be below normal (50% chance) for the March – May 2026 period as a whole
- Soil moisture levels are most likely to be near normal (45% chance)
- River flows are equally likely to be below normal (40% chance) or near normal (40% chance).
| Temperature | Rainfall | Soil moisture | River flows | |
| Above average | 45 | 20 | 20 | 20 |
| Near average | 40 | 30 | 45 | 40 |
| Below average | 15 | 50 | 35 | 40 |
Coastal Canterbury and the nearby plains, east Otago
Probabilities are assigned in three categories: above average, near average, and below average.
- Temperatures are most likely to be near average (45% chance)
- Rainfall totals are about equally likely to be above normal (40% chance) or near normal (45% chance)
- Soil moisture levels are most likely to be near normal (45% chance)
- River flows are most likely to be near normal (45% chance).
The full probability breakdown is:
| Temperature | Rainfall | Soil moisture | River flows | |
| Above average | 20 | 40 | 20 | 20 |
| Near average | 45 | 45 | 45 | 45 |
| Below average | 35 | 15 | 35 | 35 |
Background
The traditional Southern Oscillation Index (SOI) was just reaching the La Niña threshold in February 2026, with a preliminary value (estimated using daily data to the 28th of February) of +1 standard deviation (std). The Equatorial SOI (measuring the difference in atmospheric pressure between the eastern Pacific and Indonesia between 5oN and 5oS) was in the neutral range in February 2026, with a preliminary value of +0.8.
During February 2026, enhanced convection and rainfall (indicated by negative outgoing longwave radiation (OLR) anomalies) were most notable over the Maritime Continent and northern Australia. Positive OLR anomalies, indicating suppressed convection, were recorded over the central and western Pacific. These anomalies were broadly consistent with La Niña conditions. The negative OLR signals across Australia and the Maritime Continent were strongly influenced by an Equatorial Rossby Wave, and the near-coinciding twin-cyclones (Mitchell and Penha) in the first half of the month. Enhanced trade winds (negative zonal wind anomalies) extended from Papua New Guinea to French Polynesia, a larger extent than in January. This is not considered to be a resurgence of La Niña, but is more likely a temporary response to these intraseasonal tropical waves.
Sea surface temperatures (SSTs) in the central equatorial Pacific, as measured by the relative Niño 3.4 Index (RONI*), remained below average during February 2026, but weakened significantly over the course of the month. With an estimated monthly value of –0.67 °C, the index no longer meets the La Niña threshold of –0.7 °C. The relative Niño 1+2 index, in the easternmost equatorial Pacific, has become positive, marking the recent development of a ‘coastal El Niño’ (‘El Niño Costero’), a phenomenon involving localised warming off the South American coast (northern Peru and southern Ecuador). While some Coastal El Niño events precede major basin-wide events (e.g. 1997), others occur completely independently (e.g. 2017).
During February 2026, warmer than average subsurface ocean temperatures in the Pacific continued to expand, intensify and reach the surface, a major factor in the recent weakening of the negative temperature anomalies in the Niño 3.4 index region in the central and eastern Pacific. A large body of warmer (+ 4oC anomalies and above) waters dominate the central and eastern Equatorial Pacific at depths ranging from about 150 m just east of the International Date Line to 50 m east of 120oW. Negative subsurface temperature anomalies have receded farther to east of 100oW. Consistent with these changes, positive upper-ocean heat content anomalies (0–300 m) have expanded eastward to around 100oW.
These recent changes in both the subsurface ocean anomaly structure and the sea surface temperature pattern are consistent with the trend that began last month toward the dissipation of La Niña signals in the Pacific.
In summary, although some lingering La Niña signals were still evident in the tropical Pacific atmosphere during February 2026, trends in the oceanic component of ENSO are consistent with the continued decay of the weak La Niña conditions that persisted through the summer. The atmosphere-ocean system therefore transitioned to ENSO-neutral conditions in February.
The Relative Oceanic Niño Index forecasts indicate a 95% chance for ENSO-neutral conditions persisting over the next three-month period (March – May 2026). The IRI/CPC forecasts, which use a different set of global climate models, also support this outlook. Looking further ahead, global climate models increasingly point toward the development of El Niño conditions in the eastern tropical Pacific later in 2026. Although forecast confidence beyond autumn is typically limited by the seasonal “predictability barrier,” the current state of the ocean – characterised by expanding subsurface warm anomalies and rapidly weakening remaining La Niña markers – provides a higher‑than‑usual level of confidence in an emerging El Niño trajectory.
The Southern Annular Mode (SAM) remained generally positive during February 2026. The current value (to 27 February) for the month of February 2026 is +0.6 std, with about 50% of days exceeding +0.5 std over the same period, but the SAM has recently dipped into negative values. Forecasts suggest the SAM index will return to positive values from the first week of March. It is important to note that SAM forecasts at this time horizon remain uncertain.
The Indian Ocean Dipole (IOD) is currently positive, with a February‑to‑date value of +0.67°C. Forecasts from the Australian Bureau of Meteorology indicate that the IOD is likely to remain positive and strengthen over the forecast period and beyond. This outlook is consistent with early indications of developing El Niño conditions later in the year.
During February 2026, the Madden-Julian Oscillation (MJO), emerged in the Indian Ocean, and slowly propagated eastwards. Interference with an Equatorial Rossby Wave occurred, giving the impression of a stalling signal. This Rossby Wave may have assisted the re-intensification of Severe Tropical Cyclone Mitchell off the Western Australian coast during the second week of the month. The MJO has since resumed eastwards movement, but is now encountering its traditional barrier region around the Maritime Continent. This operates as both a physical barrier, and a modelling challenge; the end result being reduced certainty in MJO propagation and amplitude over the next few weeks.
One plausible outcome is that the MJO does propagate coherently into the western Pacific, leading to an increase in tropical cyclone genesis in the Coral Sea and SW Pacific basin in March. Depending on the configuration of mid-latitude weather patterns at the time, this may also elevate the risk of tropical-sourced airstreams or systems approaching New Zealand. March is approximately the climatological maximum risk period for ex-tropical cyclones to move into our local waters.
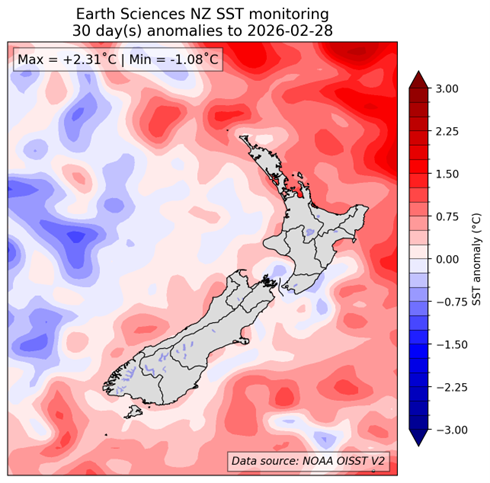
For much of New Zealand, SSTs warmed early in February, peaking in the second week. However, surface wind stress associated with the major depression in mid-February resulted in significant cooling again. Cooler‑than‑average daily SST anomalies are now present off a large portion of the country’s coastlines. Forecasts from coupled ocean-atmosphere models for the next three-month period (see Sea Surface Temperature Update) indicate that SSTs are likely to return to near‑average values around the North Island, while becoming warmer than average again – and potentially intensifying – off the east coast of the South Island.
| North NI | +0.64°C |
| West NI | +0.14°C |
| East NI | +0.35°C |
| North SI | +0.16°C |
| West SI | +0.37°C |
| East SI | +0.22°C |
*The Relative Oceanic Niño 3.4 Index (RONI) is a modern way of measuring oceanic El Niño and La Niña that is complementary to traditional oceanic indices. While traditional oceanic indices like the Niño 3.4 Index monitor SSTs in one region, the RONI compares the average SST in the central equatorial Pacific with the average SST across the global tropics. Since tropical rainfall patterns respond to changes in ocean temperatures, this new relative index can help forecasters better determine if the equatorial Pacific is warmer or cooler than the rest of the global tropics, which has become more challenging to discern as seas warm because of climate change.
Forecast Confidence
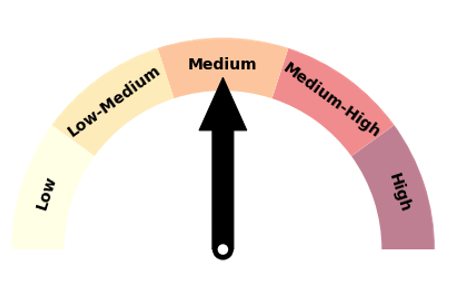
Temperature
Forecast confidence for temperatures is Medium. Onshore airflows should continue to occasionally suppress daytime temperatures in eastern regions, and potentially warm western areas. The anticipated lack of northwest conditions means hot days may be relatively infrequent nationwide.
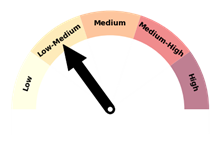
Rainfall
Forecast confidence for rainfall is Low-Medium, as it was during summer. The country remains susceptible to occasional rainmakers from the north throughout autumn, but rainfall from such systems tends to exhibit a “boom or bust” pattern, which reduces confidence.
