Outlook Summary
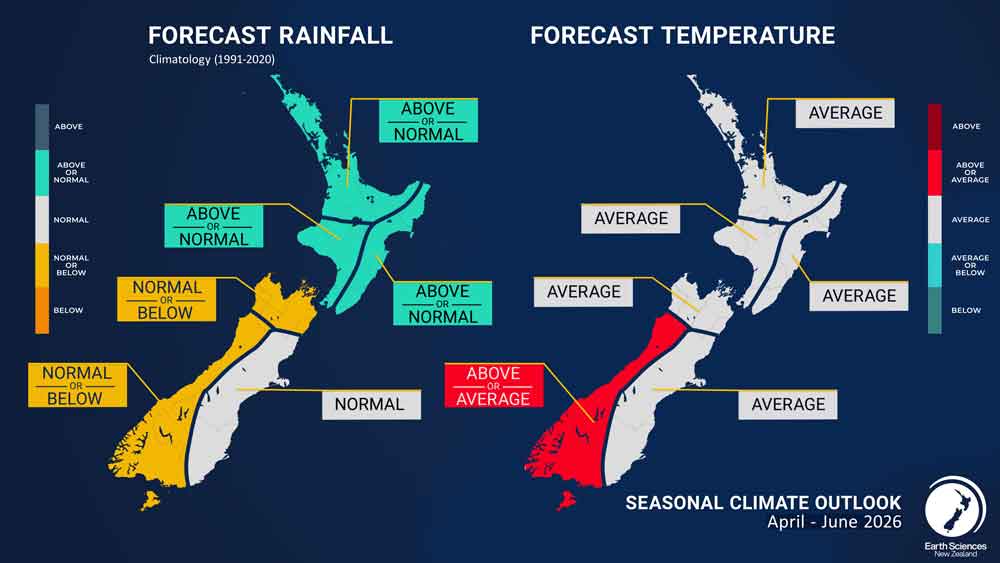
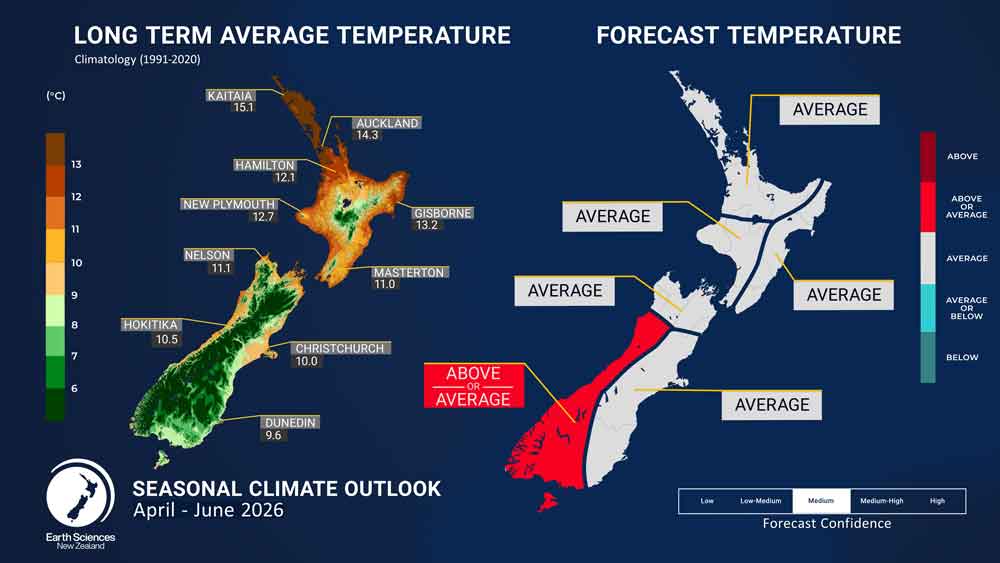
- Seasonal air temperatures for April – June 2026 are most likely to be near average for all regions of New Zealand with the exception of the west of the South Island, where near average or above average temperatures are about equally likely. Cold snaps may be more common in the latter part of the outlook period.
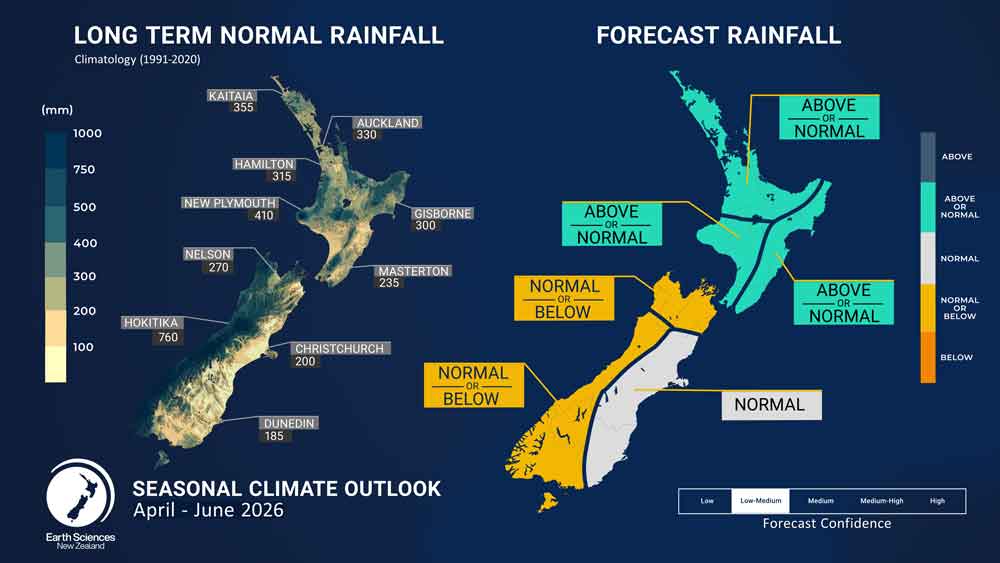
- Rainfall totals for April – June 2026 are about equally likely to be near normal or above normal across all regions of the North Island. There is an elevated risk of heavy rain events and flooding, particularly during April. In the west and north of the South Island, rainfall amounts are expected to be near normal or below normal, while near normal totals are favoured in the east of the South Island. Nationally, the risk of drier than normal conditions is expected to increase as the season progresses.
- During April – June 2026, near normal soil moisture levels and river flows are expected for all regions of the North Island as well as the east of the South Island. For the north and west of the South Island, near normal or below normal soil moisture levels and river flows are about equally likely for the next three month period as a whole.
- Easterly‑quarter flow anomalies are expected at the beginning of the outlook period, accompanied by an elevated risk of heavy rainfall events linked to sub-tropical or tropical influences. Later in the outlook period, air flow patterns are expected to favour a more southeasterly direction, then southwesterly air flows, characteristic of El Niño conditions, potentially emerging towards the end of the three‑month period.
- The 2025-2026 Southwest Pacific tropical cyclone (TC) season will officially conclude at the end of April. The Tropical Cyclone Outlook for the season indicates a normal or elevated risk for ex-TC interaction for New Zealand. The risk for tropical cyclone development continues early in upcoming three month period. After a quiet start to the year, the increase in tropical activity over the last month is set to persist through April.
- Neutral El Niño–Southern Oscillation (ENSO) conditions are currently present in the tropical Pacific, although the atmosphere continues to exhibit lingering influences from the weak La Niña conditions experienced during summer.
- Subsurface ocean temperature anomalies in the Pacific are increasingly supportive of the development of a potentially significant El Niño event later this year.
- There is about an 85% chance for ENSO-neutral conditions to remain in the Tropical Pacific over the forecast period (April – June 2026).
- Later in the year, El Niño conditions become increasingly likely, with the probability of emergence rising to around 80% for June - August 2026.
- The next three‑month period is expected to reflect ongoing weakening of La Niña influence, with a gradual shift toward more El Niño‑like conditions.
Regional predictions for April – June 2026
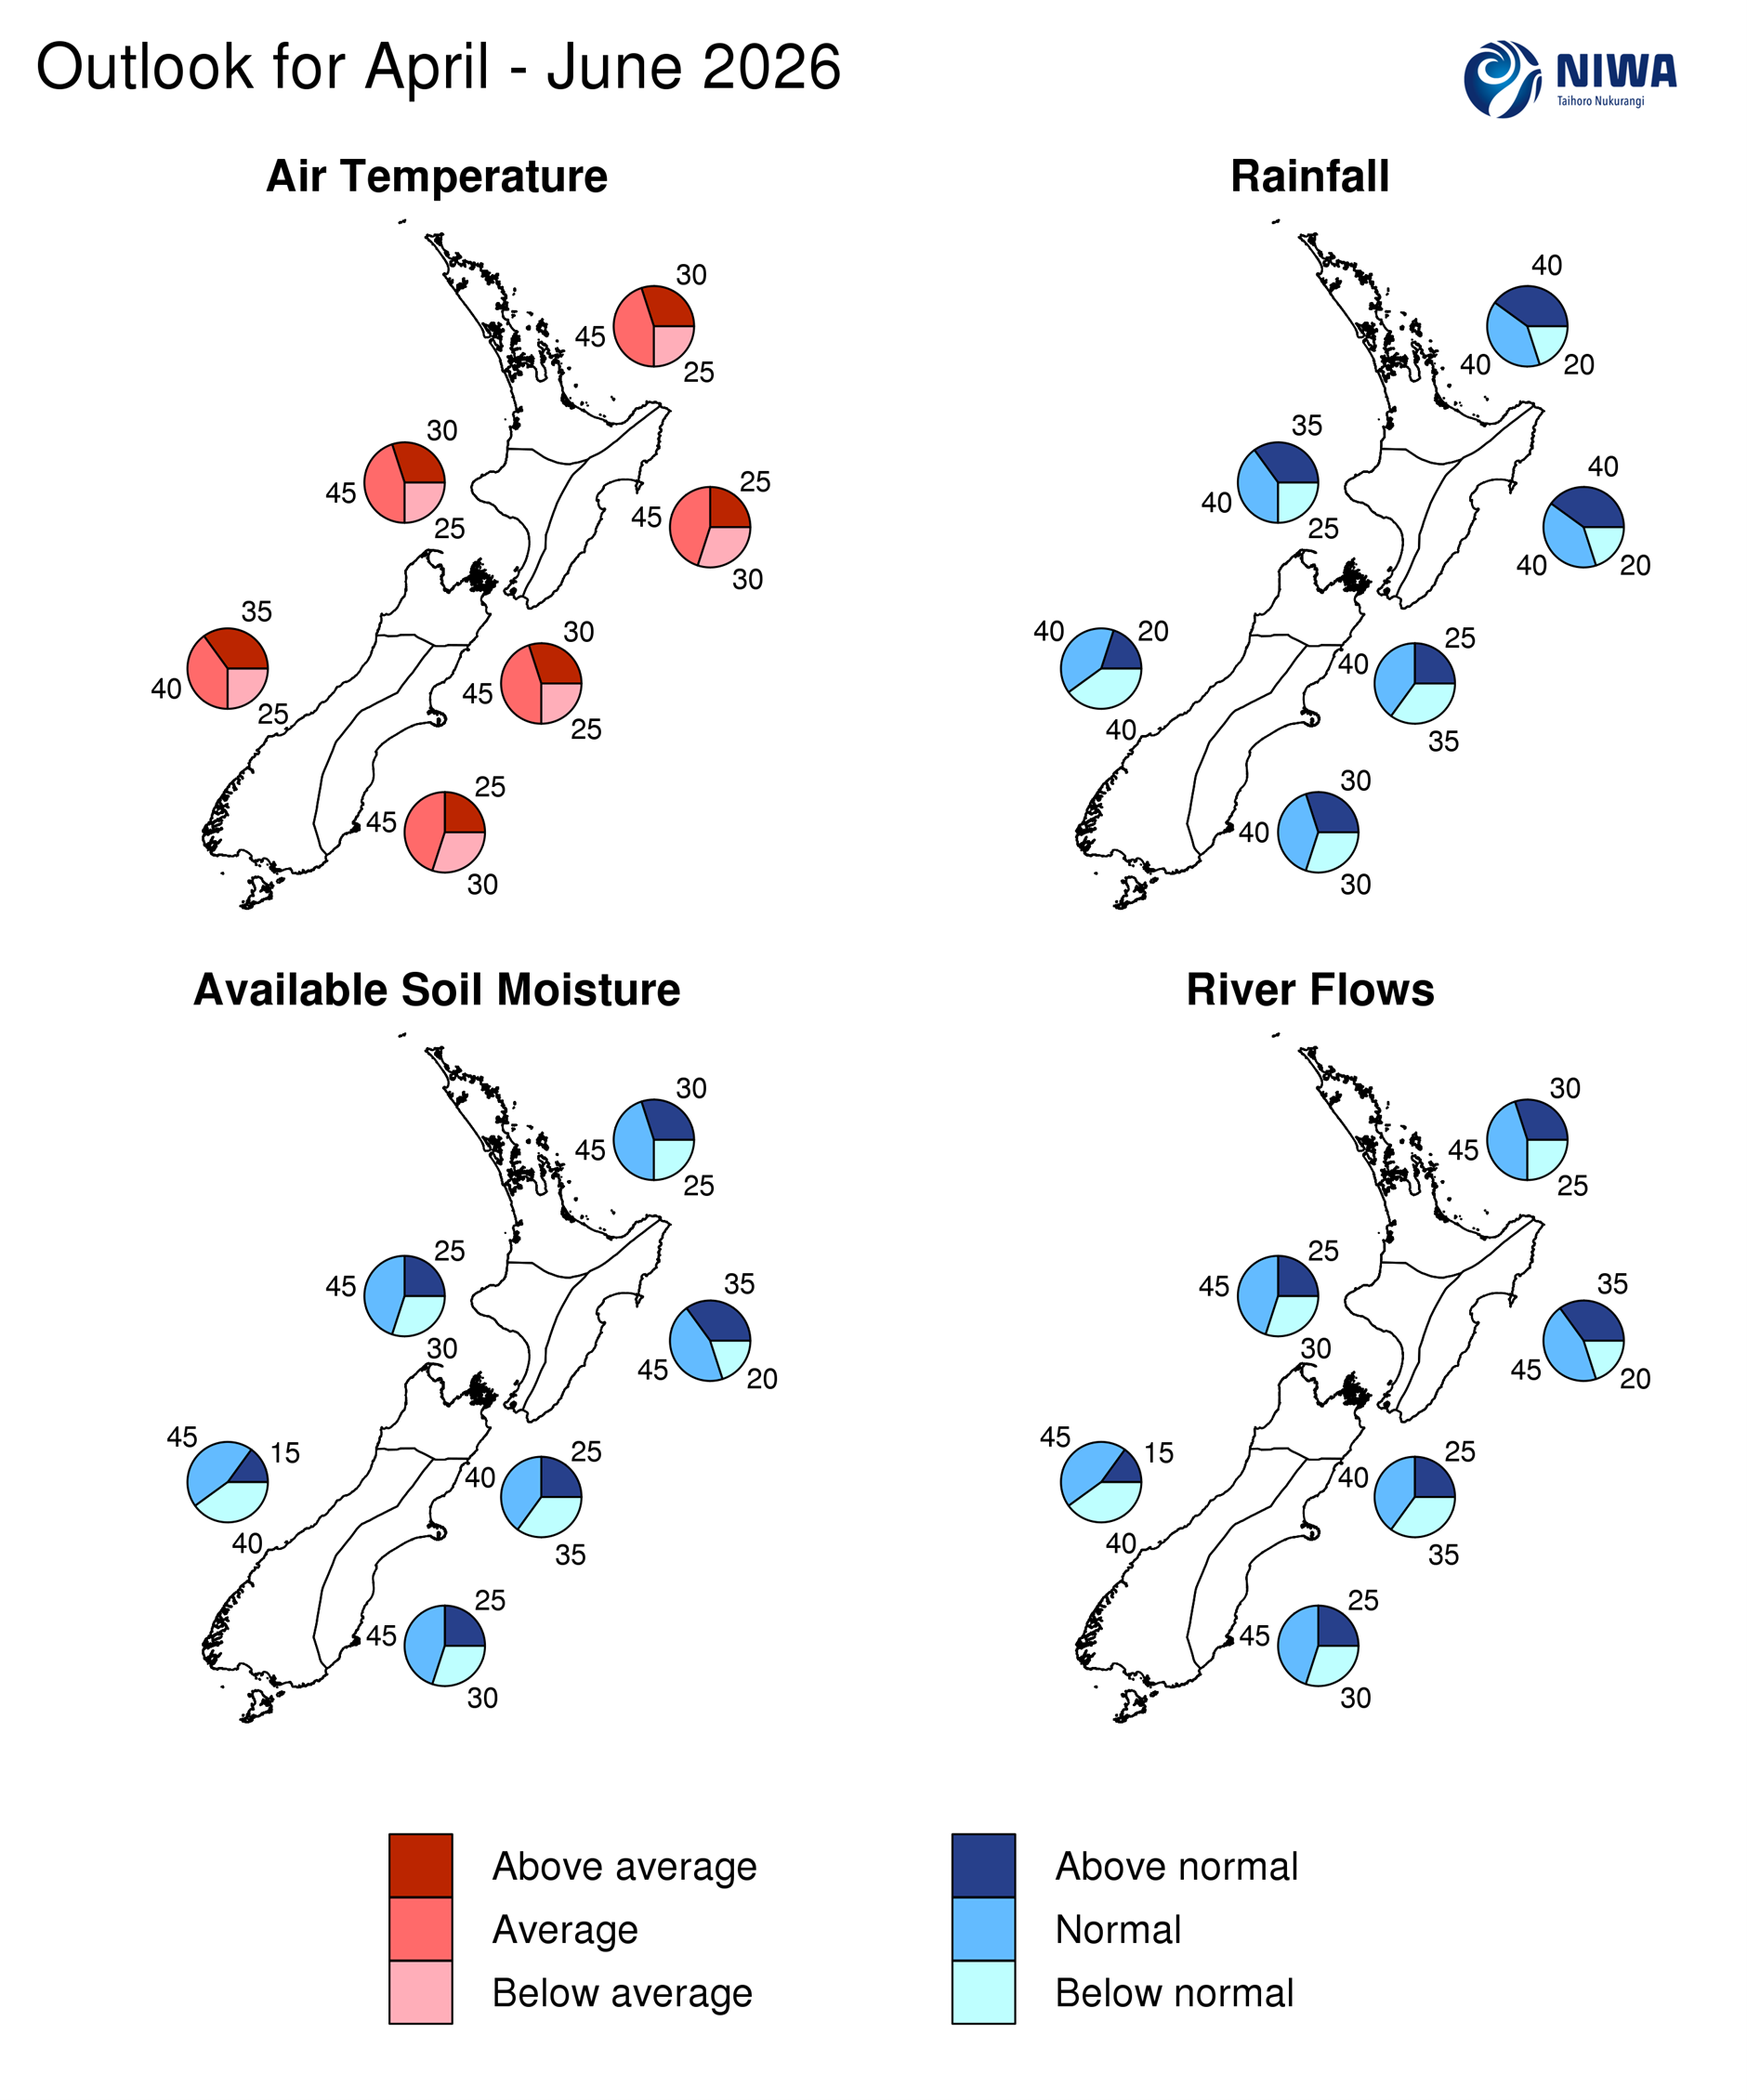
The tables below show the probabilities (or percent chances) for each of three categories: above average, near average, and below average. In the absence of any forecast guidance there would be an equal likelihood (33% chance) of the outcome for any of the three categories. Forecast information from local and global guidance models is used to indicate the deviation from equal chance that is expected for the coming three-month period. All outlooks are for the three months averaged as a whole. During these three months, there will inevitably be relatively wet and dry periods, as well as hot and cold periods. The exact range in temperature and rainfall within each of the three categories varies with location and season. However, as a guide, the “near average” or middle category for the temperature predictions includes deviations up to ±0.5°C relative to the long-term mean, whereas for rainfall the “near normal” category lies between 80 percent and 120 percent of the long-term (1991-2020) mean.
Northland, Auckland, Waikato, Bay of Plenty
- Temperatures are most likely to be near average (45% chance).
- Rainfall totals are equally likely to be above normal (40% chance) or near normal (40% chance). There is an elevated risk of heavy rainfall events associated with subtropical or tropical influences, chiefly early in the outlook period.
- Soil moisture levels and river flows are most likely to be near normal (45% chance).
| Temperature | Rainfall | Soil moisture | River flows | |
| Above average | 30 | 40 | 30 | 30 |
| Near average | 45 | 40 | 45 | 45 |
| Below average | 25 | 20 | 25 | 25 |
Central North Island, Taranaki, Whanganui, Manawatu, Wellington
Probabilities are assigned in three categories: above average, near average, and below average.
- Temperatures are most likely to be near average (45% chance).
- Rainfall totals are about equally likely to be near normal (40% chance) or above normal (35% chance).
- Soil moisture levels and river flows are most likely to be near normal (45% chance).
| Temperature | Rainfall | Soil moisture | River flows | |
| Above average | 30 | 35 | 25 | 25 |
| Near average | 45 | 40 | 45 | 45 |
| Below average | 25 | 25 | 30 | 30 |
Gisborne, Hawke’s Bay, Wairarapa
Probabilities are assigned in three categories: above average, near average, and below average.
- Temperatures are most likely to be near average (45% chance).
- Rainfall amounts for April – June are equally likely to be above normal (40% chance) or near normal (40% chance). There is an elevated risk of heavy rainfall events associated with subtropical or tropical influences, chiefly early in the outlook period.
- Soil moisture levels and river flows are most likely to be near normal (45% chance).
| Temperature | Rainfall | Soil moisture | River flows | |
| Above average | 25 | 40 | 35 | 35 |
| Near average | 45 | 40 | 45 | 45 |
| Below average | 30 | 20 | 20 | 20 |
Tasman, Nelson, Marlborough, Buller
Probabilities are assigned in three categories: above average, near average, and below average.
- Temperatures are most likely to be near average (45% chance).
- Rainfall totals are about equally likely to be near normal (40% chance) or below normal (35% chance).
- Soil moisture levels and river flows are about equally likely to be near normal (40% chance) or below normal (35% chance).
| Temperature | Rainfall | Soil moisture | River flows | |
| Above average | 30 | 25 | 25 | 25 |
| Near average | 45 | 40 | 40 | 40 |
| Below average | 25 | 35 | 35 | 35 |
West Coast, Southern Alps and foothills, inland Otago, Southland
Probabilities are assigned in three categories: above average, near average, and below average.
- Temperatures are about equally likely to be near average (40% chance) or above average (35% chance).
- Rainfall totals are equally likely to be below normal (40% chance) or near normal (40% chance).
- Soil moisture levels and river flows are about equally likely to be near normal (45% chance) or below normal (40% chance).
| Temperature | Rainfall | Soil moisture | River flows | |
| Above average | 35 | 20 | 15 | 15 |
| Near average | 40 | 40 | 45 | 45 |
| Below average | 25 | 40 | 40 | 40 |
Coastal Canterbury and the nearby plains, east Otago
Probabilities are assigned in three categories: above average, near average, and below average.
- Temperatures are most likely to be near average (45% chance).
- Rainfall totals are most likely to be near normal (40% chance) although the near even spread of probabilities indicates notable forecast uncertainty.
- Soil moisture levels and river flows are most likely to be near normal (45% chance).
The full probability breakdown is:
| Temperature | Rainfall | Soil moisture | River flows | |
| Above average | 25 | 30 | 25 | 25 |
| Near average | 45 | 40 | 45 | 45 |
| Below average | 30 | 30 | 30 | 30 |
Background
The Southern Oscillation Index (SOI) increased in March 2026 and just crossed the official La Niña threshold, with a monthly value of +1.02 (estimated using data through 30 March). This reflects lingering weak La Niña‑like atmospheric conditions; however, short‑term intraseasonal variability played a significant role in pushing the SOI into La Niña territory. Looking ahead, atmospheric signals are expected to more closely align with ENSO‑neutral conditions over the outlook period.
In contrast, the Equatorial Southern Oscillation Index,which measures the pressure difference between the eastern and western equatorial Pacific, remained within the neutral range, with the most recent available daily values (through 17 March) being negative, placing the index on the El Niño side of neutral.
Sea surface temperatures (SSTs) in the central equatorial Pacific continued to weaken (i.e. to become less negative) and the relative Niño 3.4 Index (RONI*) value for the past 30 days (to the 30th of March) is -0.54oC (i.e. in the neutral range). The relative Niño 1+2 index, in the easternmost equatorial Pacific, remained positive in March 2026, but weakened recently.
During March 2026, warmer than average subsurface ocean temperatures in the Pacific continued to intensify, both in the far eastern Pacific near the surface (east of about 120oW) and around the International Date Line at about 100m depth, with anomalies exceeding +5oC locally. Positive upper-ocean heat content anomalies (0–300 m) are now present all along the Equator in the Pacific.
The eastward expansion and intensification of warmer‑than‑average subsurface ocean waters are consistent with conditions increasingly favouring the development of a potentially significant El Niño event later this year.
Rainfall and Convection: During March 2026, enhanced convection and rainfall - indicated by negative outgoing longwave radiation (OLR) anomalies - were most notable over the central and eastern Maritime Continent, and northern Australia once again. Periodically, these negative anomalies also extended significantly away from the equator at other longitudes, for example into the South Pacific Convergence Zone (SPCZ) and Hawaii regions, suggestive of coherent Rossby Wave transport out of the tropical regions. Positive OLR anomalies, indicating suppressed convection, were recorded over the central and eastern Pacific, and gradually across the Indian Ocean and western Maritime Continent as the month progressed. These anomalies were broadly consistent with La Niña conditions, along with contributions from intraseasonal waves – primarily the MJO and Equatorial Rossby Waves (ERW). Yet again, an ERW led to twin cyclone formation (Narelle and Nuri) in the middle of the month. This behaviour has been a feature of 2026 and is expected to repeat early this month.
Enhanced trade winds (negative zonal wind anomalies) covered the majority of the equatorial Pacific early in March, but weakened dramatically later in the month as westerly anomalies developed. Trade winds now appear weaker than they have for most of the last six months.
In summary, although La Niña patterns were still evident in some atmospheric indicators during March 2026, oceanic conditions are setting the stage for the development of El Niño later this year, with particularly significant warmth (positive heat content anomalies) stored in the ocean along the Equator in the Pacific.
The Relative Oceanic Niño Index forecasts indicate an 84% chance for ENSO-neutral conditions over the next three month period (April – June 2026). The IRI/CPC forecasts also support this outlook. Looking further ahead, global climate models increasingly point toward the development of El Niño conditions in the eastern tropical Pacific later in 2026, with the probability for El Niño to emerge by June – August reaching about 80%. The projected magnitude of the sea surface temperature anomalies suggests that, should El Niño develop, it has the potential to be a strong event, comparable to some of the largest El Niño events on record.
The Southern Annular Mode (SAM) remained generally positive during March 2026. The current value (to 29 March) for the month of March 2026 is +0.5 standard deviations (std), with about 70% of days exceeding +0.5 std over the same period. Forecasts suggest the SAM index will become momentarily negative at the beginning of April 2026 and then return to neutral or positive values.
The Indian Ocean Dipole (IOD) value for March 2026 (month to date value, using data to 30 March) is close to zero (+0.06°C) but daily values recently became negative. Forecasts from the Australian Bureau of Meteorology indicate that the IOD is likely to return to positive values overall over the next three-month period.
During March 2026, the Madden-Julian Oscillation (MJO) was slow-moving in the higher phases, associated with enhanced convection from Australia through the western Pacific. Its amplitude was variable, due to a combination of occasional interference with other waves, and the RMM index not necessarily detecting the MJO as well as in other situations. Six notable tropical lows formed this month across the Australian and Pacific basins, though only one was named as a cyclone – Narelle.
Early in April, an Equatorial Rossby Wave is likely to be the dominant wave, but the MJO should re-emerge again. Model variation is typical for MJO forecasts, but in this case the variability in speed across models is dramatic. If fast propagation occurs, it could lead to a brief chance of tropical cyclone genesis in the Indian Ocean later this week, before moving to assist with cyclone genesis potential near Vanuatu or the Solomon Islands after Easter. This second system could pose a threat to New Zealand. Later in April, the MJO then may move into the Western Hemisphere, which can promote a period of westerlies over the country ahead of further high-pressure systems.
Any further MJO pulses may not occur until May, by which time the link to New Zealand weather patterns begins to change.
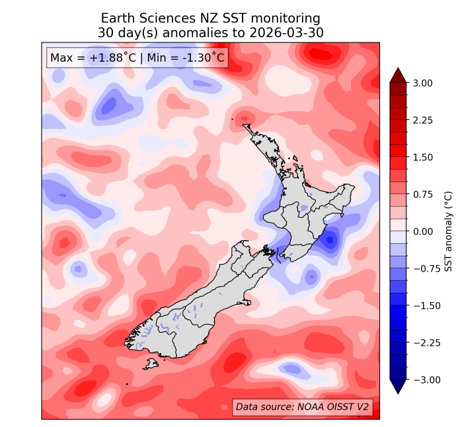
Local Sea Surface Temperature (SSTs) remained cooler than average for the month of March along the east and west coasts of the North Island and in the Cook Strait but are generally warmer than average around the South Island. Forecasts from coupled ocean-atmosphere models for the next three-month period (see Sea Surface Temperature Update) indicate SSTs are likely to return to near‑average values around the North Island, while continuing to warm around the South Island, particularly off the east coast.
| North NI | +0.22°C |
| West NI | -0.53°C |
| East NI | -0.33°C |
| North SI | -0.11°C |
| West SI | +0.78°C |
| East SI | +0.40°C |
[*]The Relative Oceanic Niño 3.4 Index (RONI) is a modern way of measuring oceanic El Niño and La Niña that is complementary to traditional oceanic indices. While traditional oceanic indices like the Niño 3.4 Index monitor SSTs in one region, the RONI compares the average SST in the central equatorial Pacific with the average SST across the global tropics. Since tropical rainfall patterns respond to changes in ocean temperatures, this new relative index can help forecasters better determine if the equatorial Pacific is warmer or cooler than the rest of the global tropics, which has become more challenging to discern as seas warm because of climate change.
Forecast Confidence
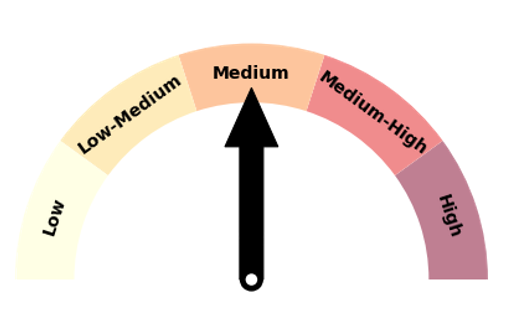
Temperature
Forecast confidence for temperatures is Medium. Onshore airflows should continue to occasionally supress daytime temperatures in eastern regions and potentially warm western areas. A change in dominant weather patterns is expected in winter, which also reduces confidence.
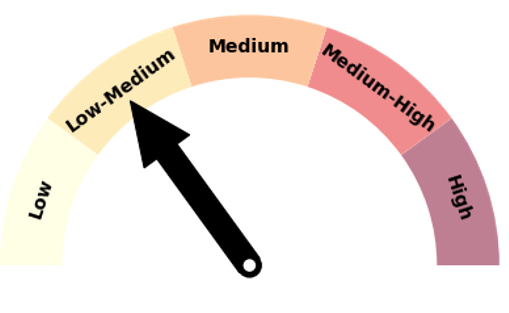
Rainfall
Forecast confidence for rainfall is Low-Medium, as it has been during recent outlooks. The country will remain susceptible to occasional rainmakers from the north for part of the period. The “boom or bust” pattern associated with these events reduces confidence. Later in the outlook a change of rainfall patterns is expected, but the timing of this is uncertain.
