Outlook Summary
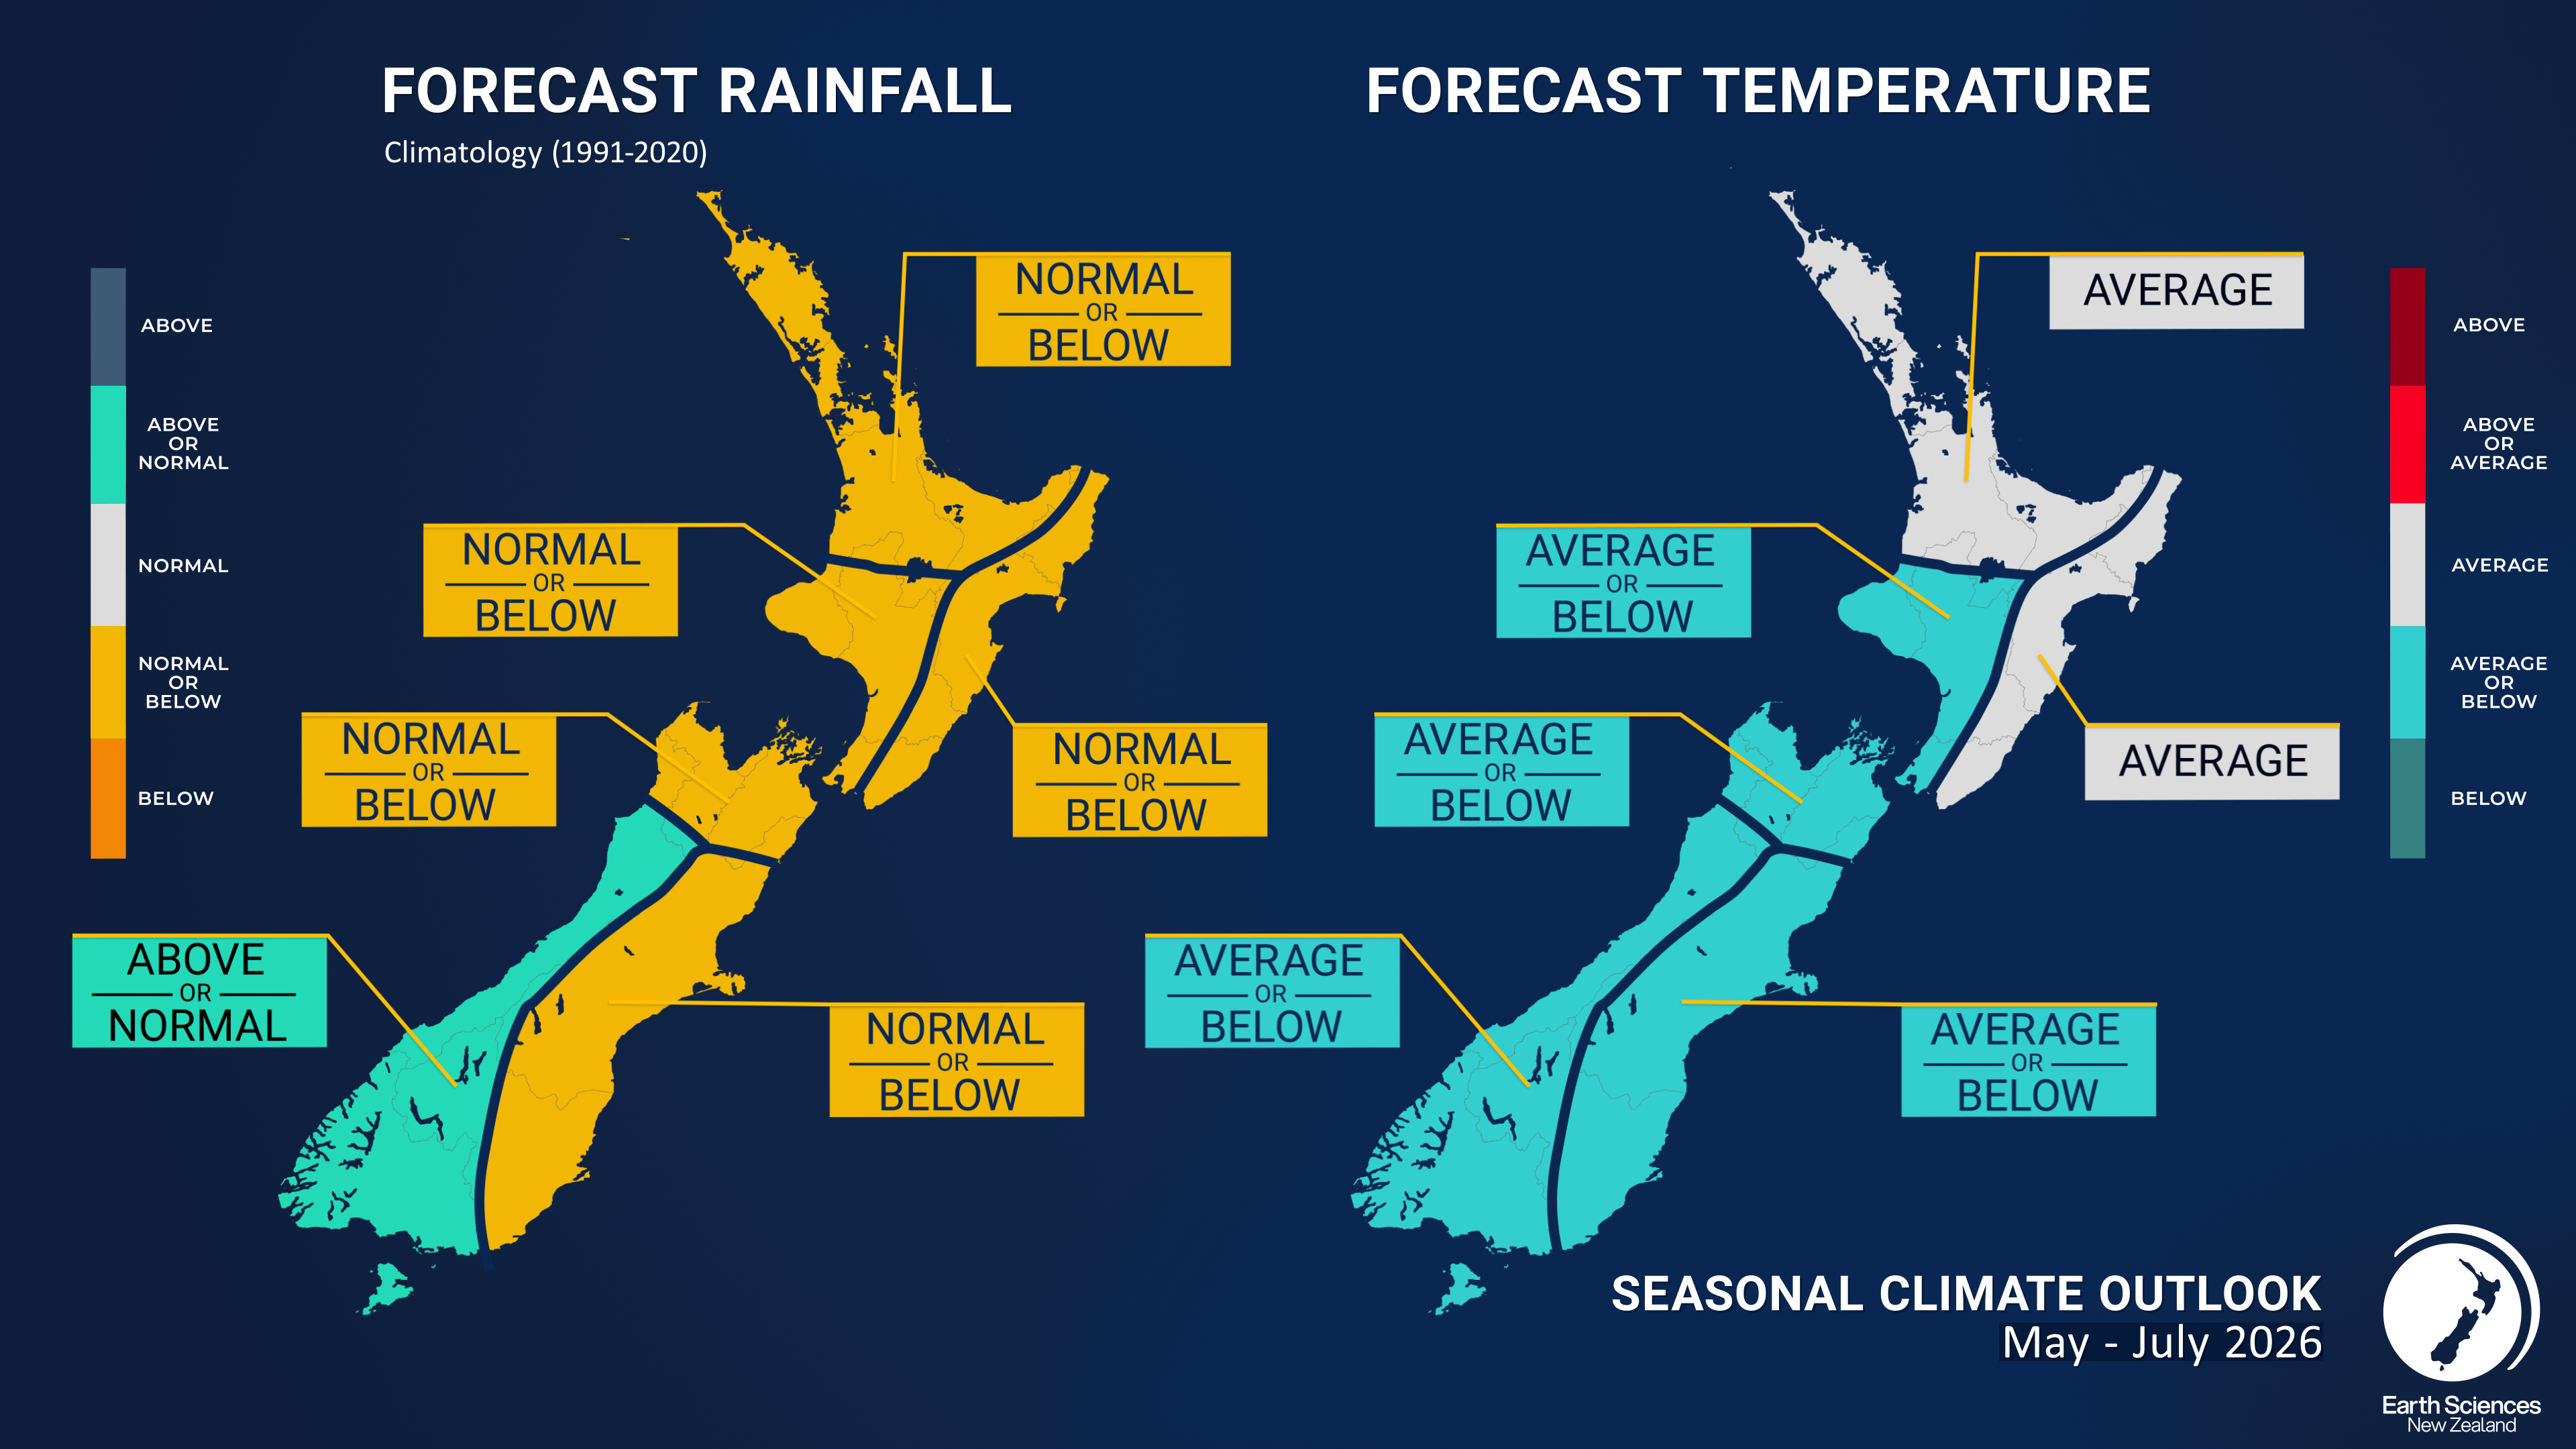
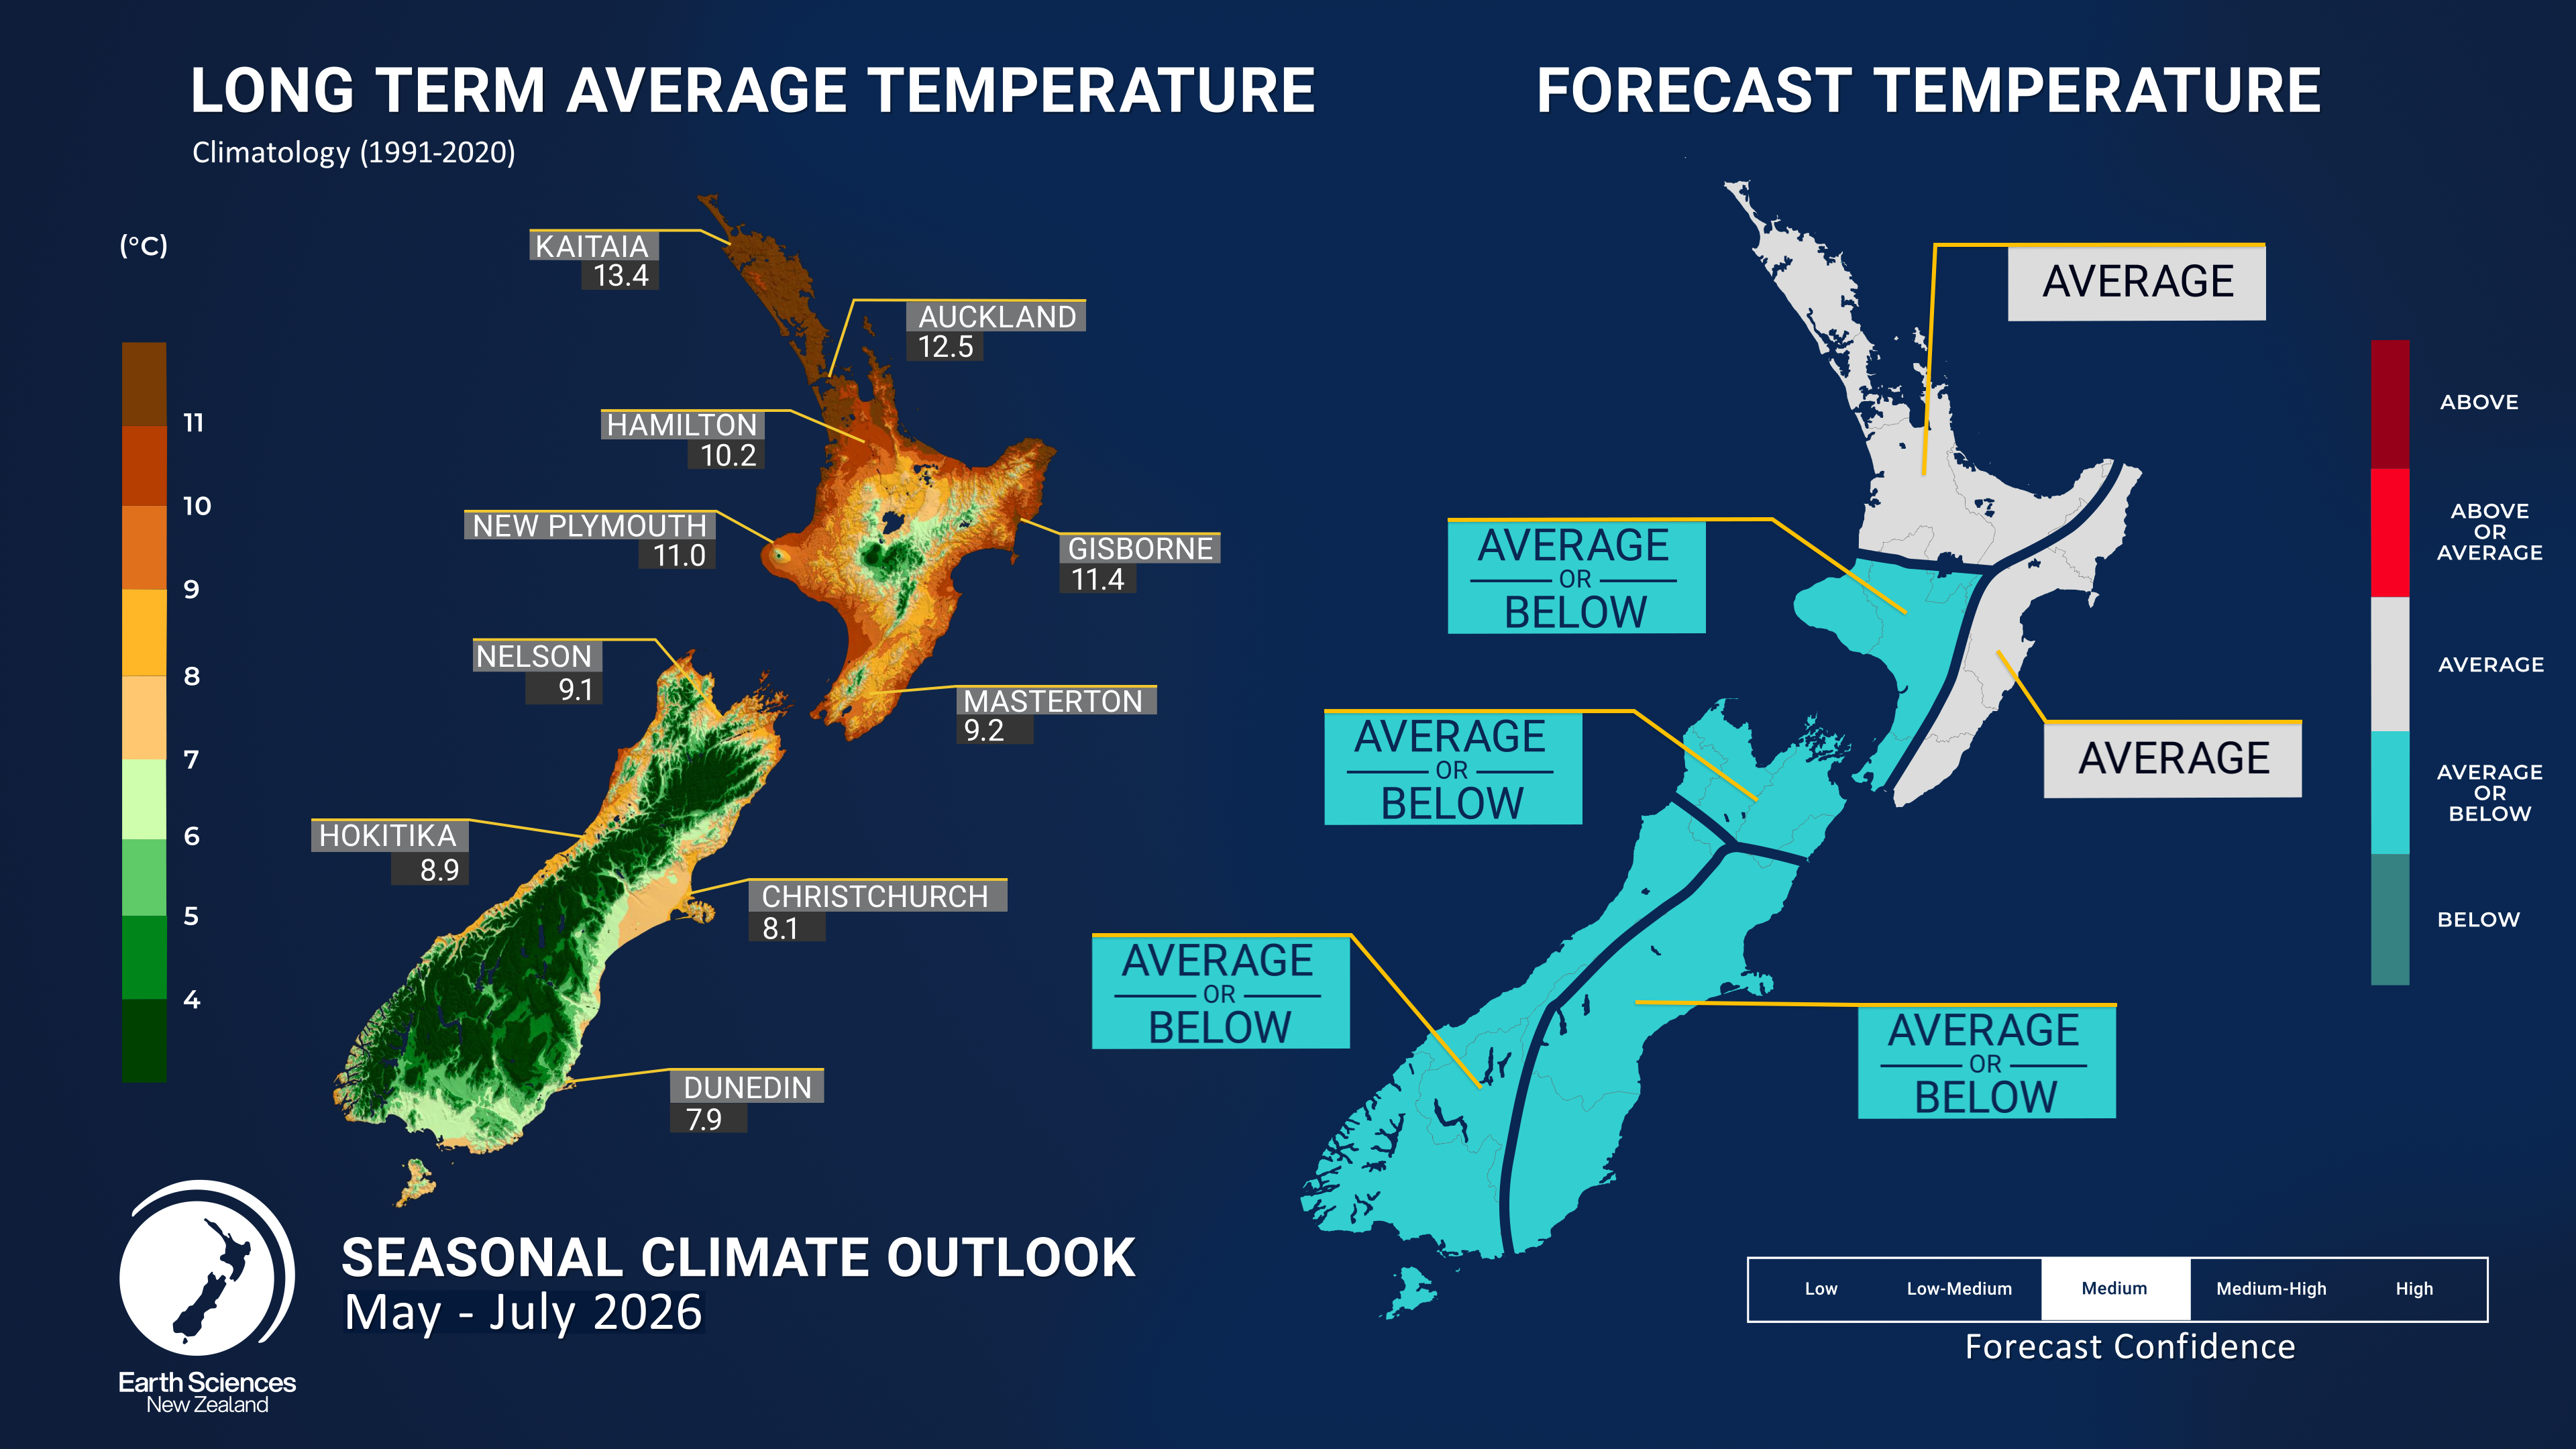
- Seasonal air temperatures for May – July 2026 are about equally likely to be near average or below average in the South Island and the west of the North Island, and near average in the north and east of the North Island. Occasional cold snaps are possible, especially under persistent high pressure where fog, frost, and cold nighttime temperatures could occur.
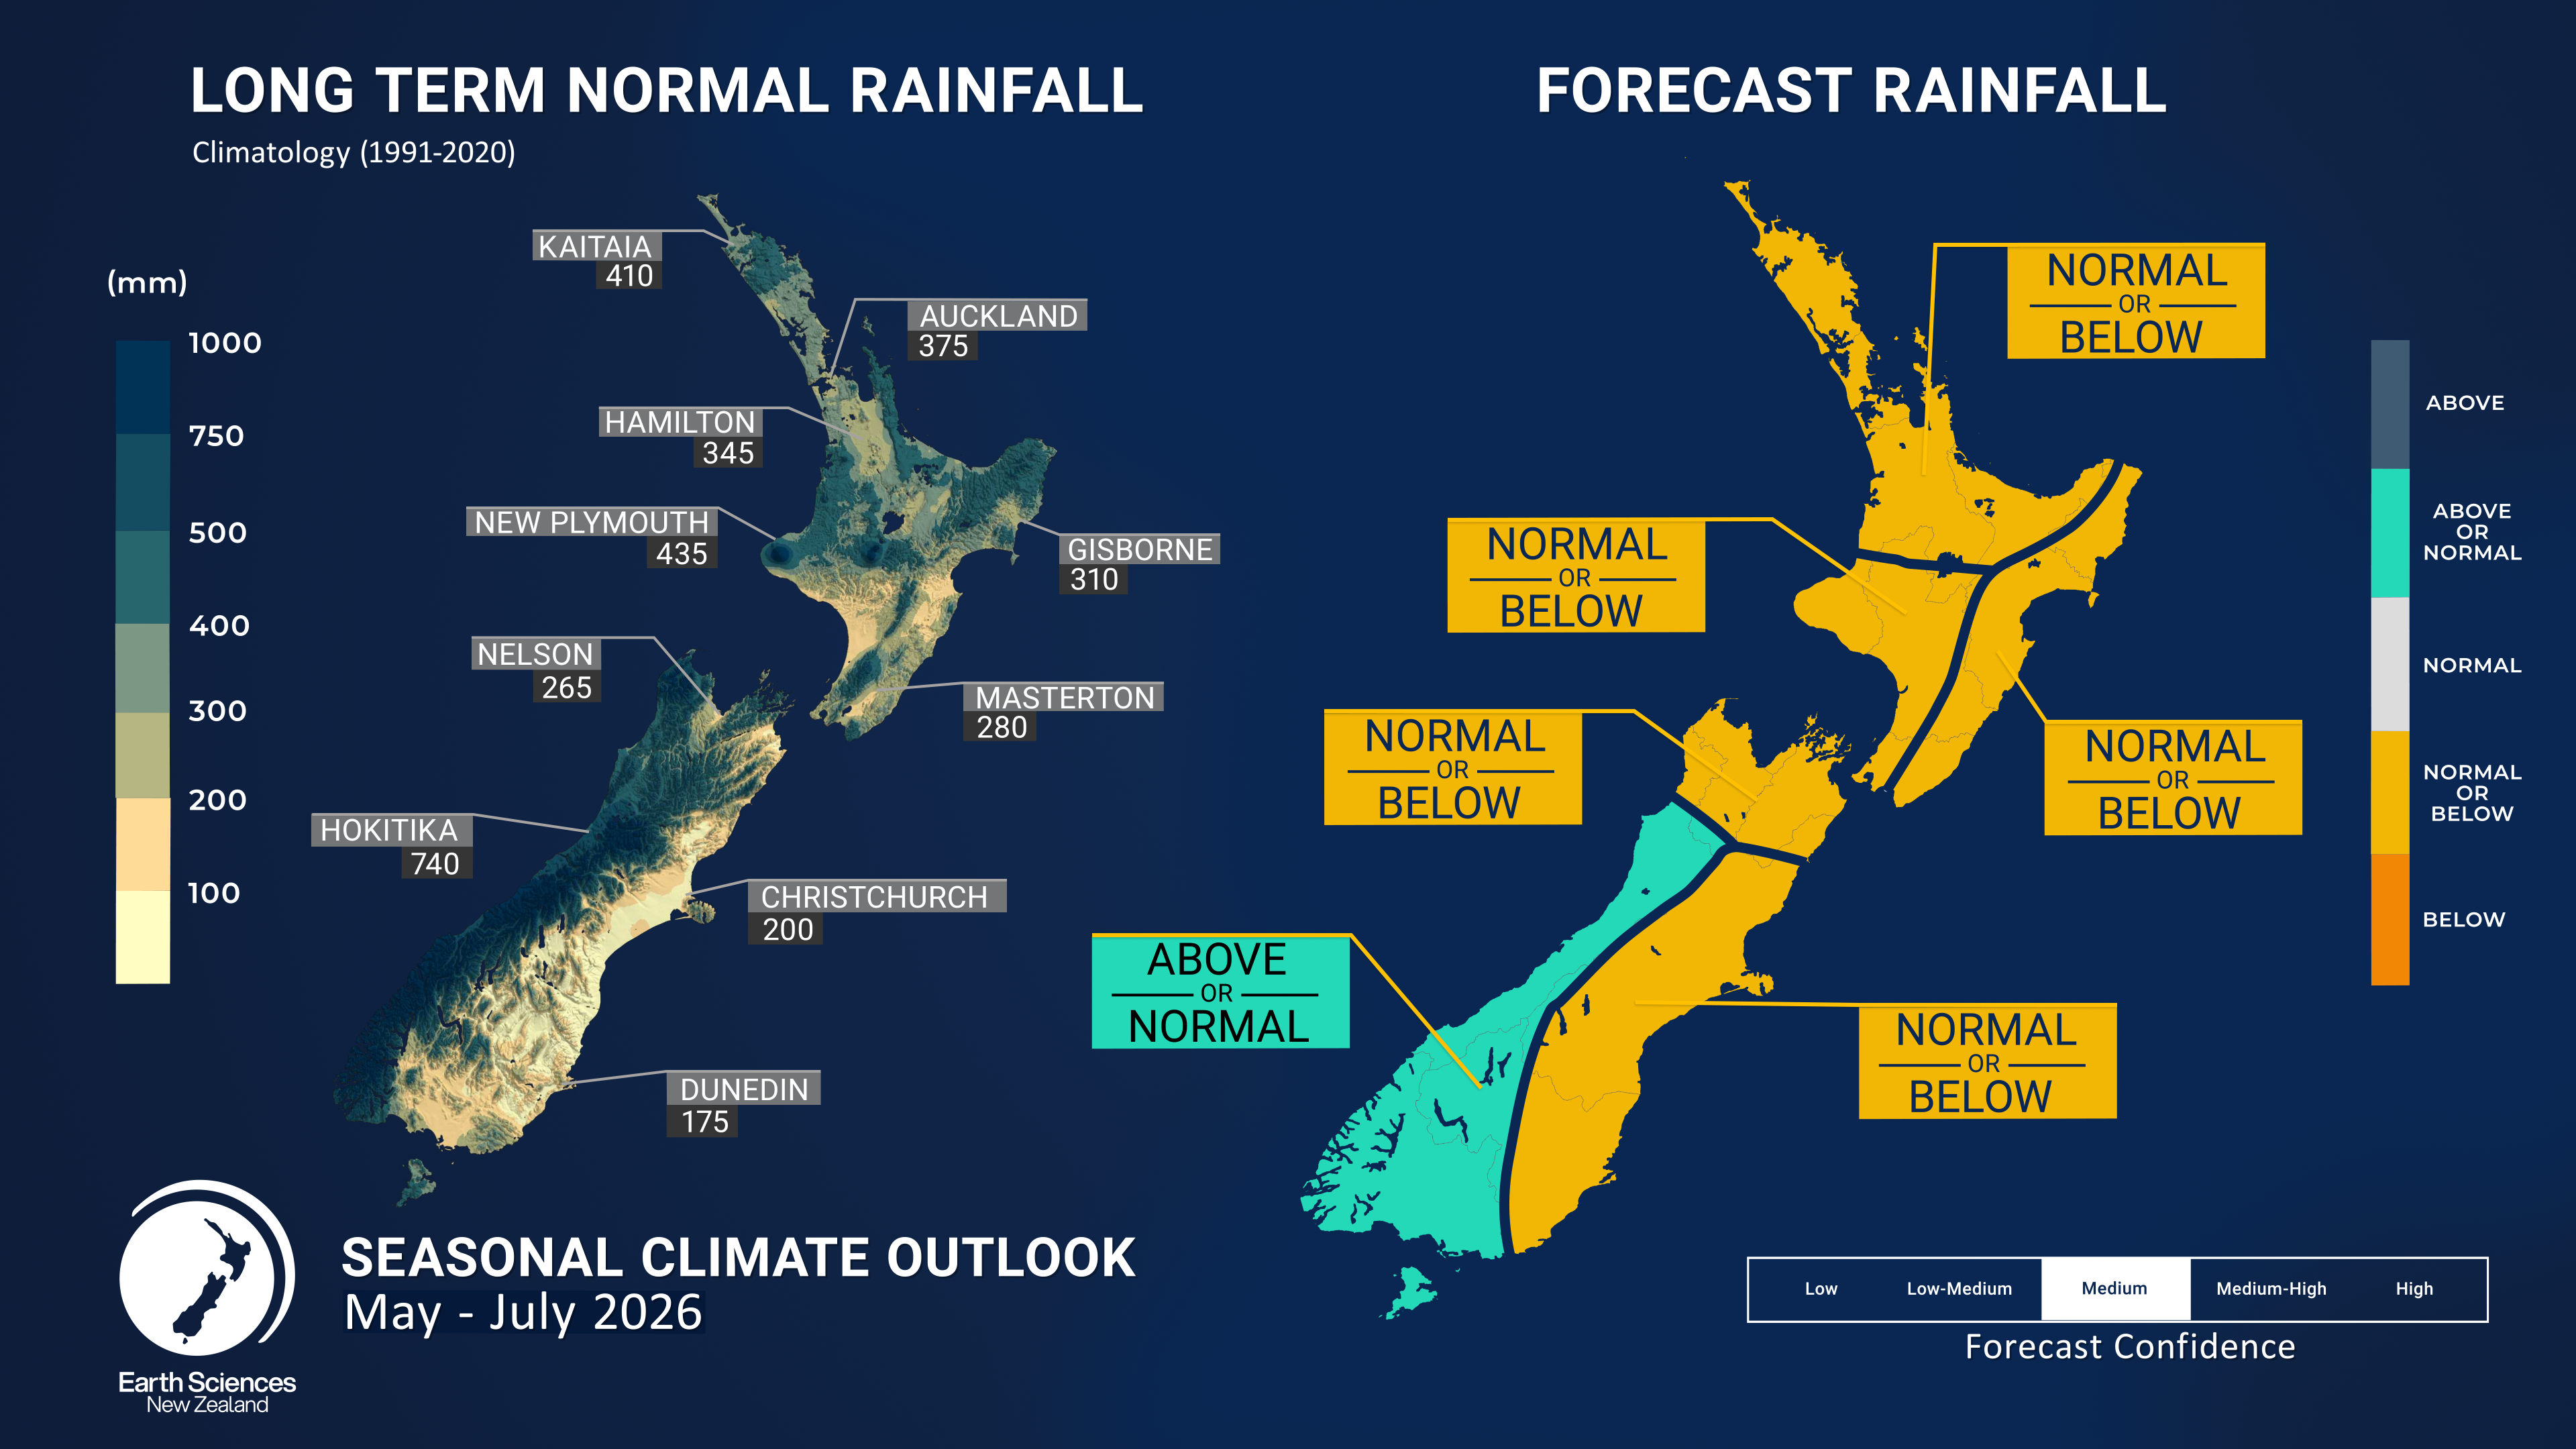
- Rainfall totals for May – July 2026 are about equally likely to be near normal or below normal for all regions of the country, except for the west of the South Island, where near normal or above normal rainfall totals for the season are equally likely. The risk of drier than normal conditions is expected to increase as the season progresses.
- During May – July 2026, soil moisture levels and river flows are expected to be near normal or below normal for the east and north of the South Island. Near normal soil moisture levels and river flows are most likely for the west of the North Island and the west of the South Island. In the east and north of the North Island, soil moisture levels are expected to be near normal or below normal, while river flows are most likely to be near normal.
- Southerly‑quarter air flow anomalies are expected at the beginning of the outlook period due to strong high-pressure systems approaching from the west. Air flow patterns are expected to tend towards a southwesterly flow anomaly, characteristic of El Niño conditions, towards the end of the three‑month period.
- Neutral El Niño–Southern Oscillation (ENSO) conditions are currently present in the tropical Pacific; however, the coupled ocean–atmosphere system is showing signs of a rapid transition toward El Niño.
- Warm subsurface ocean temperature anomalies have continued to intensify and expand in the tropical Pacific, consistent with an ongoing transition toward El Niño and raising the potential for a significant event.
- There is about a 65% chance for El Niño conditions to emerge over the forecast period (May – July 2026).
- El Niño–related influences on regional weather patterns are expected to become more apparent as the season progresses and ENSO signals strengthen.
- Peak El Niño conditions are expected to occur during the austral summer of 2026–27, with the potential for this event to have significant impacts (see From our forecasters: Winter 2026 may see the start of a formidable El Niño event).
Regional predictions for May – July 2026
The tables below show the probabilities (or percent chances) for each of three categories: above average, near average, and below average. In the absence of any forecast guidance there would be an equal likelihood (33% chance) of the outcome for any of the three categories. Forecast information from local and global guidance models is used to indicate the deviation from equal chance that is expected for the coming three-month period. All outlooks are for the three months averaged as a whole. During these three months, there will inevitably be relatively wet and dry periods, as well as hot and cold periods. The exact range in temperature and rainfall within each of the three categories varies with location and season. However, as a guide, the “near average” or middle category for the temperature predictions includes deviations up to ±0.5°C relative to the long-term mean, whereas for rainfall the “near normal” category lies between 80 percent and 120 percent of the long-term (1991-2020) mean.
Northland, Auckland, Waikato, Bay of Plenty
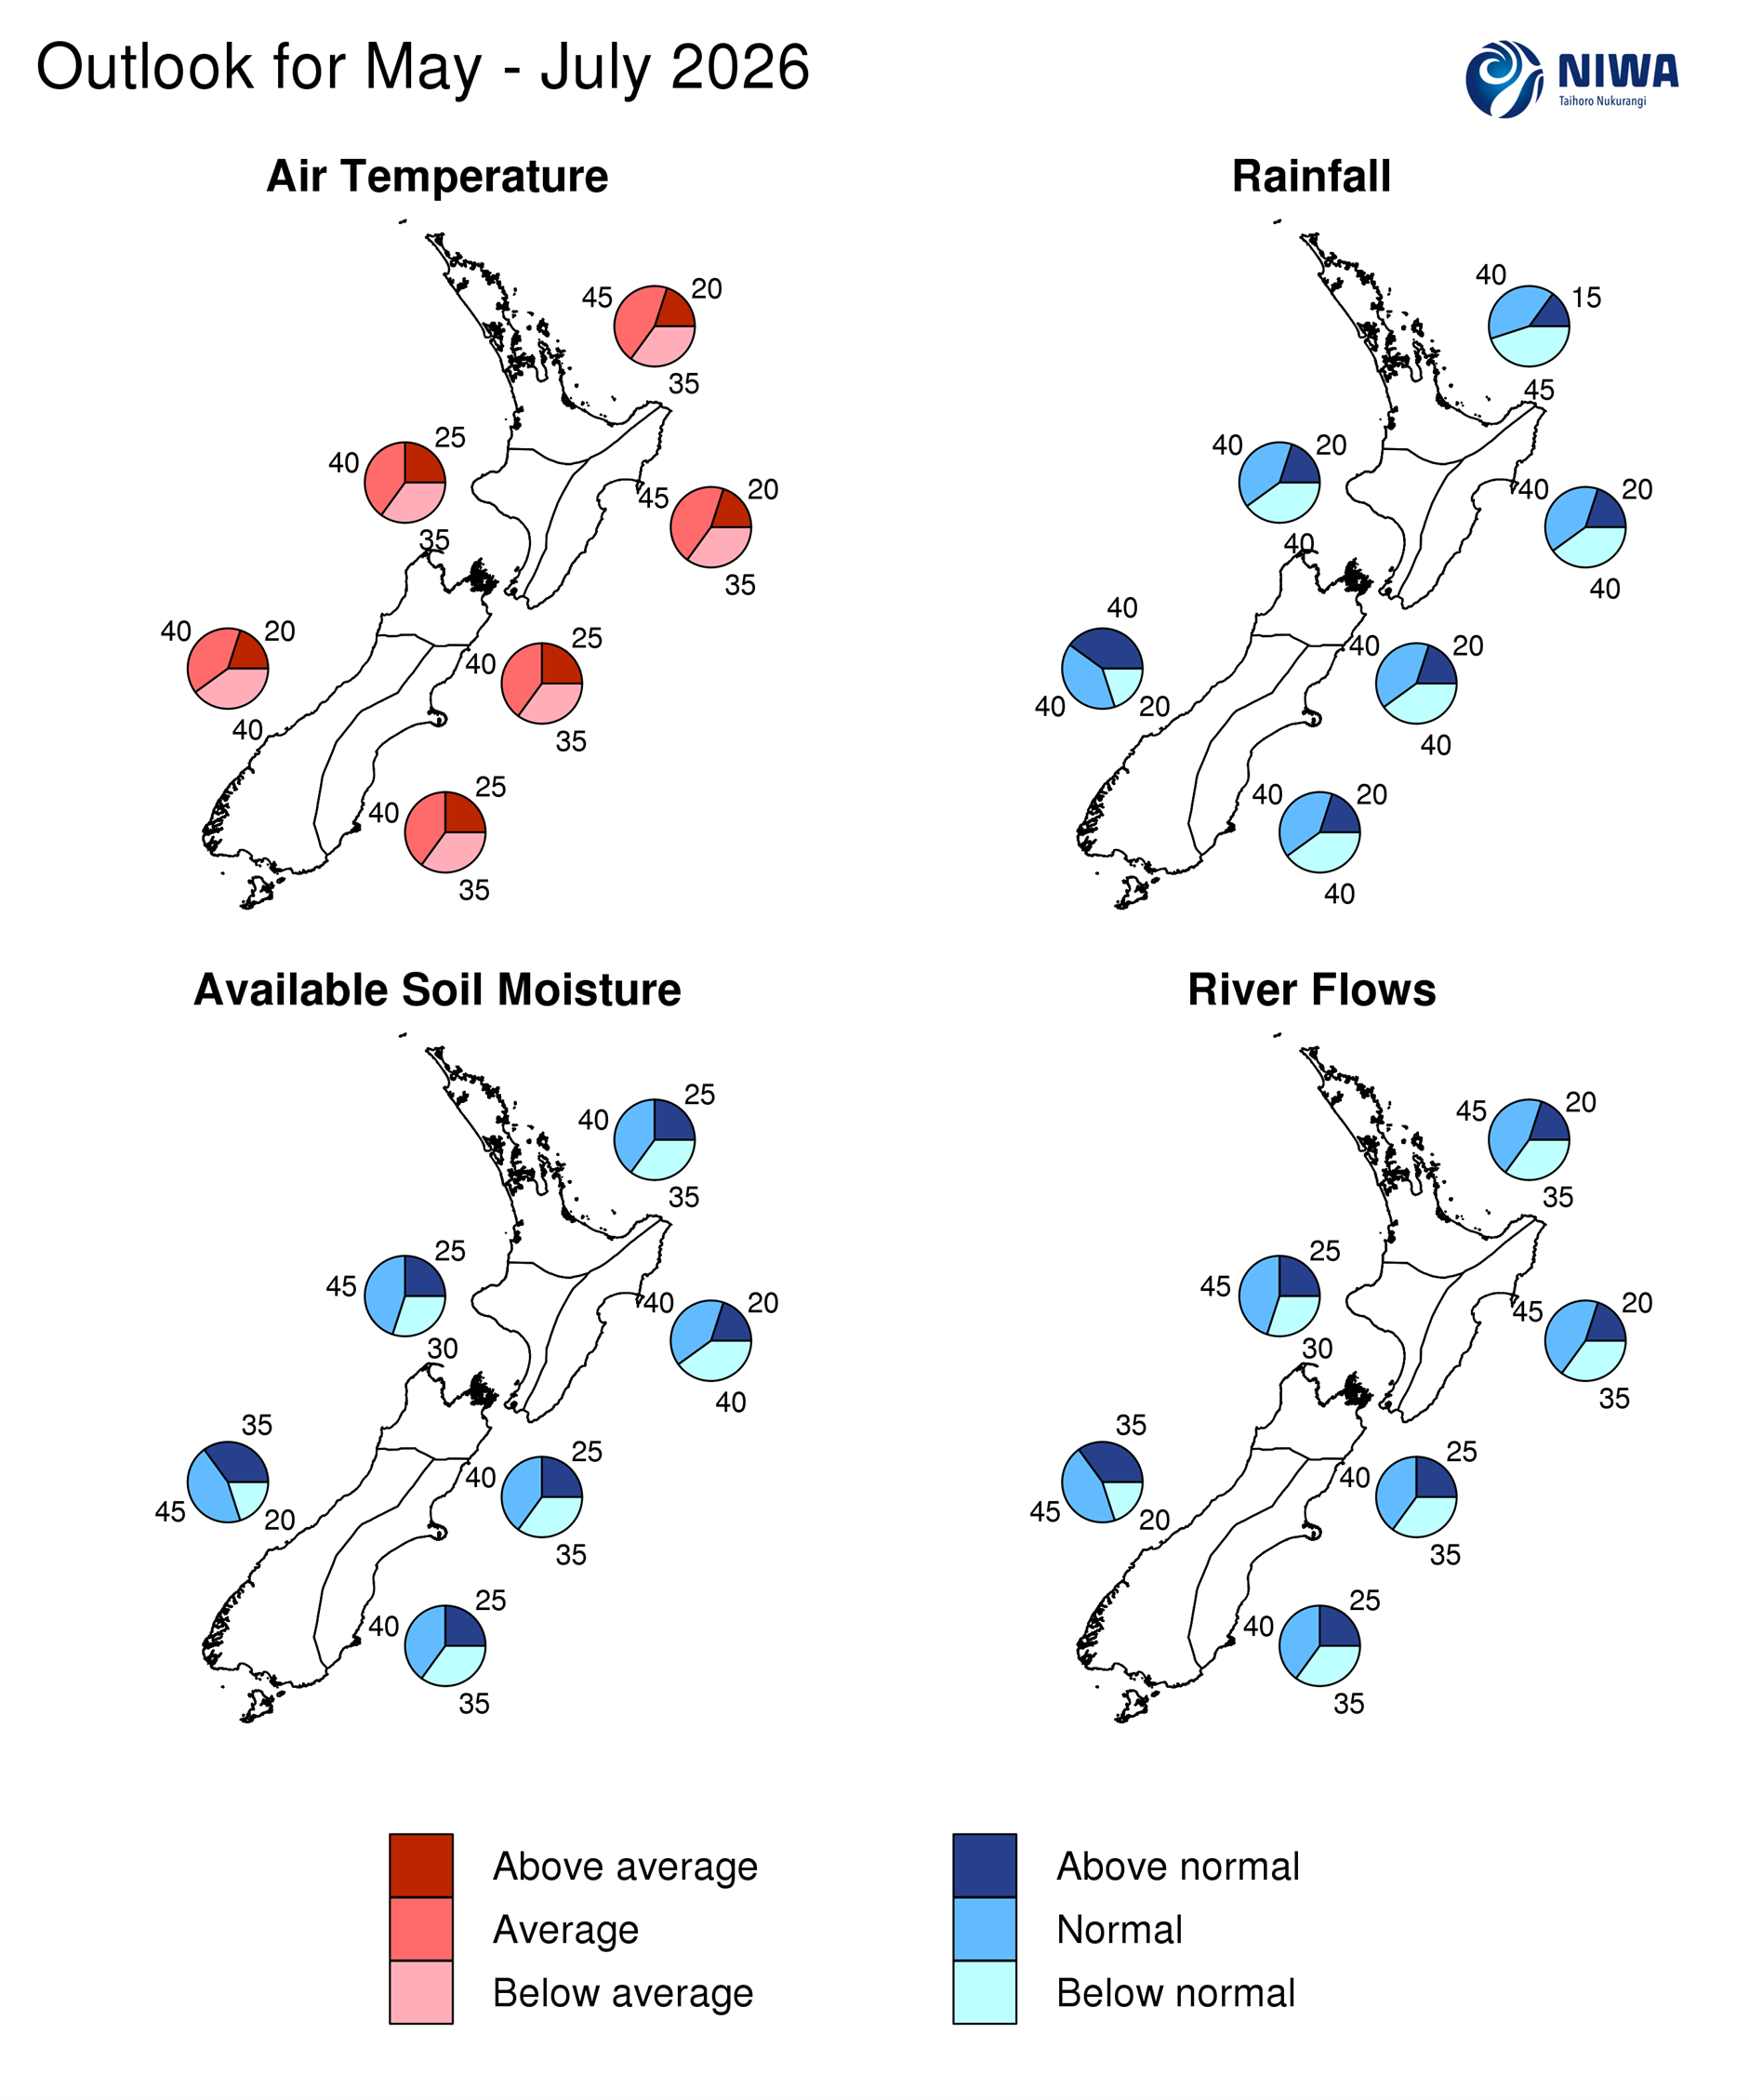
- Temperatures are most likely to be near average (45% chance).
- Rainfall totals are about equally likely to be below normal (45% chance) or near normal (40% chance). The effects of reduced rainfall are likely to become more apparent as the season progresses.
- Soil moisture levels are about equally likely to be near normal (40% chance) or below normal (35% chance).
- River flows are most likely to be near normal (45% chance).
| Temperature | Rainfall | Soil moisture | River flows | |
| Above average | 20 | 15 | 25 | 20 |
| Near average | 45 | 40 | 40 | 45 |
| Below average | 35 | 45 | 35 | 35 |
Central North Island, Taranaki, Whanganui, Manawatu, Wellington
Probabilities are assigned in three categories: above average, near average, and below average.
- Temperatures are about equally likely to be near average (40% chance) or below average (35% chance).
- Rainfall totals are equally likely to be near normal (40% chance) or below normal (40% chance). Dry conditions may become more noticeable as the season progresses.
- Soil moisture levels and river flows are most likely to be near normal (45% chance).
| Temperature | Rainfall | Soil moisture | River flows | |
| Above average | 25 | 20 | 25 | 25 |
| Near average | 40 | 40 | 45 | 45 |
| Below average | 35 | 40 | 30 | 30 |
Gisborne, Hawke’s Bay, Wairarapa
Probabilities are assigned in three categories: above average, near average, and below average.
- Temperatures are most likely to be near average (45% chance).
- Rainfall amounts for May – July are equally likely to be near normal (40% chance) or below normal (40% chance). The effects of reduced rainfall are likely to become more apparent as the season progresses.
- Soil moisture levels are equally likely to be near normal (40% chance) or below normal (40% chance).
- River flows are most likely to be near normal (45% chance).
| Temperature | Rainfall | Soil moisture | River flows | |
| Above average | 20 | 20 | 20 | 20 |
| Near average | 45 | 40 | 40 | 45 |
| Below average | 35 | 40 | 40 | 35 |
Tasman, Nelson, Marlborough, Buller
Probabilities are assigned in three categories: above average, near average, and below average.
- Temperatures are about equally likely to be near average (40% chance) or below average (35% chance).
- Rainfall totals are equally likely to be near normal (40% chance) or below normal (40% chance). The effects of reduced rainfall are likely to become more apparent as the season progresses, particularly for eastern areas.
- Soil moisture levels and river flows are about equally likely to be near normal (40% chance) or below normal (35% chance).
| Temperature | Rainfall | Soil moisture | River flows | |
| Above average | 25 | 20 | 25 | 25 |
| Near average | 40 | 40 | 40 | 40 |
| Below average | 35 | 40 | 35 | 35 |
West Coast, Southern Alps and foothills, inland Otago, Southland
Probabilities are assigned in three categories: above average, near average, and below average.
- Temperatures are equally likely to be near average (40% chance) or below average (40% chance).
- Rainfall totals are equally likely to be near normal (40% chance) or above normal (40% chance).
- Soil moisture levels and river flows are most likely to be near normal (45% chance).
| Temperature | Rainfall | Soil moisture | River flows | |
| Above average | 20 | 40 | 35 | 35 |
| Near average | 40 | 40 | 45 | 45 |
| Below average | 40 | 20 | 20 | 20 |
Coastal Canterbury and the nearby plains, east Otago
Probabilities are assigned in three categories: above average, near average, and below average.
- Temperatures are about equally likely to be near average (40% chance) or below average (35% chance).
- Rainfall totals are equally likely to be near normal (40% chance) or below normal (40% chance). The effects of reduced rainfall are likely to become more apparent as the season progresses.
- Soil moisture levels and river flows are about equally likely to be near normal (40% chance) or below normal (35% chance).
The full probability breakdown is:
| Temperature | Rainfall | Soil moisture | River flows | |
| Above average | 25 | 20 | 25 | 25 |
| Near average | 40 | 40 | 40 | 40 |
| Below average | 35 | 40 | 35 | 35 |
Background
The Southern Oscillation Index (SOI) in April 2026 switched significantly negative to values not seen since the end of the last El Niño event two years ago. Based on daily data through 30 April, the April SOI value was −0.6. Intraseasonal drivers will have played some role in this, notably early in the month, but it still represents a notable change away from the recent La Niña-type atmospheric patterns.
Sea surface temperatures (SSTs) in the central equatorial Pacific continued to weaken at an increasing rate (i.e. to become less negative) and the relative Niño 3.4 Index (RONI*) value for the past 30 days (to the 27th of April) is -0.10oC (i.e. in the neutral range). The relative Niño 1+2 index, in the easternmost equatorial Pacific, remained positive in April 2026, with warming resuming during the month. These strong positive anomalies (exceeding +1.0oC) are consistent with a ‘coastal El Niño’ (‘El Niño Costero’), a phenomenon involving localised warming off the South American coast (northern Peru and southern Ecuador). While some Coastal El Niño events precede major basin‑wide events (e.g. 1997), others occur completely independently (e.g. 2017).
During April 2026, warmer than average subsurface ocean temperatures in the tropical Pacific continued to intensify, both in the far eastern Pacific near the surface (east of ~120oW) and around the International Date Line at about 100m depth, with anomalies exceeding +6.0oC locally. Positive upper-ocean heat content anomalies (0–300 m) are now present all along the Equator in the Pacific.
The intensification and expansion of warmer‑than‑average subsurface ocean waters are increasingly consistent with the early stages of a strong El Niño event later this year.
Rainfall and Convection: During April 2026, enhanced convection and rainfall, indicated by negative outgoing longwave radiation (OLR) anomalies, were focused in the northern tropical Pacific Ocean, and over parts of tropical South America and Africa. Positive OLR anomalies, indicating suppressed convection, were recorded over the Maritime Continent and sporadically across the Pacific Basin. This pattern marks a break from the La Niña spatial patterns seen through most of 2026. Intraseasonal drivers (the MJO and Equatorial Rossby Waves) have contributed significantly to this breakdown.
Weakened trade winds, with occasional reversals, covered the Pacific basin through much of April. A westerly wind burst early in the month in the western Pacific was notable and will prove influential for seasonal changes in the coming months.
In summary, La Niña patterns are no longer present in the tropical atmosphere, completing the transition at the tail end of the recent event. Oceanic conditions are still setting the stage for the development of El Niño later this year, with particularly significant warmth (positive heat content anomalies) stored in the ocean along the Equator in the Pacific. Both model guidance and observations show this signal continuing to grow stronger with time.
The Relative Oceanic Niño Index forecasts indicate a 65% chance for El Niño conditions to develop over the next three month period (May – July 2026), with a 35% chance for ENSO-neutral. The IRI/CPC forecasts also support this outlook. The likelihood of El Niño increases rapidly thereafter, with an El Niño event now considered virtually certain to develop later this year. Any remaining uncertainty relates primarily to the precise timing of onset and the eventual magnitude of the event at its peak. The projected magnitude of the sea surface temperature anomalies continues to increase as new information arrives, suggesting that this El Niño will likely be a strong event, potentially comparable to some of the strongest El Niño events on record. Note that it is not expected to peak until far beyond the current outlook period.
The Southern Annular Mode (SAM) was frequently negative during April 2026, the most negative-dominant month since December 2025. The current value (to 17 April) for the month of April 2026 is -0.27 standard deviations (std), with about 55% of days exceeding -0.5 std over the same period. Forecasts suggest the SAM index will be positive for the first week of May, before likely tending negative in the second week.
The Indian Ocean Dipole (IOD) value for April 2026 is positive (+0.17°C). Forecasts from the Australian Bureau of Meteorology indicate that the IOD is likely to remain positive overall over the next three-month period and may reach thresholds (+0.4°C) required to declare a positive IOD event later in the winter.
During April 2026, the Madden-Julian Oscillation (MJO) was coherent and active, and behaved more canonically in comparison to previous months. It led to enhanced tropical activity in the western Pacific early in the month, with three named tropical cyclones forming. For the fourth month in a row, the MJO combined with an Equatorial Rossby Wave to produce twin cyclones either side of the equator – one of which became Super Typhoon Sinlaku. For New Zealand, Cyclone Vaianu was the most important consequence of this activity. As the month progressed, the MJO completed its orbit, seeing out the month over Africa and the western Indian Ocean. It is forecast to continue tracking eastwards early in May. Some models have unusually high speed of this orbit, which may be because of a shift in long wave activity in the tropics away from the La Nina-like state from earlier this year. The MJO is expected to struggle to propagate across the Maritime Continent, which may also partly be a result of the tropical base state changing. This reduces the chance of any slightly out of season cyclones forming during the month of May.
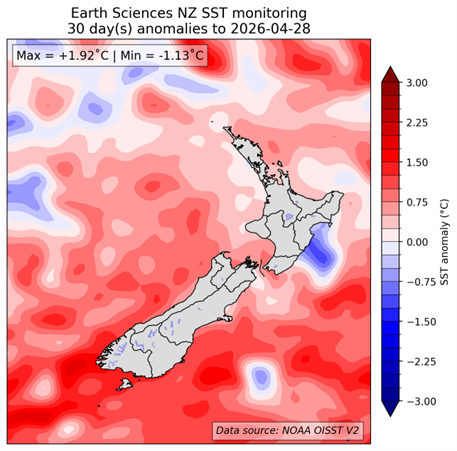
Local Sea Surface Temperature (SSTs) around New Zealand warmed compared with March and are now above average for the majority of the country. The warming was especially significant for the western North Island. Forecasts from coupled ocean-atmosphere models for the next three-month period (see Sea Surface Temperature Update | Earth Sciences New Zealand | NIWA) indicate SSTs should continue to warm around the coastal waters of the country, especially around the east of the South Island.
| North NI | +0.34°C |
| West NI | -0.52°C |
| East NI | 0.00°C |
| North SI | +0.66°C |
| West SI | +1.16°C |
| East SI | +0.80°C |
[1]The Relative Oceanic Niño 3.4 Index (RONI) is a modern way of measuring oceanic El Niño and La Niña that is complementary to traditional oceanic indices. While traditional oceanic indices like the Niño 3.4 Index monitor SSTs in one region, the RONI compares the average SST in the central equatorial Pacific with the average SST across the global tropics. Since tropical rainfall patterns respond to changes in ocean temperatures, this new relative index can help forecasters better determine if the equatorial Pacific is warmer or cooler than the rest of the global tropics, which has become more challenging to discern as seas warm because of climate change.
Forecast Confidence
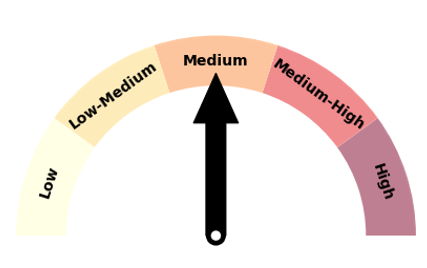
Temperature
Forecast confidence for temperatures is Medium. Circulation anomalies are not expected to persistently favour warm directions, but there is uncertainty in whether regions will observe average or below average temperatures over the outlook period.
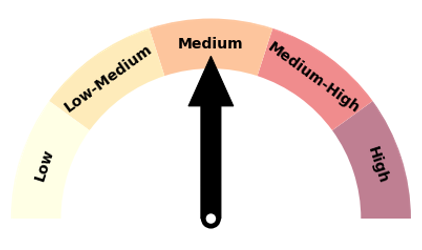
Rainfall
Forecast confidence for rainfall is Medium. This is an increase in confidence compared with recent outlooks. Although some uncertainties remain, the generally drier lean for most of the country is considered relatively reliable, especially given that climatologically this is a relatively wet time of year.
