Outlook summary
- A La Niña Watch remains in effect.
- Recent signals in both the ocean and the atmosphere point to the tropical Pacific transitioning to more distinct La Niña-like conditions over the course of December. There is however still uncertainty as to whether conventional La Nina thresholds will be exceeded: international guidance indicates about equal chances for La Niña (50%) and neutral (49%) categories during December 2024 – February 2025.
- Regardless of whether La Niña is formally declared over the forecast period, weather patterns broadly consistent with La Niña conditions are expected to become more established around Aotearoa New Zealand as the summer season unfolds.
- In early-to-mid December, a period of stronger-than-usual westerly winds is expected to bring rainfall, possibly heavy, to most western regions of the country. Thereafter, more typical La Niña-like conditions are expected to develop resulting in increased northeasterly quarter winds.
- As the season progresses, a lean towards more frequent rain events is expected from about the new year, particularly for northern and eastern parts of the North Island. Monitor NIWA35 for updates.
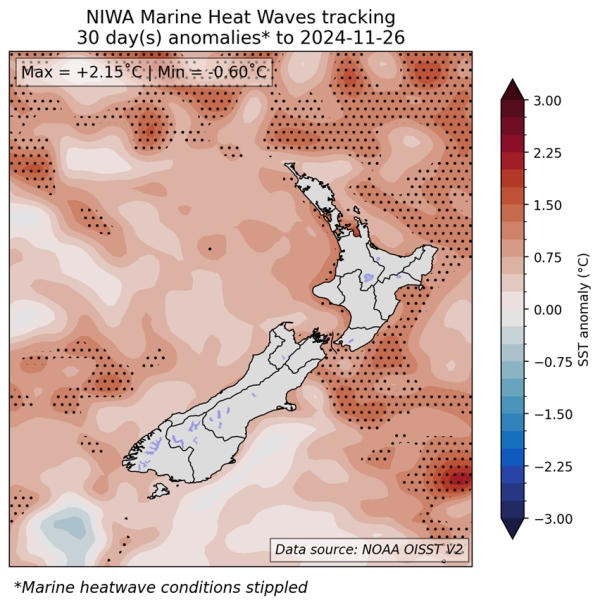
- Coastal sea surface temperatures (SSTs) remained generally above average around the country, ranging from about 0.5˚C to 1.0˚C above average during the past 30 days, but marine heatwave conditions have receded in both extent and amplitude recently. Global climate models’ forecasts are for SSTs to remain above average around New Zealand during the coming summer, and marine heatwaves will remain possible. Monitor the SST update for updates.
- December-February soil moisture levels and river flows are most likely to be near or below normal in east of the North Island and the north and west of the South Island, and near normal in the east of the South Island. For the north of the North Island, below normal soil moisture levels are most likely, and near or below normal river flows are equally likely.
- Soil moisture levels at depth continue to be below normal in the east of the North Island.
Regional predictions for December 2024 – February 2025
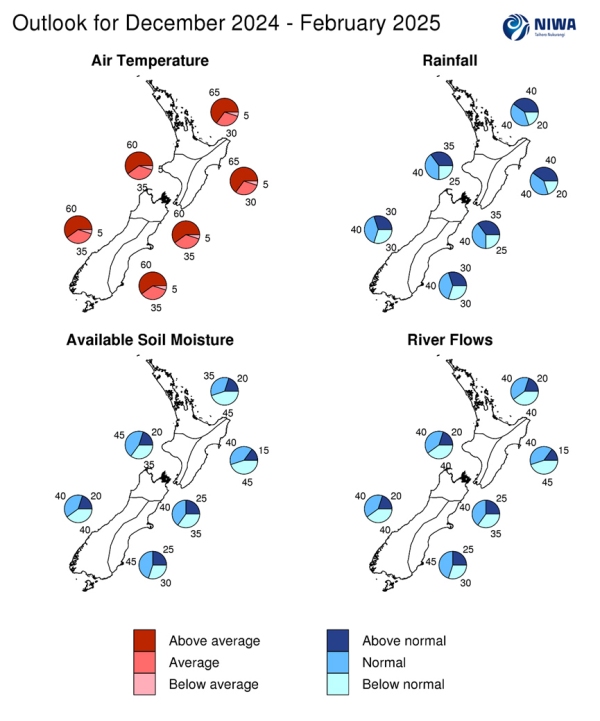
The tables below show the probabilities (or percent chances) for each of three categories: above average, near average, and below average. In the absence of any forecast guidance there would be an equal likelihood (33% chance) of the outcome for any of the three categories. Forecast information from local and global guidance models is used to indicate the deviation from equal chance that is expected for the coming three-month period. All outlooks are for the three months as a whole. There will inevitably be relatively wet and dry days, and hot and cold days, within a season. The exact range in temperature and rainfall within each of the three categories varies with location and season. However, as a guide, the “near average” or middle category for the temperature predictions includes deviations up to ±0.5°C for the long-term mean, whereas for rainfall the “near normal” category lies between 80 per cent and 120 per cent of the long-term (1991-2020) mean.
Northland, Auckland, Waikato, Bay of Plenty
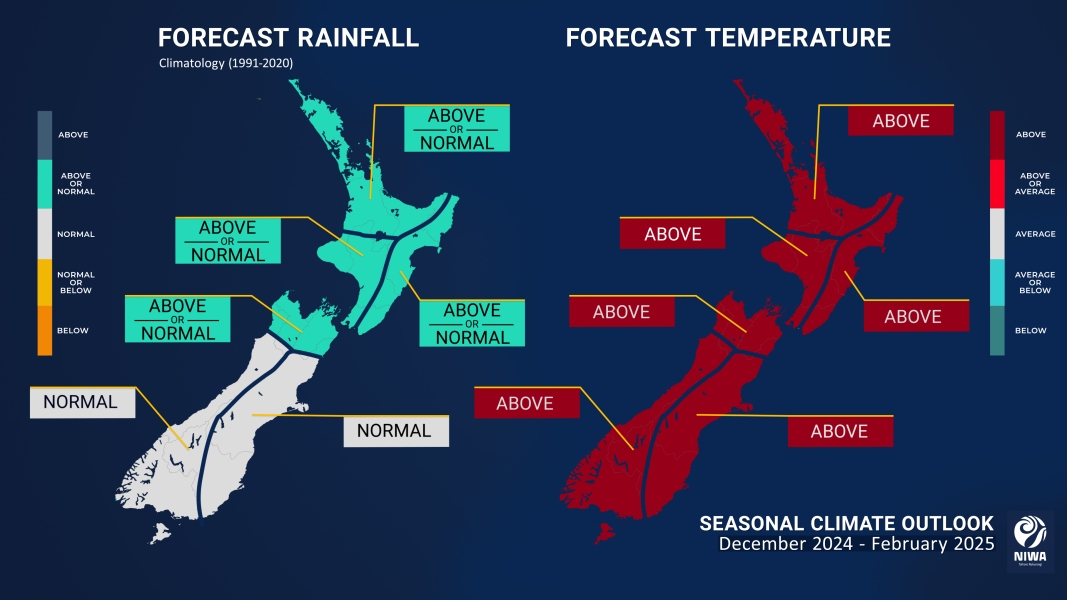
- Spells of unusually warm weather, including warm overnights, are expected as summer progresses.
- Soil moisture levels are most likely to be below normal (45% chance) and river flows are equally likely to be near normal (40% chance) or below normal (40% chance).
| Temperature | Rainfall | Soil moisture | River flows | |
| Above average | 65 | 40 | 20 | 20 |
| Near average | 30 | 40 | 35 | 40 |
| Below average | 05 | 20 | 45 | 40 |
Central North Island, Taranaki, Whanganui, Manawatu, Wellington
Probabilities are assigned in three categories: above average, near average, and below average.
- Temperatures are very likely to be above average (60% chance).
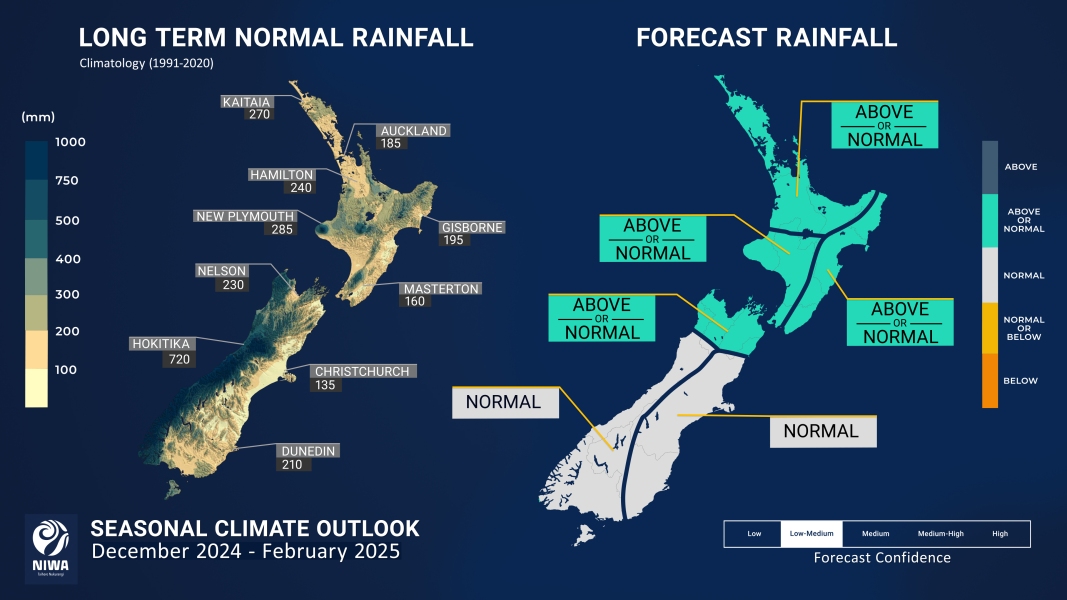
- Rainfall totals are about equally likely to be near normal (40% chance) or above normal (35% chance) for the summer season as a whole. Heavy rainfall events cannot be ruled out.
- Soil moisture levels are most likely to be near normal (45% chance) and river flows are equally likely to be near normal (40% chance) or below normal (40% chance).
| Temperature | Rainfall | Soil moisture | River flows | |
| Above average | 60 | 35 | 20 | 20 |
| Near average | 35 | 40 | 45 | 40 |
| Below average | 05 | 25 | 35 | 40 |
Gisborne, Hawke’s Bay, Wairarapa
Probabilities are assigned in three categories: above average, near average, and below average.
- Temperatures are very likely to be above average (65% chance). Spells of unusually warm weather, including warm overnights, are expected especially in the latter half of the summer.
- Rainfall totals are equally likely to be near normal (40% chance) or above normal (40% chance) for the summer as a whole. Wetter than normal conditions are expected to become more established as the summer unfolds, including the threat of heavy rainfall events.
- Soil moisture levels and river flows are most likely to be below normal (45% chance) for the summer as a whole.
| Temperature | Rainfall | Soil moisture | River flows | |
| Above average | 65 | 40 | 15 | 15 |
| Near average | 30 | 40 | 40 | 40 |
| Below average | 05 | 20 | 45 | 45 |
Tasman, Nelson, Marlborough, Buller
Probabilities are assigned in three categories: above average, near average, and below average.
- Temperatures are very likely to be above average (60% chance).
- Rainfall totals are about equally likely to be near normal (40% chance) or above normal (35% chance) for the summer season as a whole. Heavy rainfall events cannot be ruled out.
- Soil moisture levels and river flows are about equally likely to be near normal (40% chance) or below normal (35% chance).
| Temperature | Rainfall | Soil moisture | River flows | |
| Above average | 60 | 35 | 25 | 25 |
| Near average | 35 | 40 | 40 | 40 |
| Below average | 05 | 25 | 35 | 35 |
West Coast, Southern Alps and foothills, inland Otago, Southland
Probabilities are assigned in three categories: above average, near average, and below average.
- Temperatures are very likely to be above average (60% chance). More northeasterly winds may contribute to more days above 25˚C than normal.
- Rainfall totals are most likely to be near normal (40% chance). After a period of potentially significant rainfall in December, weather patterns more typical of La Niña conditions are expected to develop, with northeasterly quarter flow anomalies resulting in extended dry spells to emerge.
- Soil moisture levels and river flows are equally likely to be near normal (40% chance) or below normal (40% chance).
| Temperature | Rainfall | Soil moisture | River flows | |
| Above average | 60 | 30 | 20 | 20 |
| Near average | 35 | 40 | 40 | 40 |
| Below average | 05 | 30 | 40 | 40 |
Coastal Canterbury and the nearby plains, east Otago
Probabilities are assigned in three categories: above average, near average, and below average.
- Temperatures are very likely to be above average (60% chance). Northeasterly quarter wind anomalies could lead to nighttimes being more unusually warm than the daytimes.
- Rainfall totals are likely to be near normal (40% chance). Dry periods may be interspersed with short and sharp rain events for the region as the season progresses.
- Soil moisture levels and river flows are most likely to be near normal (45% chance).
The full probability breakdown is:
| Temperature | Rainfall | Soil moisture | River flows | |
| Above average | 60 | 30 | 25 | 25 |
| Near average | 35 | 40 | 45 | 45 |
| Below average | 05 | 30 | 30 | 30 |
Graphical representation of the regional probabilities
Background
Sea surface temperatures(SSTs) remained in the neutral range in the central equatorial Pacific (Niño 3.4 Index) during November (-0.12˚C), decreasing from -0.35˚C at the end of October. As of 26 November, the 30-day relative Niño 3.4 Index* (RONI) was -0.76˚C, reflective of the central equatorial Pacific being significantly cooler than the average of the global tropics.
The Southern Oscillation Index (SOI) was on the La Niña side of neutral during November (+0.4) and September-November (+0.3), but daily values show a recent trend towards more positive values.
During November, upper-oceanic heat content was about 1.0˚C to 1.5˚C below average in the eastern and central equatorial Pacific (centred around 125˚W), while above average oceanic heat content (0.5 to 1.5˚C above average) was observed in the western equatorial Pacific. The subsurface equatorial Pacific remained 3˚C to 5˚C cooler than average between 50m and 100m depth in the east-central part of the basin. The West Pacific Warm Pool remains warmer than average west of the International Dateline at the end of November.
This ‘dipole’ in oceanic heat content and subsurface temperatures along the equator sets the stage for a potential intensification of surface temperature anomalies, and towards clearer La Niña-like conditions if the trade winds intensify over the next few weeks and remain stronger than usual through December, as is currently predicted.
While recent signals in both the ocean and the atmosphere point to the Pacific transitioning to more distinct La Niña-like conditions over the course of December, there is still large uncertainty as to whether official La Nina thresholds will be exceeded over the coming season: guidance from the international forecast models that NIWA monitors indicates about equal chances for La Niña (50%) and neutral (49%) categories over the forecast period.
Regardless of whether La Niña is officially declared over the forecast period, weather patterns broadly consistent with La Niña conditions are expected to become more established around the country as the summer season unfolds. However, sea surface temperatures in the tropics remain much higher than normal, which may influence the atmospheric response and weather patterns associated with La Niña. No two La Niña events are alike, a concept that may be more pertinent in a world that features widespread above average sea temperatures.
A “La Niña Watch” remains in effect. NIWA will continue to actively monitor oceanic and atmospheric patterns across the Pacific and we encourage the public and especially climate sensitive sectors to keep up to date with our Seasonal Climate Outlooks throughout the summer, and to make use of the New Zealand drought dashboard, which provides 35-day outlooks of rainfall and drought, updated once daily: https://niwa.co.nz/weather-forecasting/seasonal-climate-outlook.
The Southern Annular Mode (SAM) was mostly positive during November (73% of days positive), with the latest (25 November) 30-day average anomaly being +0.6. The forecast is for the SAM to become temporarily negative at the beginning of December, then climb up to positive values again. A positive SAM index is consistent with La Niña phases.
The Indian Ocean Dipole (IOD) index became more strongly negative in November, and the latest (23 November) 30-day anomaly is 1.38. A negative IOD is typically associated with developing La Niña events and the eastern Indian Ocean is accordingly warmer than average.
During November, convective forcing associated with the MJO reached the eastern Indian Ocean (phase 3) where it was associated with increased convection in the last few days of November. This MJO pulse is however forecast to weaken considerably as it propagates into the western Pacific during December.
Sea surface temperatures (SSTs) around New Zealand remained generally above average in November, with anomalies ranging from about +0.5˚C to +1.0˚C during the past 30 days, but marine heatwave conditions have recently receded and are less spatially extensive than earlier in the month. Global climate models’ forecasts are for SSTs to remain above average around New Zealand during the coming summer, and marine heatwaves will remain possible. For more info, see the NIWA Sea Surface Temperature Update.
*
The Relative Oceanic Niño 3.4 Index (RONI) is a modern way of measuring oceanic El Niño and La Niña that is complementary to oceanic traditional indices. While traditional oceanic indices like the Niño 3.4 Index monitor SSTs in one region, the RONI compares the average SST in the central equatorial Pacific with the average SST across the global tropics. Since tropical rainfall patterns respond to changes in ocean temperatures, this new relative index can help forecasters better determine if the equatorial Pacific is warmer or cooler than the rest of the global tropics, which has become more challenging to discern as seas warm because of climate change.
| North NI | +0.84˚C |
| West NI | +1.04˚C |
| East NI | +0.98˚C |
| North SI | +0.73˚C |
| West SI | +0.55˚C |
| East SI | +0.58˚C |
Forecast confidence
Temperature

Forecast confidence for temperatures is medium-high. With La Niña-like conditions forecast to become established, and anticyclonic and northeasterly flow anomalies in place, a warmer than average summer period is very likely.
Rainfall

Forecast confidence for rainfall is low-medium. While weather patterns broadly consistent with La Niña are expected to become more established as the summer unfolds, summer rainfall will depend on the location and size of the area of high air pressure that is forecast south and east of the country.


