Outlook Summary
- ENSO-neutral (El Niño – Southern Oscillation) conditions remain present in the tropical Pacific but have been trending towards La Niña-like conditions in July 2025.
- This trend was driven in part by shifts in the structure of oceanic heat content and subsurface temperature anomalies in the equatorial Pacific Ocean.
- ENSO-neutral conditions are the most likely outcome (about a 60% chance) over the forecast period (August – October 2025), but compared to ENSO outlooks issued last month, chances for La Niña to emerge by the end of the calendar year have increased.
- Experimental forecasts for the alternative Relative Oceanic Niño Index (RONI), which accounts for the broader warming trend across the tropical Pacific, indicate La Niña conditions are more likely to dominate the forecast period, with a probability close to 60%.
- For New Zealand, atmospheric circulation over the next three-month period is expected to be dominated by northeasterly to easterly air flow anomalies. The likelihood of tropical and subtropical systems influencing New Zealand remains elevated. This continues to be associated with an increased risk of heavy rainfall events, including those linked to atmospheric rivers, and flooding.
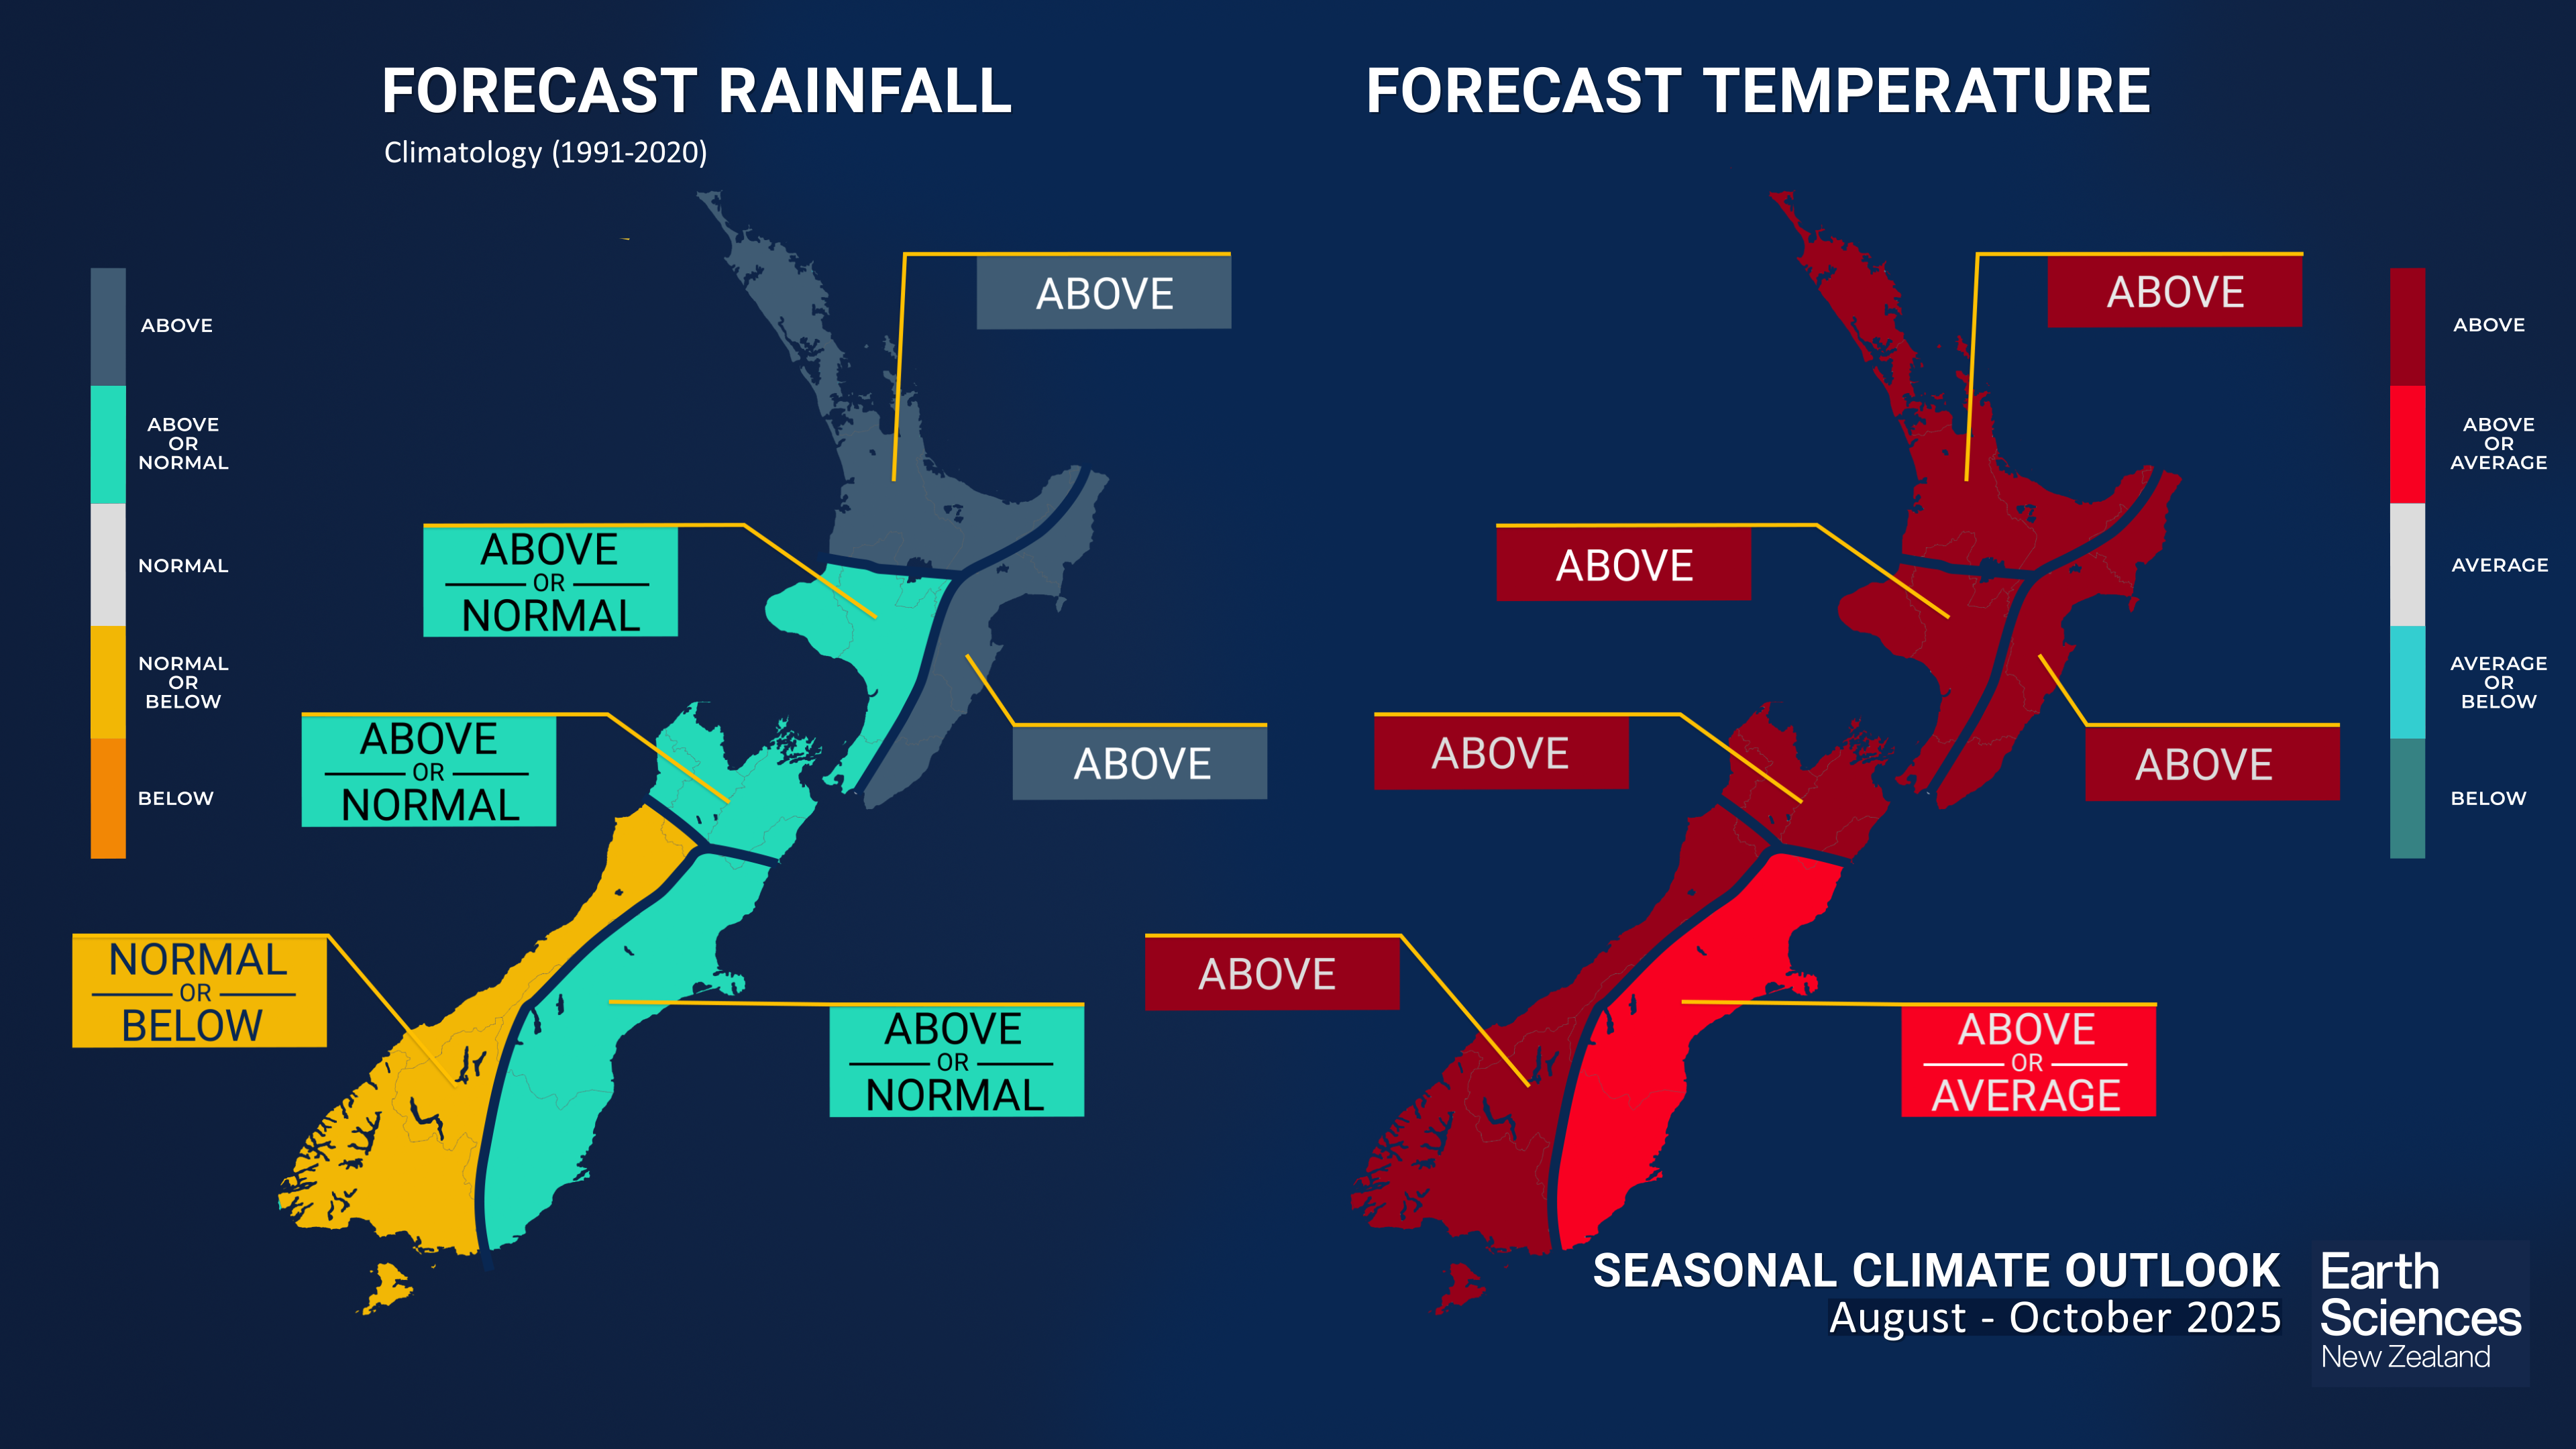
- Seasonal air temperatures for the three-month period are expected to be above average for all regions of New Zealand except the east of the South Island, for which above average or near average temperatures are about equally likely. While cold snaps and frost are anticipated, they are expected to be less frequent than usual.
- August – October rainfall totals are expected to be above normal for the north and east of the North Island. Near normal or below normal rainfall is forecast for the west of the South Island. For all remaining regions of New Zealand, near normal or above normal rainfall totals are about equally likely. These anticipated rainfall patterns are driven by circulation anomalies that heighten the risk of heavy rainfall events in the north and east of the North Island. Conversely, a shift toward more persistent easterly flow anomalies is expected as the season progresses, increasing the likelihood of dry conditions in the southwest of the South Island. Sub-seasonal, or monthly, projections of rainfall and dryness are updated daily through the NIWA35 forecast.
- During August – October 2025, soil moisture levels and river flows are expected to be near normal in the north and west of the North Island and near normal or below normal in the east of the North Island. Near normal or above normal soil moisture levels and river flows are forecast for the South Island.
- Sea surface temperatures (SSTs) around New Zealand remain above average, particularly off the west coasts of both the North and South Islands, where Marine Heatwave (MHW) conditions persist. These are defined as periods of five or more consecutive days with SSTs exceeding the 90th percentile for the time of year. Compared to last month, ocean temperatures have warmed east of the North Island, indicating a broadening of unusually warm waters for the time of year. For July 2025 (based on data through 28 July), coastal SST anomalies ranged from +0.8°C off the northern tip of the North Island to +1.5°C off the southwest coast of the North Island. Looking ahead, forecasts for August to October 2025 suggest that above-average SSTs are likely to persist around New Zealand, although the intensity of anomalies may ease slightly. Monitor the SST update for updates.


Regional predictions for August – October 2025
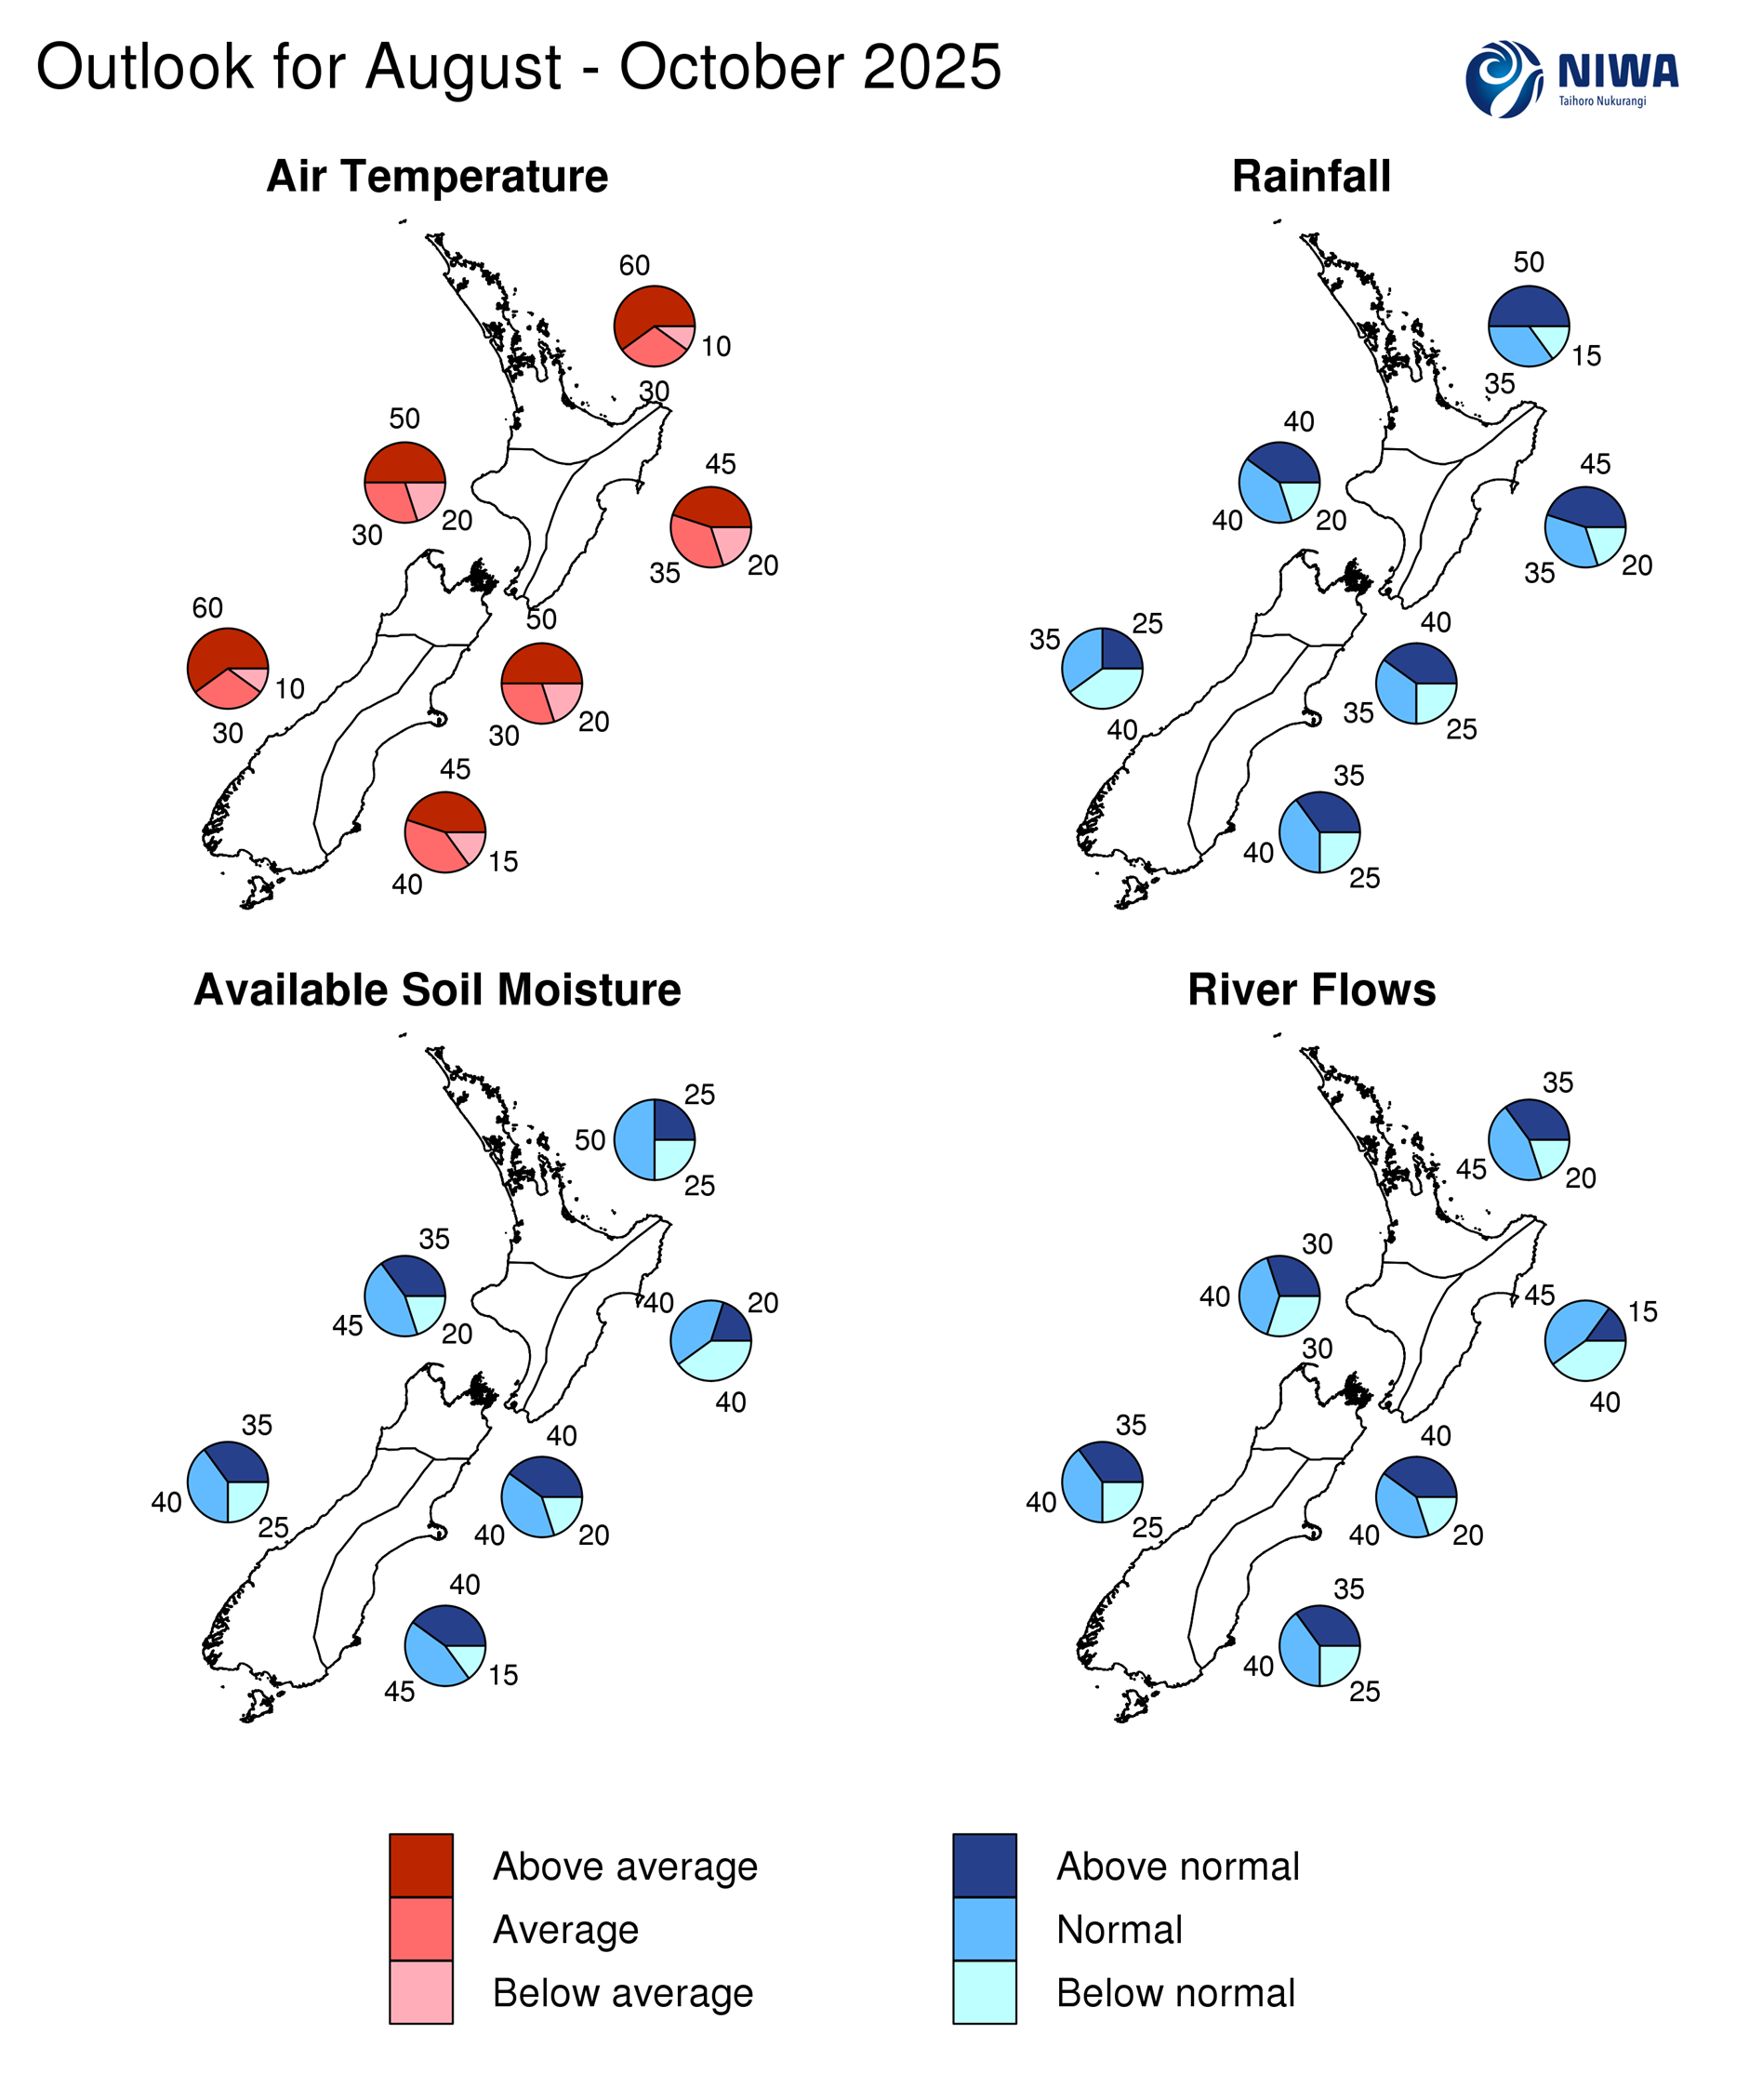
The tables below show the probabilities (or percent chances) for each of three categories: above average, near average, and below average. In the absence of any forecast guidance there would be an equal likelihood (33% chance) of the outcome for any of the three categories. Forecast information from local and global guidance models is used to indicate the deviation from equal chance that is expected for the coming three-month period.
All outlooks are for the three months averaged as a whole. During these three months, there will inevitably be relatively wet and dry periods, as well as hot and cold periods. The exact range in temperature and rainfall within each of the three categories varies with location and season. However, as a guide, the “near average” or middle category for the temperature predictions includes deviations up to ±0.5°C relative to the long-term mean, whereas for rainfall the “near normal” category lies between 80 percent and 120 percent of the long-term (1991-2020) mean.
Northland, Auckland, Waikato, Bay of Plenty
- Temperatures are very likely to be above average (60% chance).
- Rainfall totals are most likely to be above normal (50% chance) for August – October 2025 as a whole, and chances for heavy rainfall events remain elevated.
- Soil moisture levels and river flows are most likely to be near normal (45-50% chance).
| Temperature | Rainfall | Soil moisture | River flows | |
| Above average | 60 | 50 | 25 | 35 |
| Near average | 30 | 35 | 50 | 45 |
| Below average | 10 | 15 | 25 | 20 |
Central North Island, Taranaki, Whanganui, Manawatu, Wellington
Probabilities are assigned in three categories: above average, near average, and below average.
- Temperatures are most likely to be above average (50% chance).
- Rainfall totals are equally likely to be near normal (40% chance) or above normal (40% chance).
- Soil moisture levels and river flows are most likely to be near normal (40-45% chance).
| Temperature | Rainfall | Soil moisture | River flows | |
| Above average | 50 | 40 | 35 | 30 |
| Near average | 30 | 40 | 45 | 40 |
| Below average | 20 | 20 | 20 | 30 |
Gisborne, Hawke’s Bay, Wairarapa
Probabilities are assigned in three categories: above average, near average, and below average.
- Temperatures are most likely to be above average (45% chance).
- Rainfall totals are most likely to be above normal (45% chance). The forecast period carries an elevated risk of heavy rainfall events.
- Soil moisture levels and river flows are about equally likely to be near normal (40-45% chance) or below normal (40% chance).
| Temperature | Rainfall | Soil moisture | River flows | |
| Above average | 45 | 45 | 20 | 15 |
| Near average | 35 | 35 | 40 | 45 |
| Below average | 20 | 20 | 40 | 40 |
Tasman, Nelson, Marlborough, Buller
Probabilities are assigned in three categories: above average, near average, and below average.
- Temperatures are most likely to be above average (50% chance).
- Rainfall totals are about equally likely to be above normal (40% chance) or near normal (35% chance). There is also an increased risk of heavy rainfall events, which may lead to localised impacts in some areas.
- Soil moisture levels and river flows equally likely to be above normal (40% chance) or near normal (40% chance).
| Temperature | Rainfall | Soil moisture | River flows | |
| Above average | 50 | 40 | 40 | 40 |
| Near average | 30 | 35 | 40 | 40 |
| Below average | 20 | 25 | 20 | 20 |
West Coast, Southern Alps and foothills, inland Otago, Southland
Probabilities are assigned in three categories: above average, near average, and below average.
- Temperatures are very likely to be above average (60% chance).
- Rainfall totals are about equally likely to be below normal (40% chance) or near normal (35% chance) over the forecast period.
- Soil moisture levels and river flows are about equally likely to be near normal (40% chance) or above normal (35% chance). However, warmer temperatures and an increasing likelihood of dry conditions may continue to impact snow accumulation and storage in the region as spring approaches. These factors could have implications for water availability and seasonal runoff beyond the outlook period.
| Temperature | Rainfall | Soil moisture | River flows | |
| Above average | 60 | 25 | 35 | 35 |
| Near average | 30 | 35 | 40 | 40 |
| Below average | 10 | 40 | 25 | 25 |
Coastal Canterbury and the nearby plains, east Otago
Probabilities are assigned in three categories: above average, near average, and below average.
- Temperatures are about equally likely to be above average (45% chance) or near average (40% chance).
- Rainfall totals are about equally likely to be near normal (40% chance) or above normal (35% chance).
- Soil moisture levels and river flows are about equally likely to be near normal (40-45% chance) or above normal (35-40% chance).
The full probability breakdown is:
| Temperature | Rainfall | Soil moisture | River flows | |
| Above average | 45 | 35 | 40 | 35 |
| Near average | 40 | 40 | 45 | 40 |
| Below average | 15 | 25 | 15 | 25 |
Background
Sea surface temperatures (SSTs) in the central equatorial Pacific (Niño 3.4 Index) have cooled slightly in July, but remain in the neutral range, with a monthly value (estimated using data to 28 July) being close to average at -0.04oC. The relative Niño 3.4 Index (RONI*) however has recently cooled noticeably, with its latest 30-day value (to 28 July) dropping to -0.37°C, compared to -0.24°C at the end of June.
As of 29 July 2025, the preliminary monthly Southern Oscillation Index (SOI) value for July is +0.8. The SOI thus remains on the La Niña side of neutral but strengthened compared to last month. Intermittent atmospheric patterns consistent with La Niña-like conditions were again present in the Pacific this month.
In July 2025, negative upper-ocean heat content anomalies - measured in the top 300 meters of the ocean - emerged across the central and eastern equatorial Pacific. The latest pentad (5-day average) data show anomalies reaching approximately –1°C between 160°W and 130°W.
The emergence of these negative upper-ocean heat content anomalies was in particular driven by cooler-than-average subsurface temperatures that developed below the thermocline east of 160°W, with anomalies exceeding -2°C in some areas. Meanwhile, above the thermocline, the positive subsurface anomalies that had propagated eastward in June weakened in both intensity and spatial extent.
This shift in oceanic heat content and subsurface temperature structure, particularly the emergence of significantly cooler waters below the thermocline, may indicate a renewed trend toward La Niña-like conditions in the Pacific.
ENSO-neutral conditions persist across the tropical Pacific. Both the Niño 3.4 Index and the Southern Oscillation Index (SOI) remain within neutral thresholds. However, both atmospheric and oceanic indicators are showing signals consistent with stronger La Niña-like conditions. Over the New Zealand region, northeasterly to easterly quarter flow anomalies are forecast for the next three-month season as whole, a pattern broadly consistent with La Niña-like conditions. As was the case last month, the likelihood of tropical and subtropical systems influencing New Zealand remains elevated. This continues to be associated with an increased risk of heavy rainfall events, including those linked to atmospheric rivers.
Based on the traditional Niño 3.4 index, and the dynamical and statistical models monitored by Earth Sciences New Zealand, ENSO-neutral conditions are the most likely outcome (62% chance) over the forecast period (August – October 2025), but chances for La Niña increase to 41% by the end of the calendar year.
An alternative perspective is provided by an experimental Relative Oceanic Niño Index (RONI*) forecast developed by Earth Sciences New Zealand, which accounts for the broader warming trend across the tropical Pacific. According to this RONI forecast, weak La Niña conditions are more likely to dominate the forecast period, with a probability closer to 60%.
The Southern Annular Mode (SAM) switched from positive to negative about mid-July and recently returned to positive values. The last 30 days value remains positive at +0.83 std. Over the next two weeks, the SAM is forecast to remain positive, but to stay generally in the neutral range (i.e. between -1 and 1 std.)
The Indian Ocean Dipole (IOD) is currently in the neutral range, with the average anomaly for the month of July 2025 being -0.07oC. The guidance from the Australian Bureau of Meteorology is for the IOD to become more negative over the next three-month period. Note that a negative IOD during the austral spring tends to be followed by La Niña conditions, another signal adding weight to the possibility of La Niña re-emerging by the end of the calendar year.
During July 2025, a pulse of the Madden–Julian Oscillation (MJO) propagated over the Maritime Continent (phases 4 – 5) then over the western Pacific (phases 6 – 7). This may have temporarily contributed to the easterly quarter flow anomalies observed in July over New Zealand. The forecast is for the MJO signal to propagate further into the Western Hemisphere but weaken as it does so. The MJO is therefore not expected to be a significant driver of intra-seasonal anomalies for New Zealand over the next few weeks.
Sea Surface Temperatures (SSTs): SSTs remain above average off the western coasts of both the North and South Islands, where Marine Heatwave (MHW) conditions persist - defined as five or more consecutive days with SSTs above the climatological 90th percentile. Compared to last month, ocean temperatures have warmed east of New Zealand, particularly off the North Island. Forecasts for August–October 2025 suggest that above-average SSTs are likely to continue around the country, although with reduced intensity.
| North NI | +0.79°C |
| West NI | +1.50°C |
| East NI | +0.82°C |
| North SI | +1.24°C |
| West SI | +0.98°C |
| East SI | +1.00°C |

[1]The Relative Oceanic Niño 3.4 Index (RONI) is a modern way of measuring oceanic El Niño and La Niña that is complementary to oceanic traditional indices. While traditional oceanic indices like the Niño 3.4 Index monitor SSTs in one region, the RONI compares the average SST in the central equatorial Pacific with the average SST across the global tropics. Since tropical rainfall patterns respond to changes in ocean temperatures, this new relative index can help forecasters better determine if the equatorial Pacific is warmer or cooler than the rest of the global tropics, which has become more challenging to discern as seas warm because of climate change.
Forecast Confidence

Temperature
Forecast confidence for temperatures is Medium-High. The General Circulation Models’ forecasts that Earth Sciences New Zealand leverages for its Seasonal Climate Outlook indicate warmer than average temperatures are the most likely outcome for the next three months. As local land – atmosphere interactions are not well represented in these global models, temperature especially for regions of high elevation might deviate from this general outlook.

Rainfall
Forecast confidence for rainfall is Medium. While the General Circulation Models broadly agree on the prevailing tropical to subtropical influences and the associated northeasterly to easterly flow anomalies for the forecast season, rainfall forecasts remain inherently more uncertain than temperature forecasts due to their sensitivity to the dominant flow direction and its interaction with local topography.
