Outlook Summary
- La Niña conditions have now emerged in the tropical Pacific.
- Both the Southern Oscillation Index (SOI) and the Relative Oceanic Niño Index (RONI) exceeded their respective La Niña thresholds for the month of October.
- More broadly, anomalies in ocean subsurface temperatures, atmospheric convection and circulation patterns across the Pacific are consistent with La Niña conditions.
- The coupling between the ocean and the atmosphere has been likely reinforced by a strong Madden-Julian-Oscillation (MJO) pulse that reached into the Maritime Continent at the end of October.
- Forecasts from Earth Science New Zealand’s (ESNZ) Relative Oceanic Niño Index (RONI) indicate a high probability (about 80%) of La Niña conditions prevailing during the November 2025 –January 2026 period. These new forecasts account for global warming trends in the tropics and are favoured by ESNZ. Traditional international guidance has around a 65% probability of La Niña conditions continuing through the forecast period.
- A minor Sudden Stratospheric Warming (SSW) event developed over Antarctica in September 2025, near the top of the atmosphere. The impacts of this SSW propagated downwards towards through the troposphere (the part of the atmosphere where our weather occurs) throughout October, greatly influencing the unsettled conditions of the month. While a transition to other climate drivers, e.g., La Niña, is expected over the next three months, the SSW may continue to influence conditions during November.
- November will begin with the first period of prolonged, settled weather this spring as an anticyclone (high pressure) dominates. However, it’s likely this will not prevail throughout the entire month, with probable periods of rain from both the north and west. Despite this, a dry lean for the month is expected for most areas, with only the northern North Island at particular risk of running wetter than normal for the month.
- The latter half of the three-month period is expected to see high pressure sit more frequently over or south of the South Island, resulting in an easterly quarter anomaly airflow over the country. Westerly fronts should be reduced in frequency, and there is an elevated risk of lows from the north drifting onto the country.
- The threat for heavy rain makers from the sub-tropics and tropics will be elevated, with the North Island most likely affected by such events.
- The southwest Pacific Tropical Cyclone (TC) season has officially started, ESNZ Tropical Cyclone Outlook for November 2025 – April 2026 indicates a normal or elevated risk for ex-TC interaction for New Zealand.
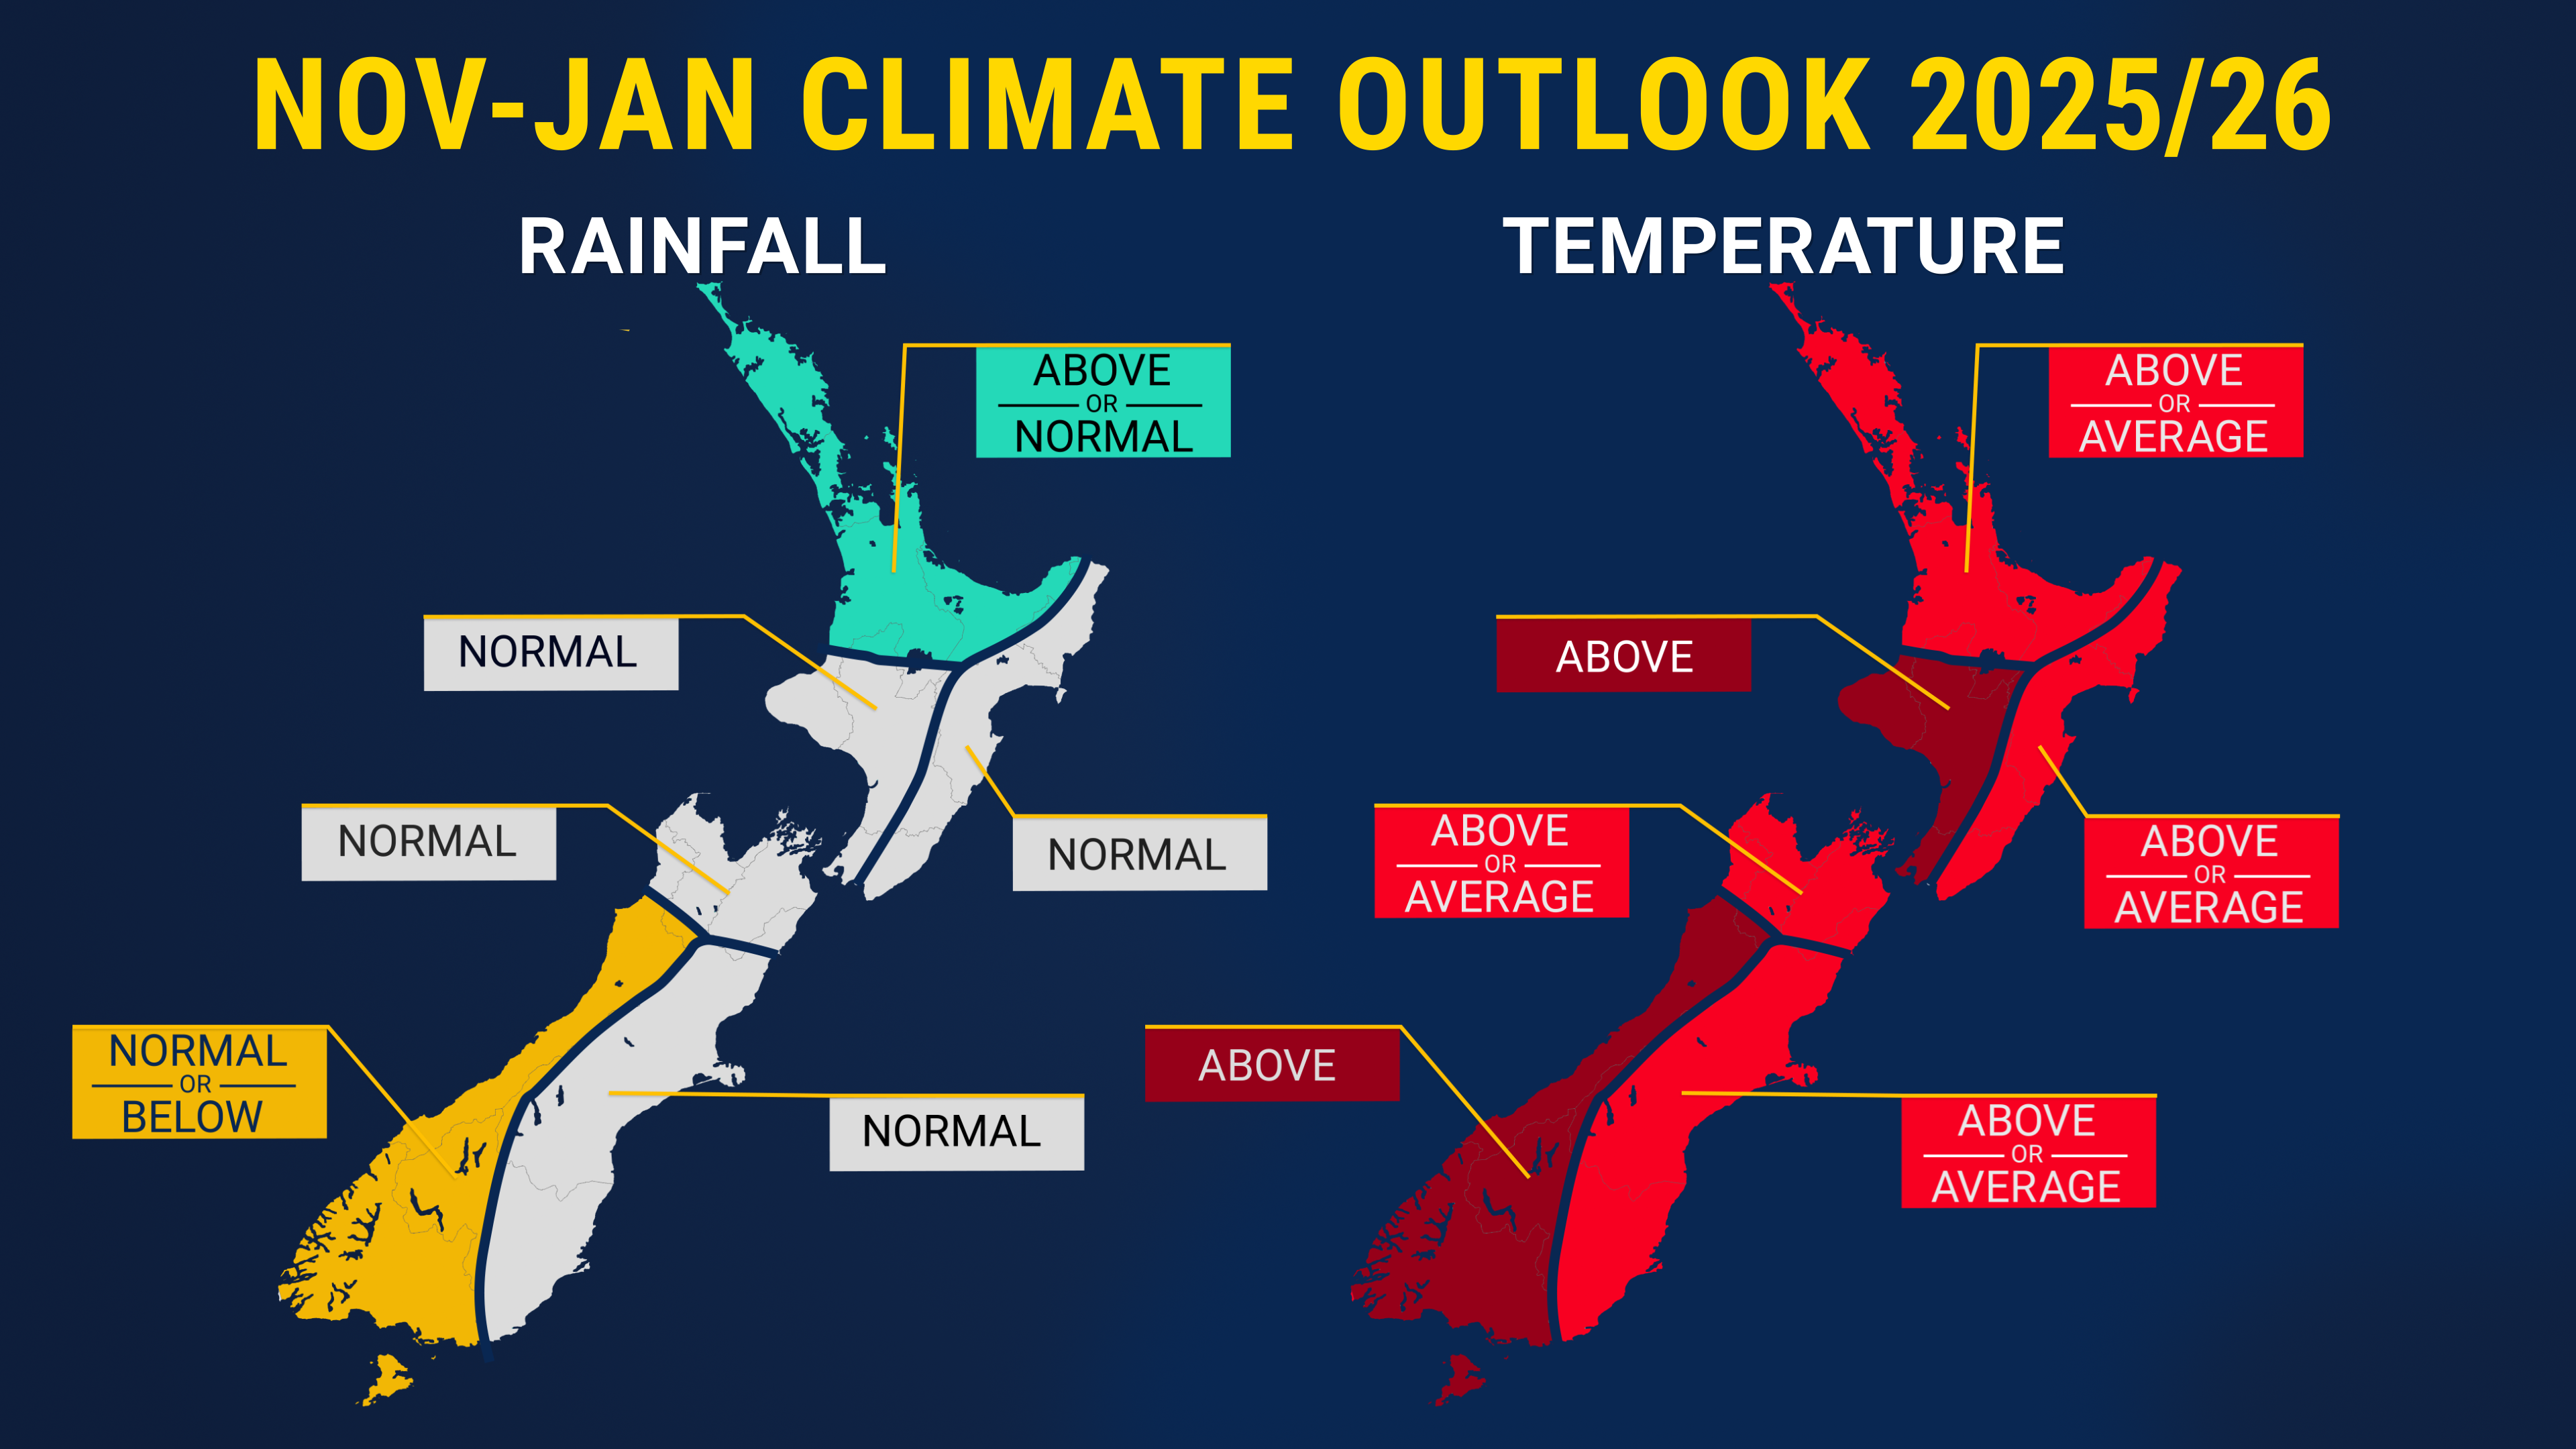
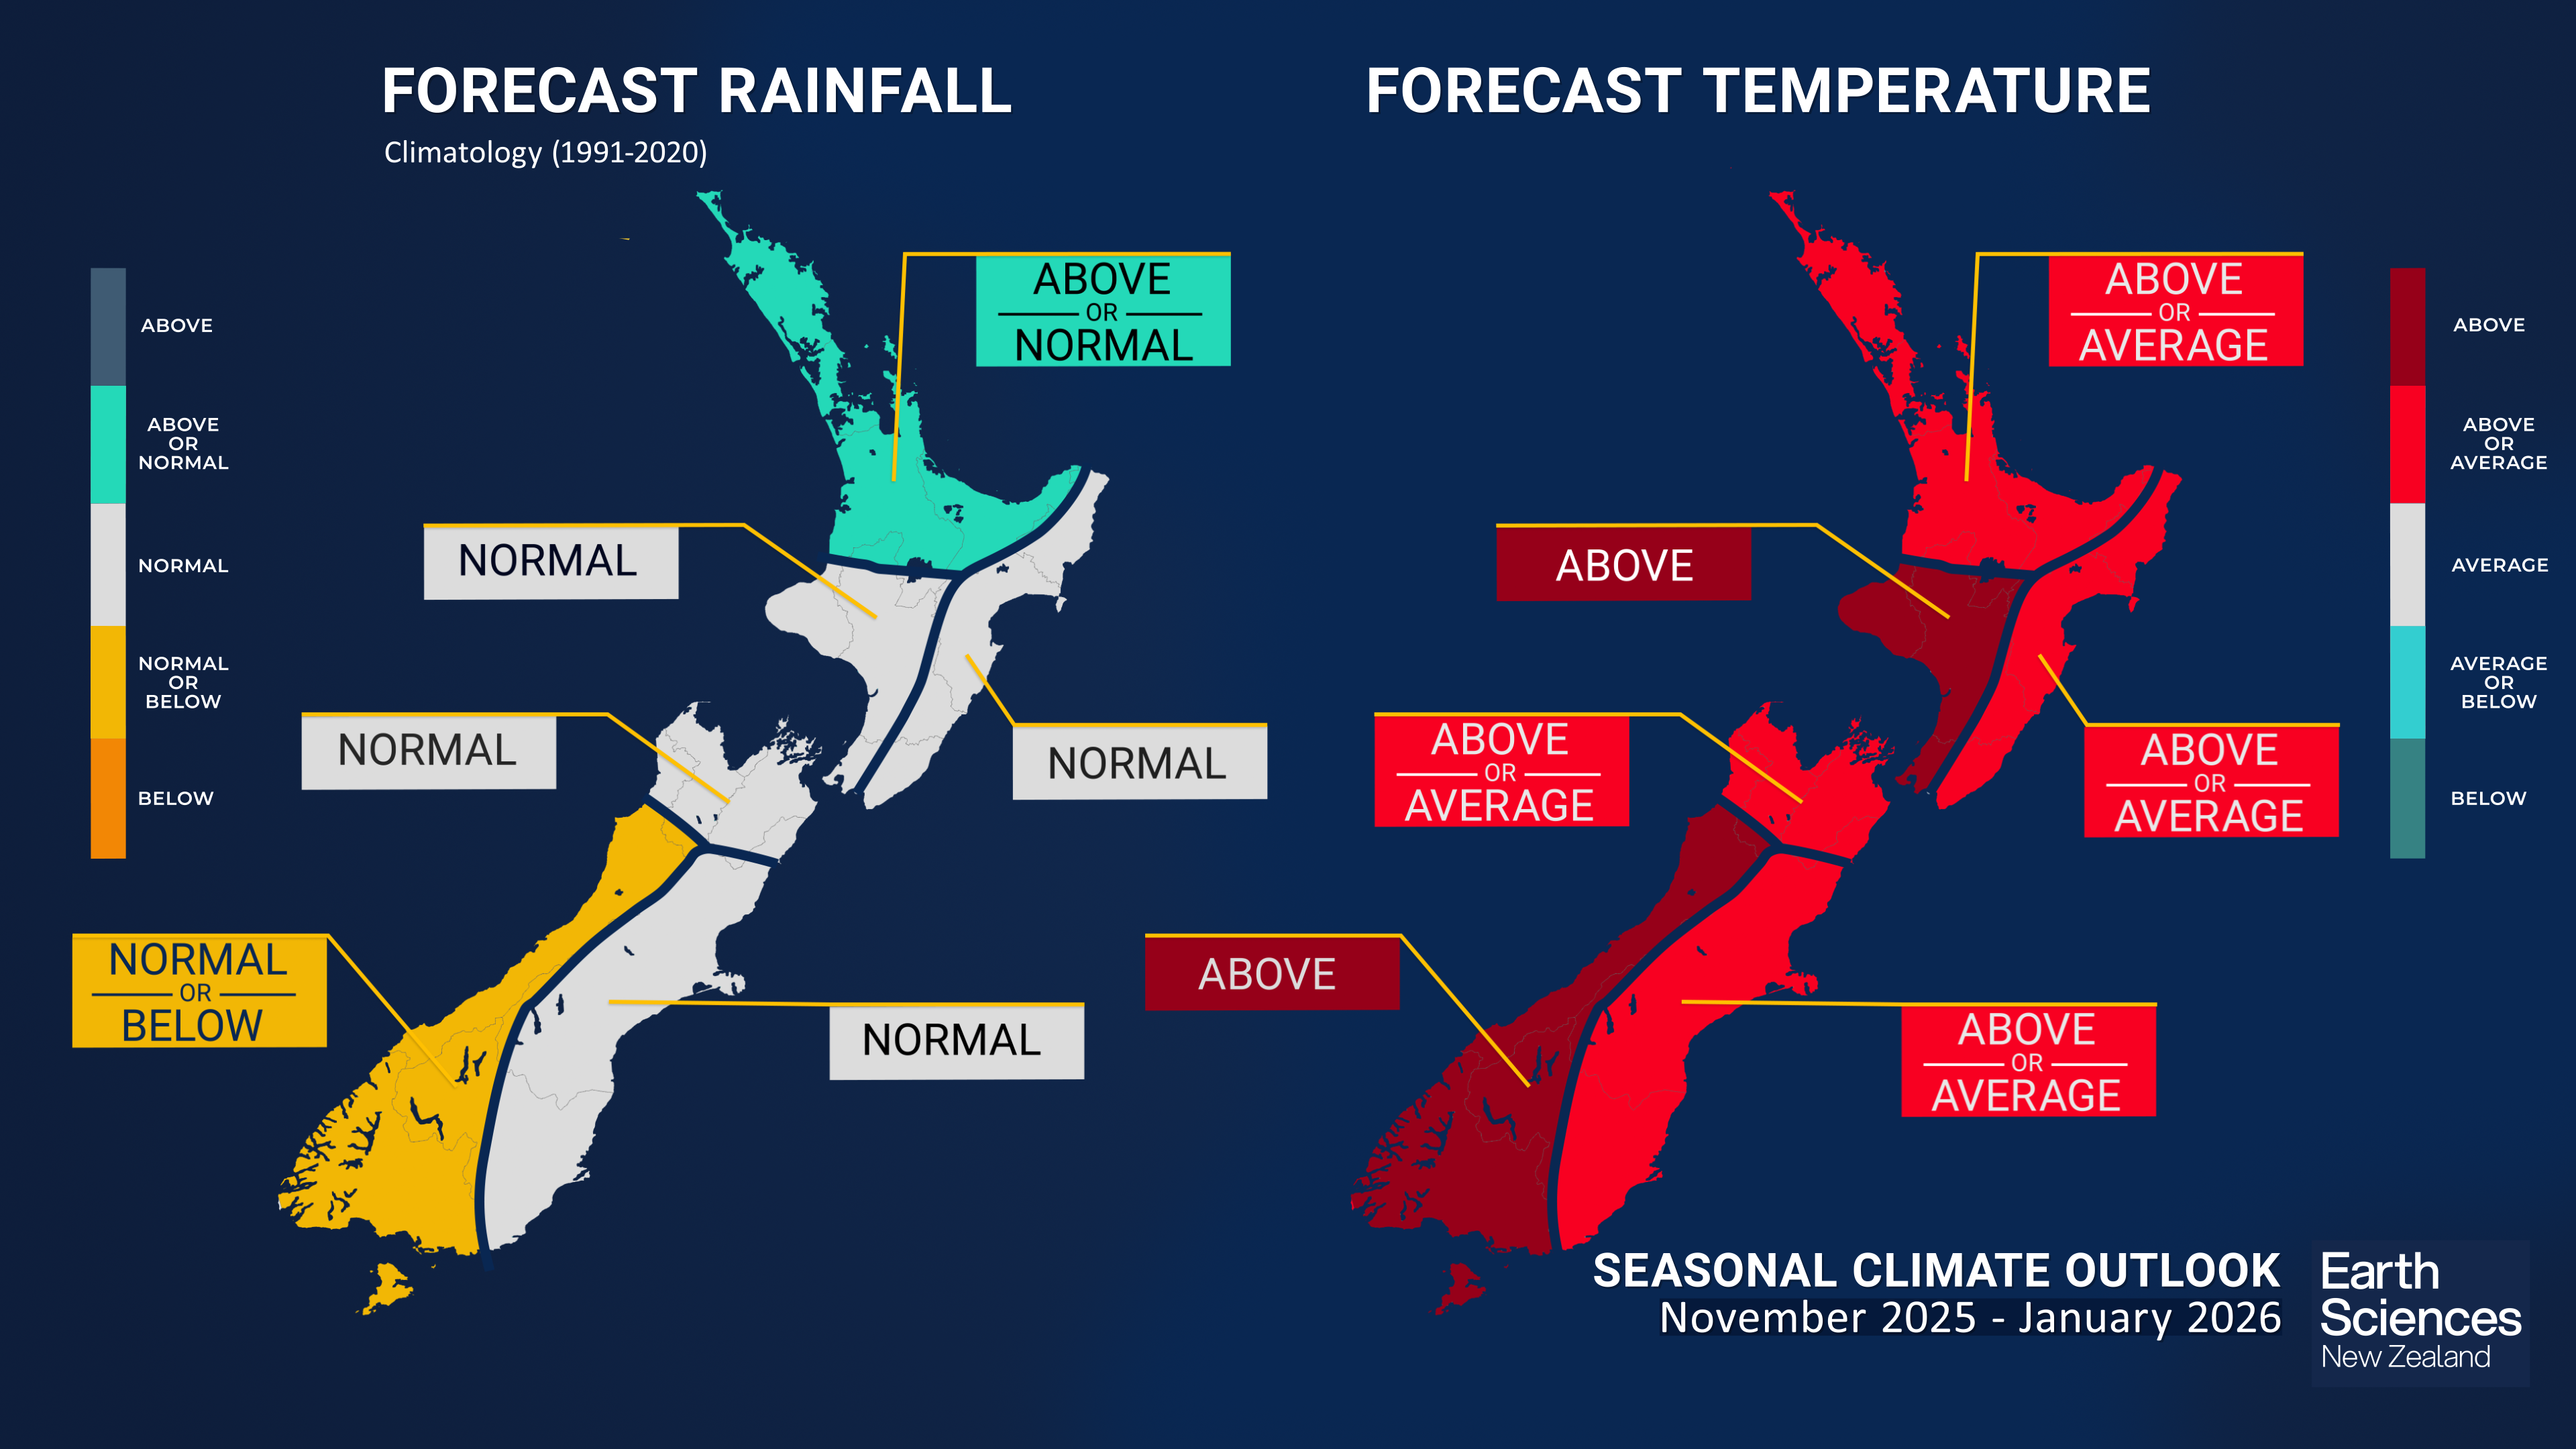
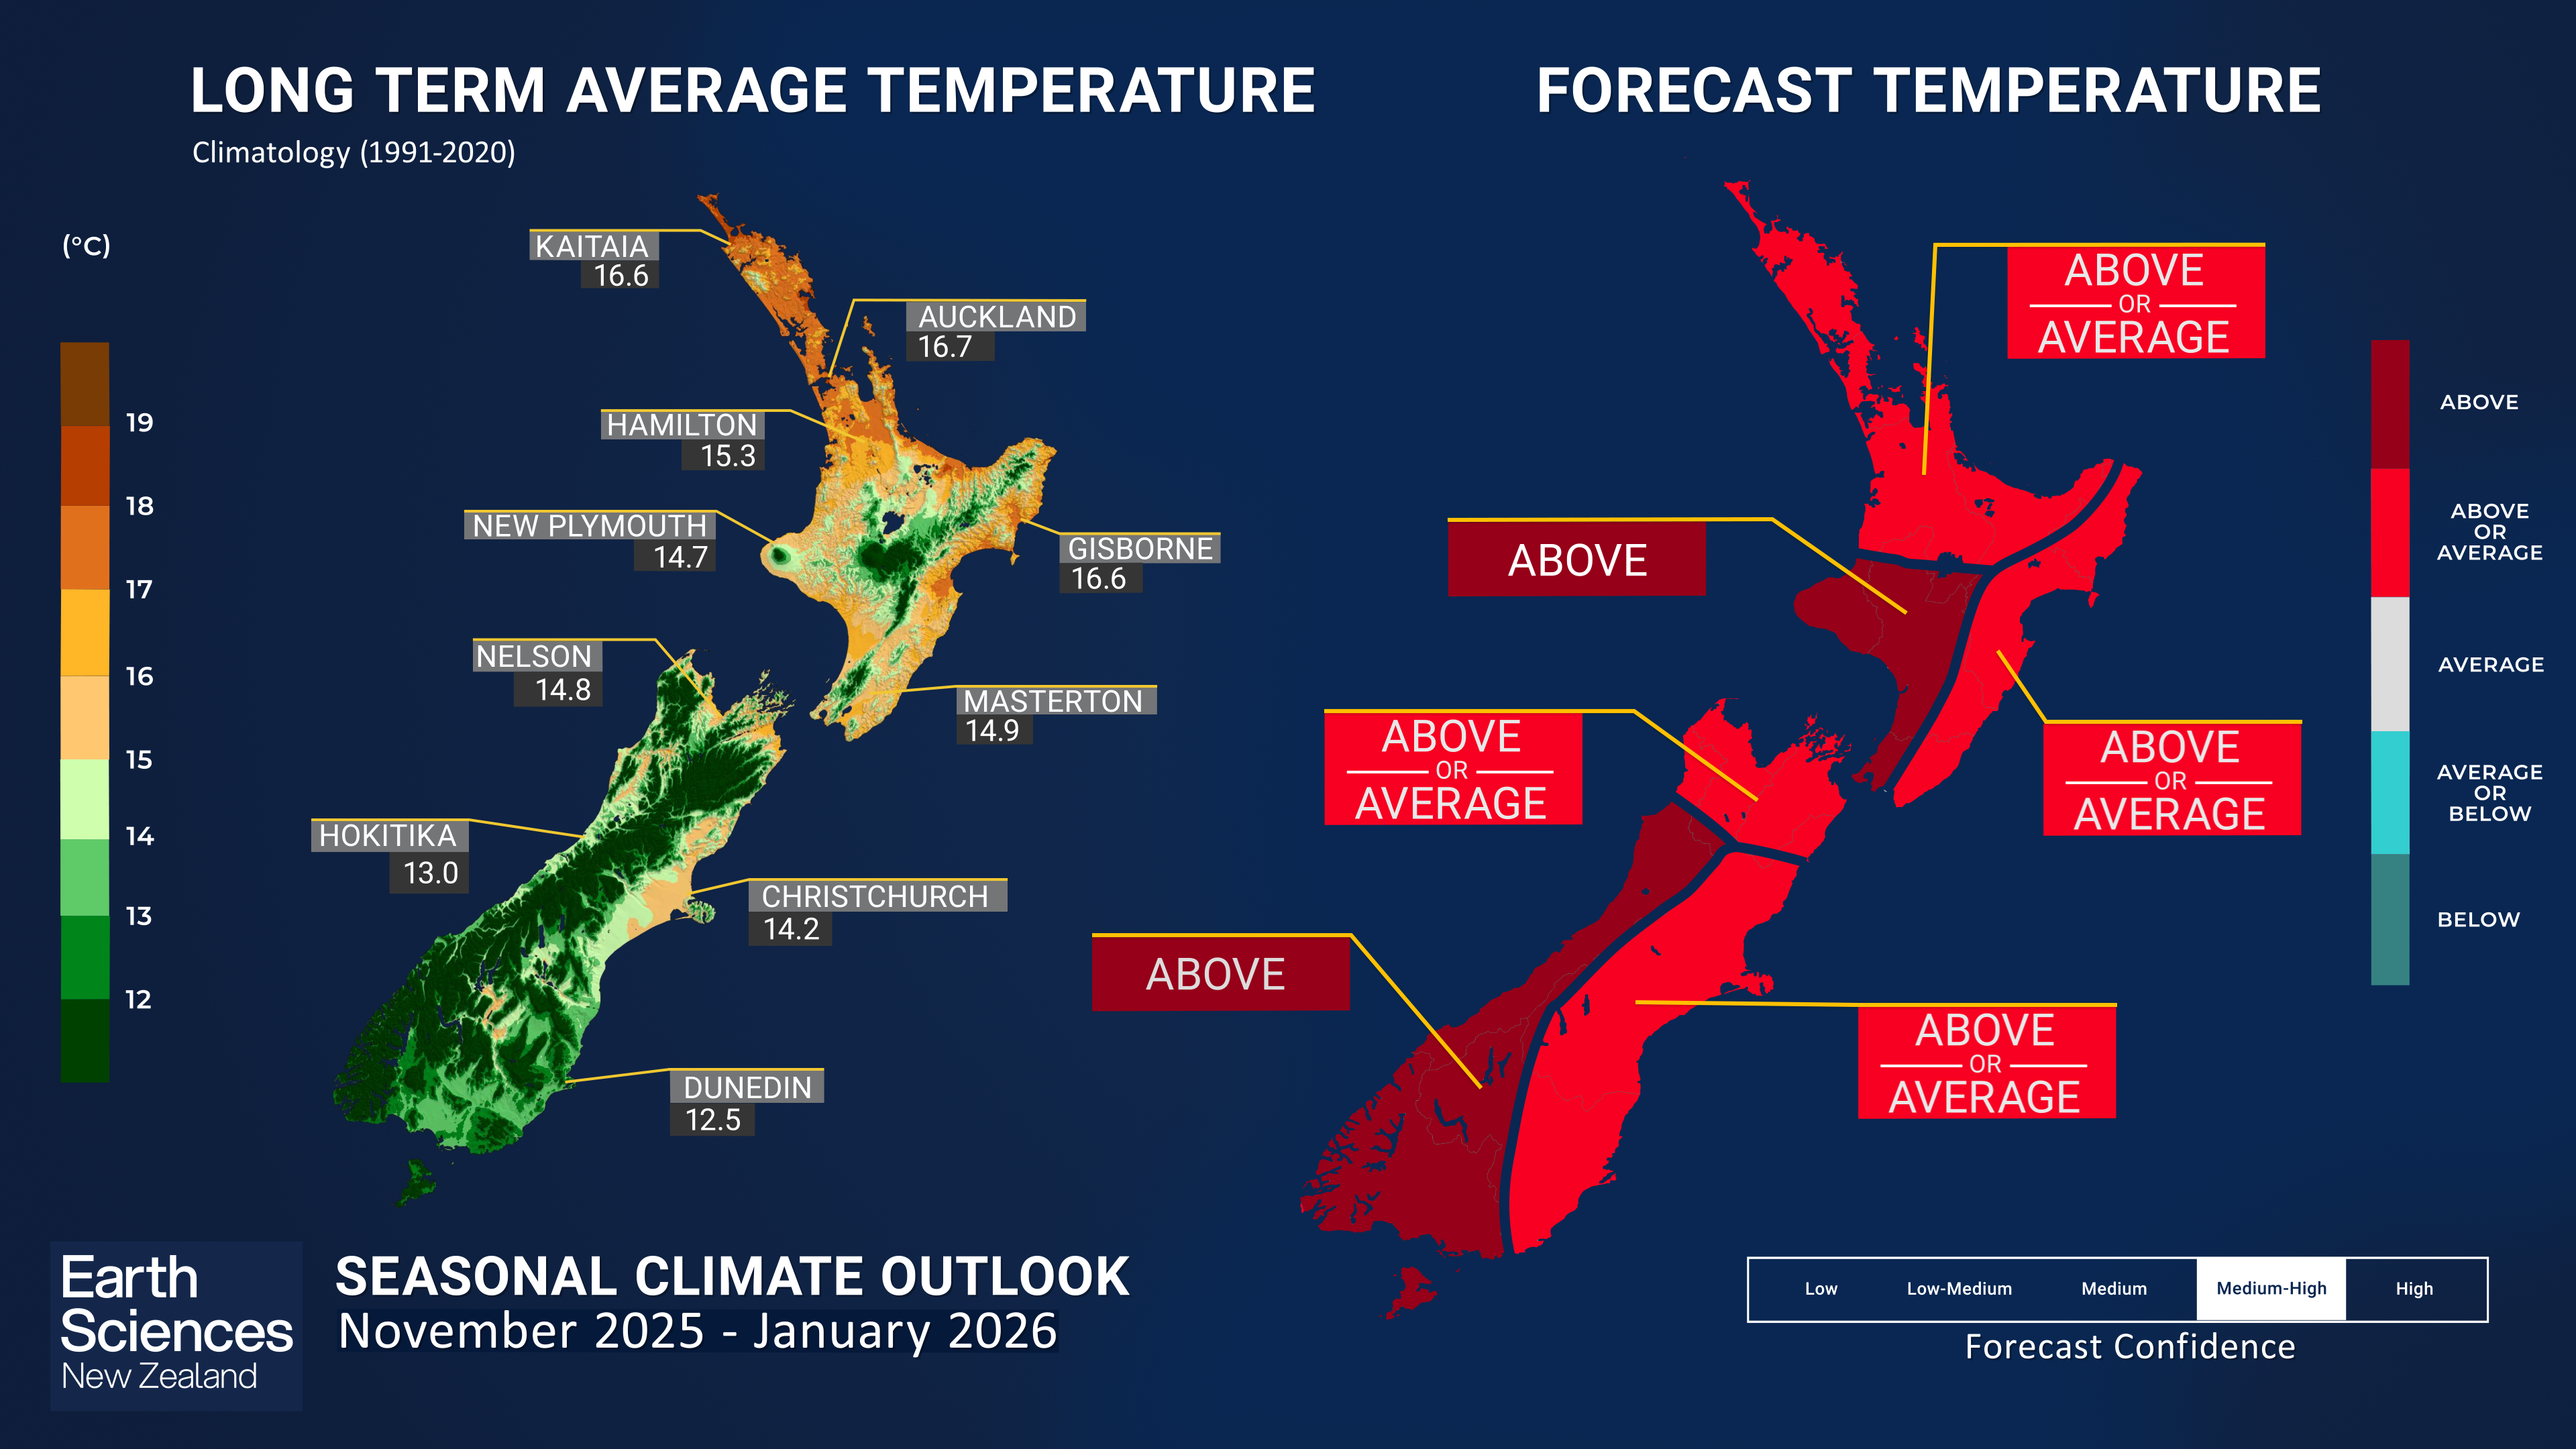
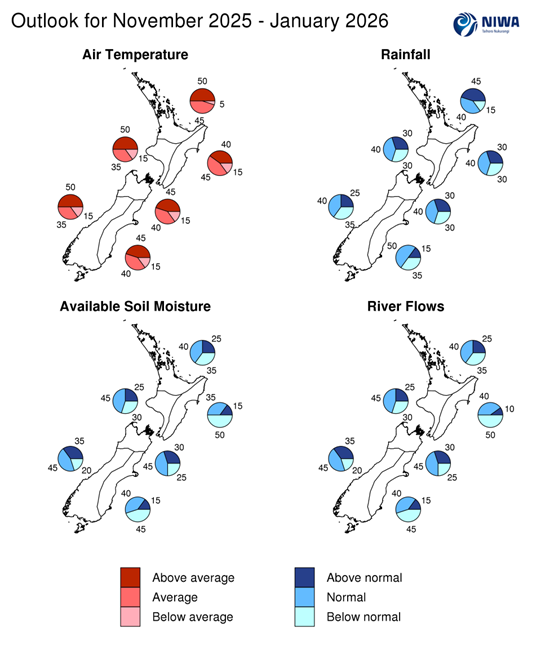
- Seasonal air temperatures are about equally likely to be near average or above average for all regions of New Zealand, except for the west of both islands, where above average temperatures are most likely.
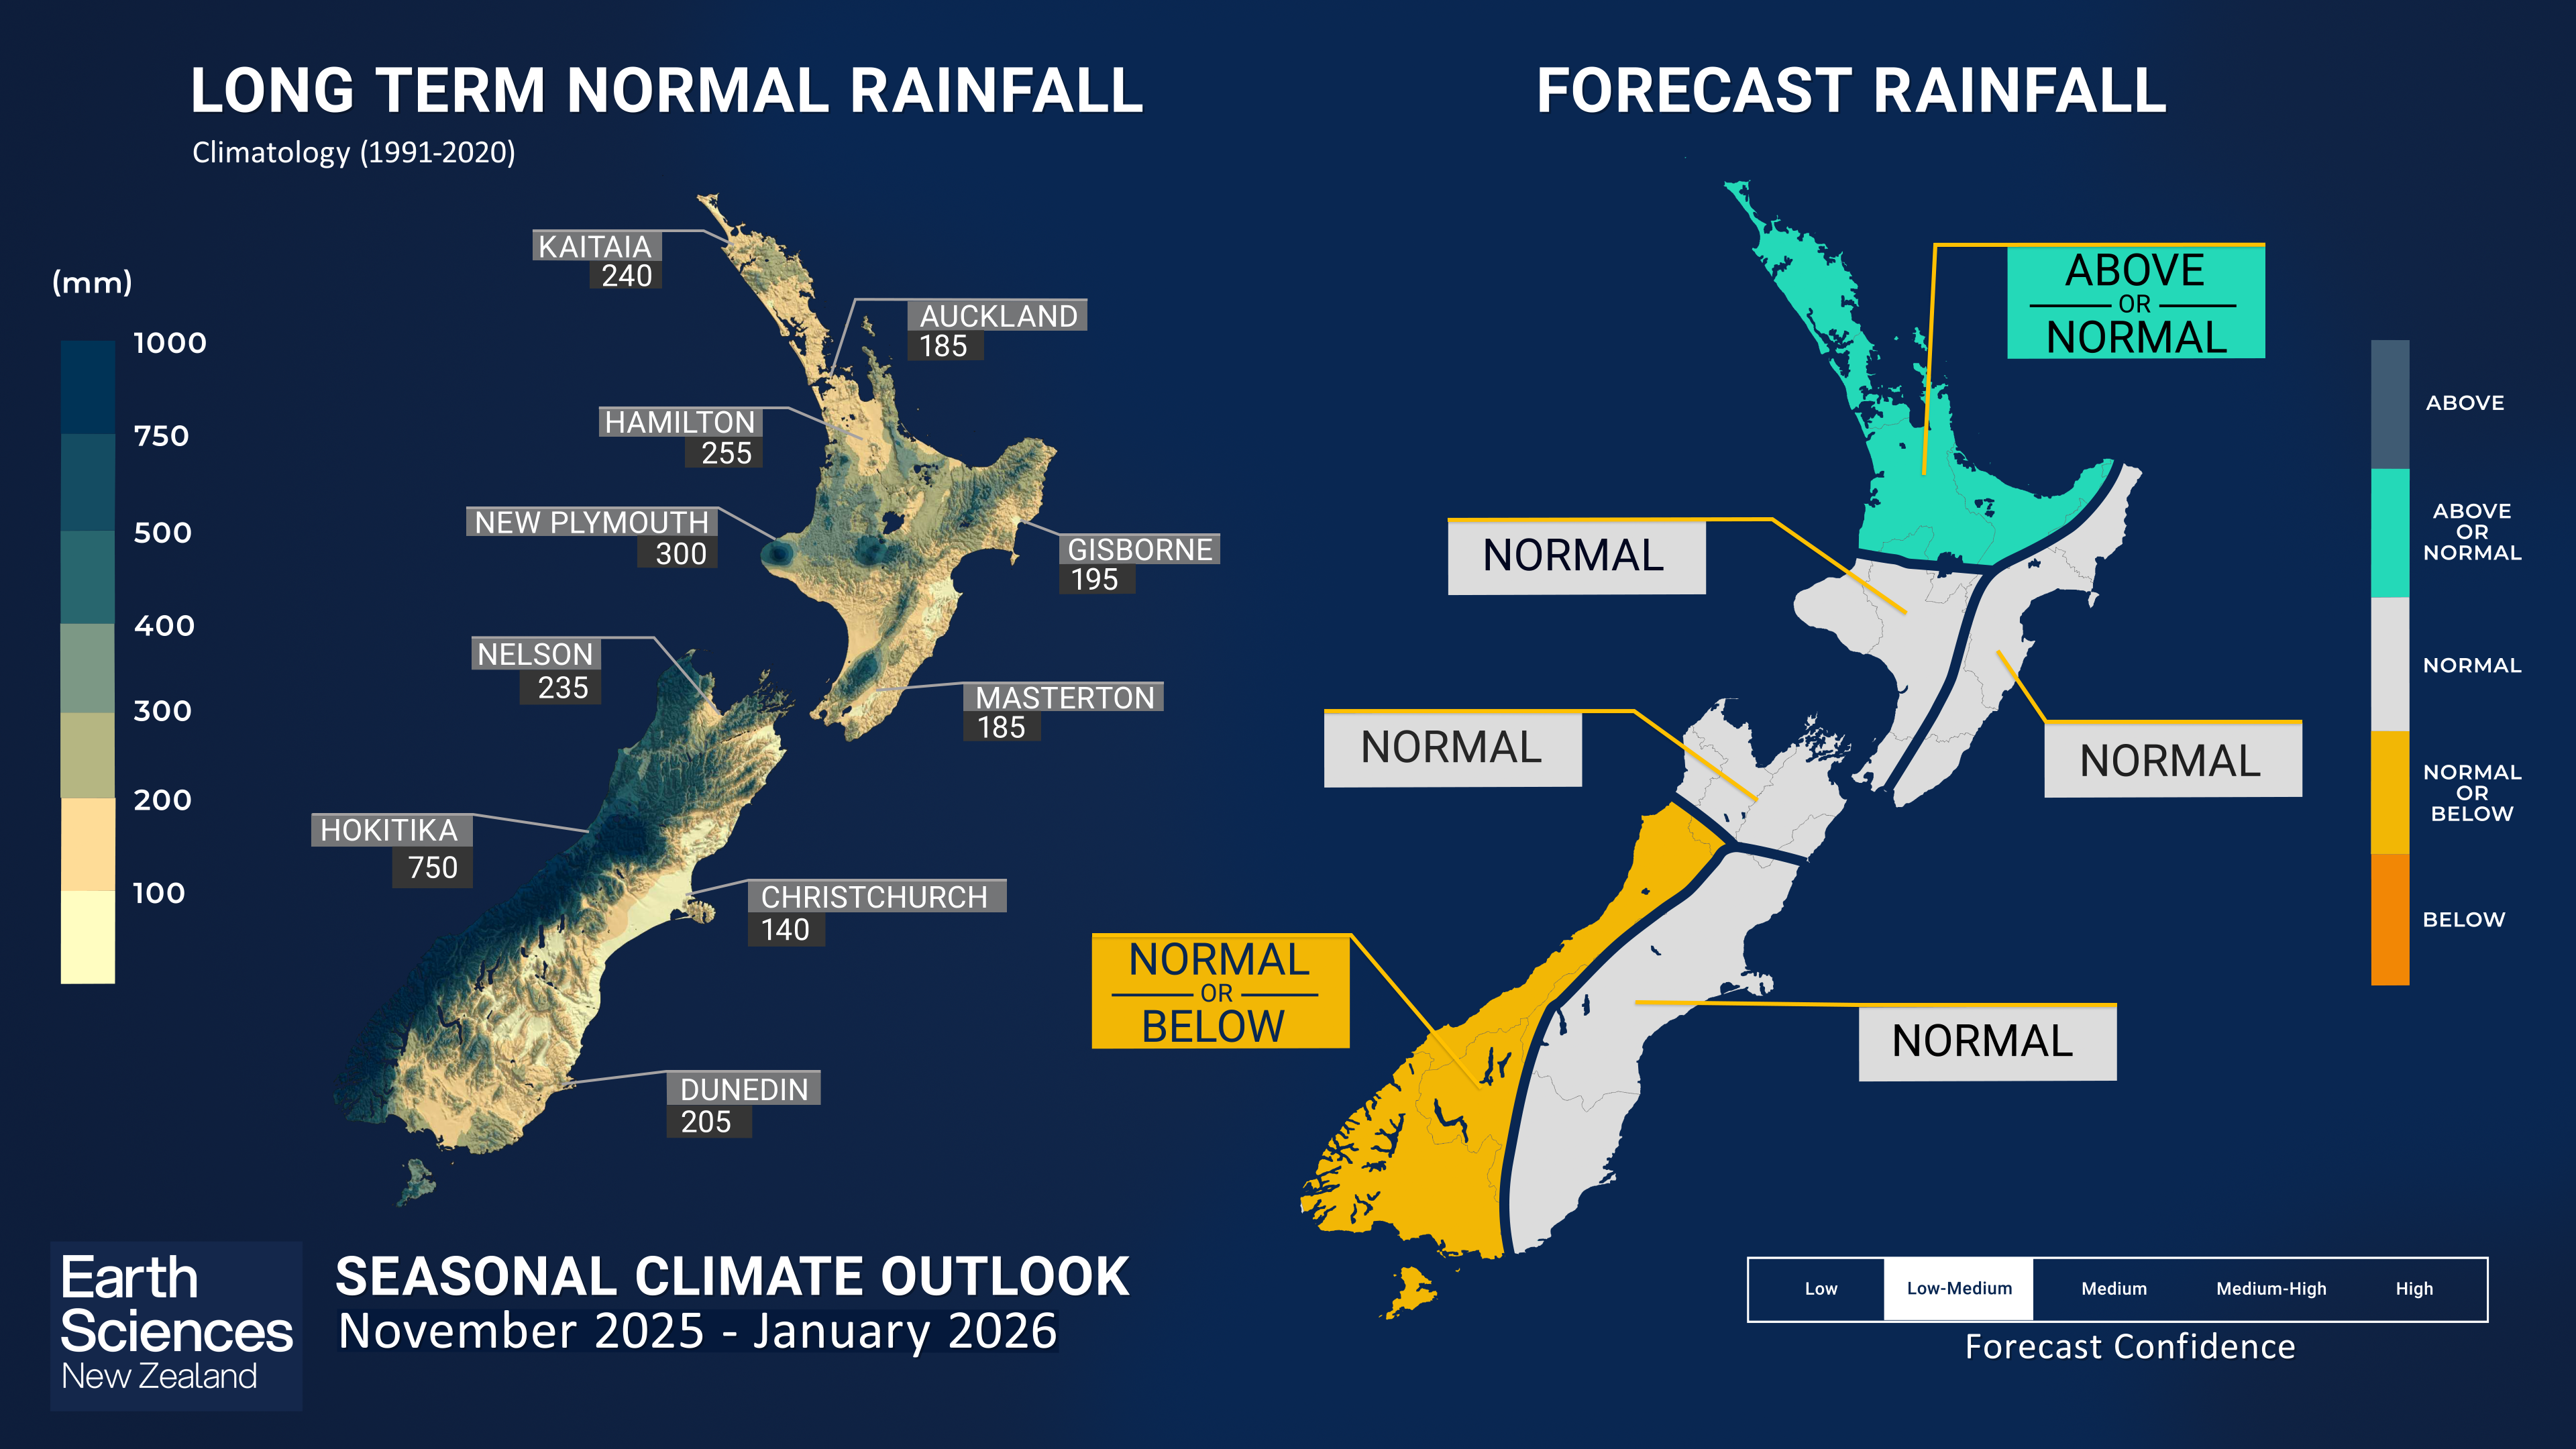
- November – January rainfall totals are expected to be near normal or above normal for the north of the North Island, and near normal or below normal for the west of the South Island. Near normal rainfall is forecast elsewhere, though the tercile distribution, or probability for other outcomes, in these regions reflects uncertainty in the outlook.
- During November 2025 – January 2026, soil moisture levels and river flows are forecast to be below normal for the east of the North Island, and near or below normal for the north of the North Island and east of the South Island. Near normal soil moisture levels and river flows are expected for the remaining regions of the country.
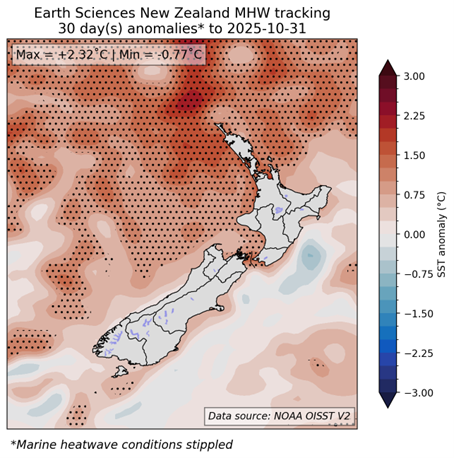
- On top of the cooling seen in September, SSTs cooled further around parts of New Zealand during October 2025, ending the long running marine heatwaves (MHW) conditions off the west coast of the South Island. MHW conditions persist off the upper North Island and are likely to continue. Seas off the east coast of both islands are currently experiencing below-average temperatures. Coupled General Circulation Model (GCM) forecasts suggest SSTs will be near or slightly above average for the remainder of the year, with warming expected later in the period, particularly off the east coast of the North Island. Monitor the SST update for updates.
Regional predictions for November 2025 – January 2026
The tables below show the probabilities (or percent chances) for each of three categories: above average, near average, and below average. In the absence of any forecast guidance there would be an equal likelihood (33% chance) of the outcome for any of the three categories. Forecast information from local and global guidance models is used to indicate the deviation from equal chance that is expected for the coming three-month period. All outlooks are for the three months averaged as a whole. During these three months, there will inevitably be relatively wet and dry periods, as well as hot and cold periods. The exact range in temperature and rainfall within each of the three categories varies with location and season. However, as a guide, the “near average” or middle category for the temperature predictions includes deviations up to ±0.5°C relative to the long-term mean, whereas for rainfall the “near normal” category lies between 80 percent and 120 percent of the long-term (1991-2020) mean.
Northland, Auckland, Waikato, Bay of Plenty
- Temperatures are about equally likely to be above average (50% chance) or near average (45% chance).
- Rainfall totals are about equally likely to be above normal (45% chance) or near normal (40% chance). Rain events originating from, or having connections with, the sub-tropics and tropics may increase the chances for heavy rainfall events.
- Soil moisture levels and river flows are about equally likely to be near normal (40% chance) or below normal (35% chance).
| Temperature | Rainfall | Soil moisture | River flows | ||
| Above average | 50 | 45 | 25 | 25 | |
| Near average | 45 | 40 | 40 | 40 | |
| Below average | 5 | 15 | 35 | 35 |
Central North Island, Taranaki, Whanganui, Manawatu, Wellington
Probabilities are assigned in three categories: above average, near average, and below average.
- Temperatures are most likely to be above average (50% chance).
- Rainfall totals are most likely to be near normal (40% chance). However, the chances for either below or above normal rainfall (each 30%) are elevated, indicating a degree of uncertainty in the outlook. Rain events originating from, or having connections with, the sub-tropics and tropics may increase the chances for heavy rainfall events.
- Soil moisture levels and river flows are most likely to be near normal (45% chance).
| Temperature | Rainfall | Soil moisture | River flows | |
| Above average | 50 | 30 | 25 | 25 |
| Near average | 35 | 40 | 45 | 45 |
| Below average | 15 | 30 | 30 | 30 |
Gisborne, Hawke’s Bay, Wairarapa
Probabilities are assigned in three categories: above average, near average, and below average.
- Temperatures are about equally likely to be near average (45% chance) or near average (40% chance).
- Rainfall totals are most likely to be near normal (40% chance). However, the chances for either below or above normal rainfall (each 30%) are elevated, indicating a degree of uncertainty in the outlook. Rain events originating from, or having connections with, the sub-tropics and tropics may increase the chances for heavy rainfall events.
- Soil moisture levels and river flows are about equally likely to be below normal (45% chance) or near normal (40% chance).
| Temperature | Rainfall | Soil moisture | River flows | |
| Above average | 40 | 30 | 15 | 10 |
| Near average | 45 | 40 | 35 | 40 |
| Below average | 15 | 30 | 50 | 50 |
Tasman, Nelson, Marlborough, Buller
Probabilities are assigned in three categories: above average, near average, and below average.
- Temperatures are about equally likely to be above average (45% chance) or near average (40% chance).
- Rainfall totals are most likely to be near normal (40% chance). However, the chances for either below or above normal rainfall (each 30%) are elevated, indicating a degree of uncertainty in the outlook.
- Soil moisture levels and river flows are most likely to be below normal (50% chance).
| Temperature | Rainfall | Soil moisture | River flows | |
| Above average | 45 | 30 | 30 | 30 |
| Near average | 40 | 40 | 45 | 45 |
| Below average | 15 | 30 | 25 | 25 |
West Coast, Southern Alps and foothills, inland Otago, Southland
Probabilities are assigned in three categories: above average, near average, and below average.
- Temperatures are most likely to be above average (50% chance).
- Seasonal rainfall totals are about equally likely to be near normal (40% chance) or below normal (35% chance).
- Soil moisture levels and river flows are most likely to be near normal (45% chance).
| Temperature | Rainfall | Soil moisture | River flows | |
| Above average | 50 | 25 | 35 | 35 |
| Near average | 35 | 40 | 45 | 45 |
| Below average | 25 | 35 | 20 | 20 |
Background
Sea surface temperatures (SSTs) in the central equatorial Pacific have continued to cool, and below average surface ocean waters dominate the equatorial Pacific over and east of the International Dateline. The traditional Niño 3.4 Index anomaly for the month of October was -0.53°C. All of the Niño indices are negative, moreover, the relative Niño 3.4 Index (RONI*) 30-day value (to 31 October) now exceeds the −0.7°C threshold typically utilised to define La Niña event, at −0.87°C.
The Southern Oscillation Index (SOI) in October 2025 increased dramatically compared to September, and crossed the conventional La Niña threshold, with a current month-to-date value of -1.2 standard deviation. While short term intra-seasonal variability – associated with the Madden-Julian Oscillation (MJO) – played a role in this recent trend, it signals enhanced coupling between the ocean and the atmosphere.
Subsurface ocean temperatures in the eastern Pacific cooled further in October, with anomalies intensifying to below -5°C at depths between 50 and 150 meters, east of approximately 120°W. Compared to last month, the core of these negative anomalies has shifted slightly eastward. In contrast, subsurface temperatures in the western Pacific remained above average. This east-west gradient in subsurface temperature anomalies continues to reflect ongoing oceanic La Niña conditions.
Accordingly, negative upper-ocean heat content anomalies (ocean temperature anomalies integrated over the top 300 m of the ocean) are present between 150°W and about 100°W, with anomalies exceeding -1.5°C.
In summary, coupling between the Pacific Ocean and the atmosphere is currently underway, with indices for both the oceanic and atmospheric components of ENSO having crossed La Niña thresholds, indicating that La Niña is currently present in the tropical Pacific. This coupling appears to have been reinforced in part by intraseasonal signals, particularly the MJO, which contributed temporarily to the strengthening of the ocean-atmosphere interactions.
The newly developed Relative Oceanic Niño Index forecasts (see https://niwa.co.nz/news/warming-oceans-prompt-major-overhaul-how-we-monitor-el-nino-and-la-nina) is favoured by Earth Sciences New Zealand, and gives an 80% chance of La Niña conditions persisting over the forecast period (November 2025 – January 2026). Meanwhile, the IRI / CPC forecasts, which are based on the traditional Nino 3.4 index also indicate that La Nina conditions are most likely to continue over the same period (62% chance).
The Southern Annular Mode (SAM) has been mostly negative during the month of October 2025 (with about 80% of days below -0.5 Standard Deviation), the latest 30 days SAM index value is negative (below 1 standard deviation) at -1.22 std. The forecast from the BoM is for the SAM to switch to neutral. Note that SAM forecasts are very uncertain beyond about two weeks.
The Indian Ocean Dipole (IOD) intensified, with a value of -1.1oC for the month of October, the strongest negative IOD recorded since 2008. According to guidance from the Australian Bureau of Meteorology, the IOD is expected to return in the neutral range by the end of the calendar year; October 2025 is therefore likely to mark the peak of this event.
During October 2025, a strong MJO pulse propagated across the Indian Ocean and reached the Maritime Continent (phase 4 – 5) late in the month. Concurrently, the suppressed component of this pulse was present in the central and western Pacific, and the associated trade wind enhancement likely enhanced the underlying La Niña state. Despite a rather large spread in the forecasts, the consensus from the sub-seasonal forecast models is for the enhanced convective envelope currently present over the Maritime Continent to propagate relatively slowly eastwards and to weaken. This forecast weakening may be a combination of maritime dynamic propagation dynamics, which models struggle with, combined with potential destructive interference with other coincident tropical waves in the near-term.
The minor SSW event that began in early September has likely concluded, with the polar stratosphere transitioning toward its summer state. Tropospheric circulation patterns observed in October 2025, in particular the strongly negative SAM and associated cool, wet anomalies in the southwest South Island, aligned with the expected lagged impacts of the SSW.
Local Sea Surface Temperatures (SSTs): SSTs cooled markedly around New Zealand during October. Notably, large areas east of both islands are now experiencing below-average temperatures. Meanwhile, the extent and intensity of marine heatwave (MHW) conditions off the west coast of the South Island have diminished. Coupled General Circulation Model (GCM) forecasts suggest SSTs will be near or slightly above average for the remainder of the year, with warming expected later in the period, particularly off the east coast of the North Island.
| North NI | +1.07°C |
| West NI | +1.01°C |
| East NI | +0.52°C |
| North SI | +0.73°C |
| West SI | +0.31°C |
| East SI | +0.52°C |
[*]The Relative Oceanic Niño 3.4 Index (RONI) is a modern way of measuring oceanic El Niño and La Niña that is complementary to traditional oceanic indices. While traditional oceanic indices like the Niño 3.4 Index monitor SSTs in one region, the RONI compares the average SST in the central equatorial Pacific with the average SST across the global tropics. Since tropical rainfall patterns respond to changes in ocean temperatures, this new relative index can help forecasters better determine if the equatorial Pacific is warmer or cooler than the rest of the global tropics, which has become more challenging to discern as seas warm because of climate change.
Forecast Confidence
Temperature
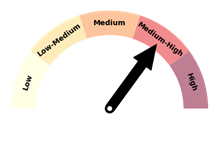
Forecast confidence for temperatures is Medium-High. The shift toward an easterly or northeasterly air flow will generally favour warmer-than-average temperatures across most regions, particularly in the west. However, this pattern may occasionally prevent daytime temperatures from reaching their typical maximums.
Rainfall
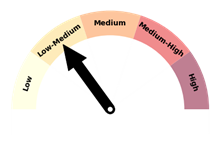
Forecast confidence for rainfall is Low-Medium. Early in the outlook period, the timing and nature of the transition away from recent westerly conditions introduces uncertainty, then later in the season the prime uncertainty originates with the southward extent of the subtropical low-pressure anomaly forecast to the north of the country.
