Outlook summary
- El Niño conditions have now been reached in the tropical Pacific atmosphere and ocean, according to criteria assessed by Earth Sciences New Zealand. The event remains in its early stages; impacts on New Zealand’s weather patterns are yet to be fully felt but are anticipated later in the year.
- Air flow patterns are expected to tend towards a westerly flow anomaly, characteristic of El Niño conditions, as the season progresses. Transitional behaviour from June is expected to extend into at least part of July, with clear westerly-quarter flow anomalies becoming more apparent later in the forecast period.
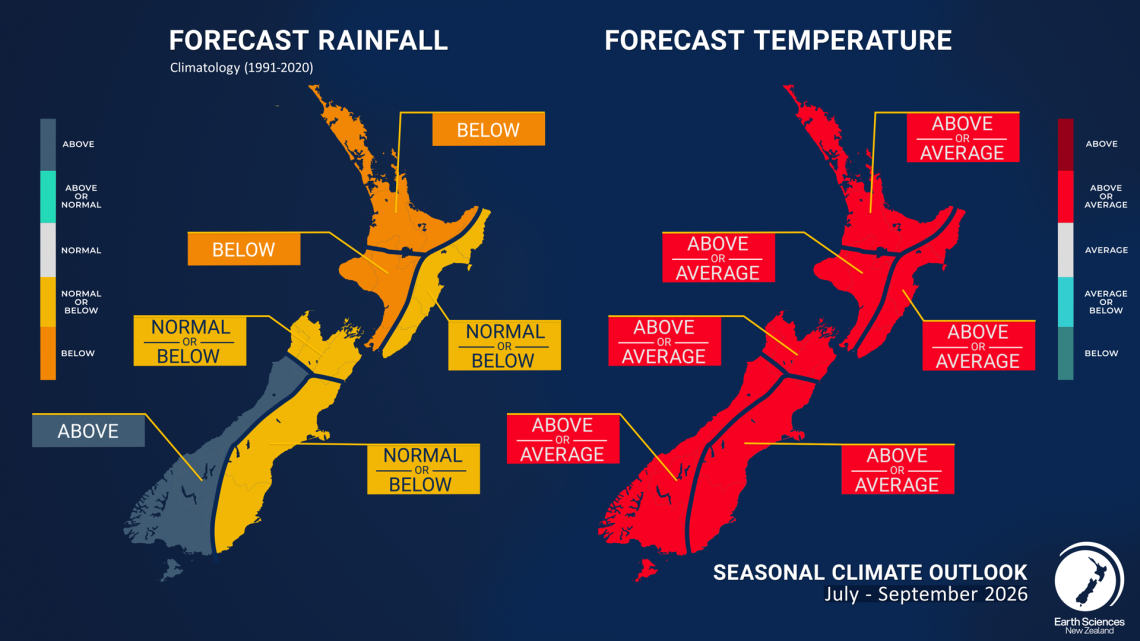
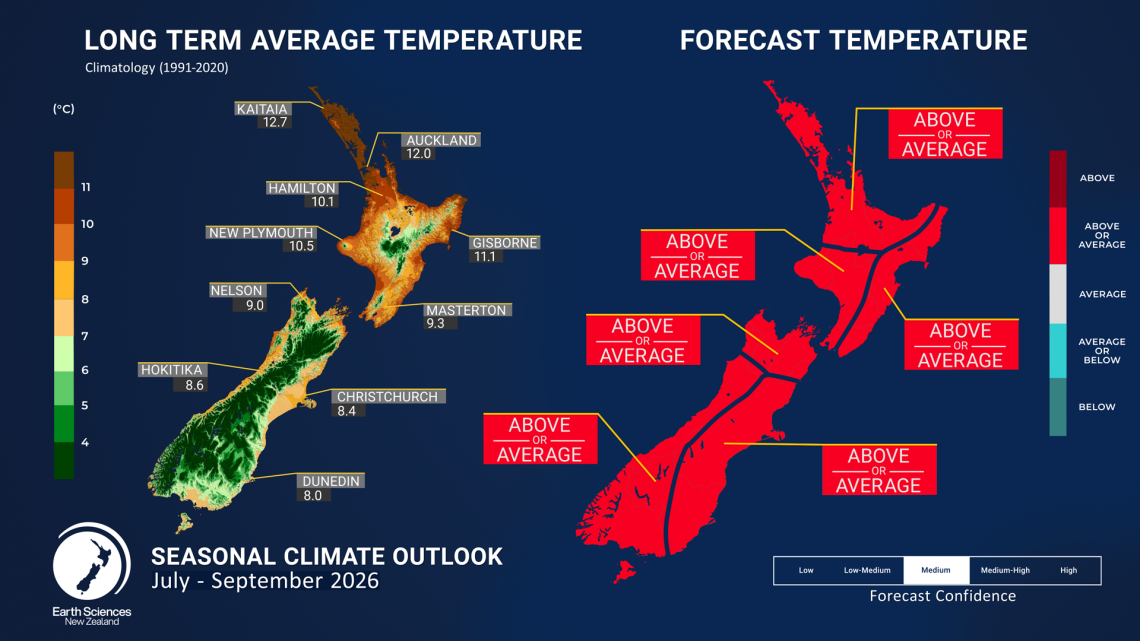
- Seasonal air temperatures for July – September 2026 are about equally likely to be near average or above average for all New Zealand regions. Although cold snaps and frosts are expected to occur.
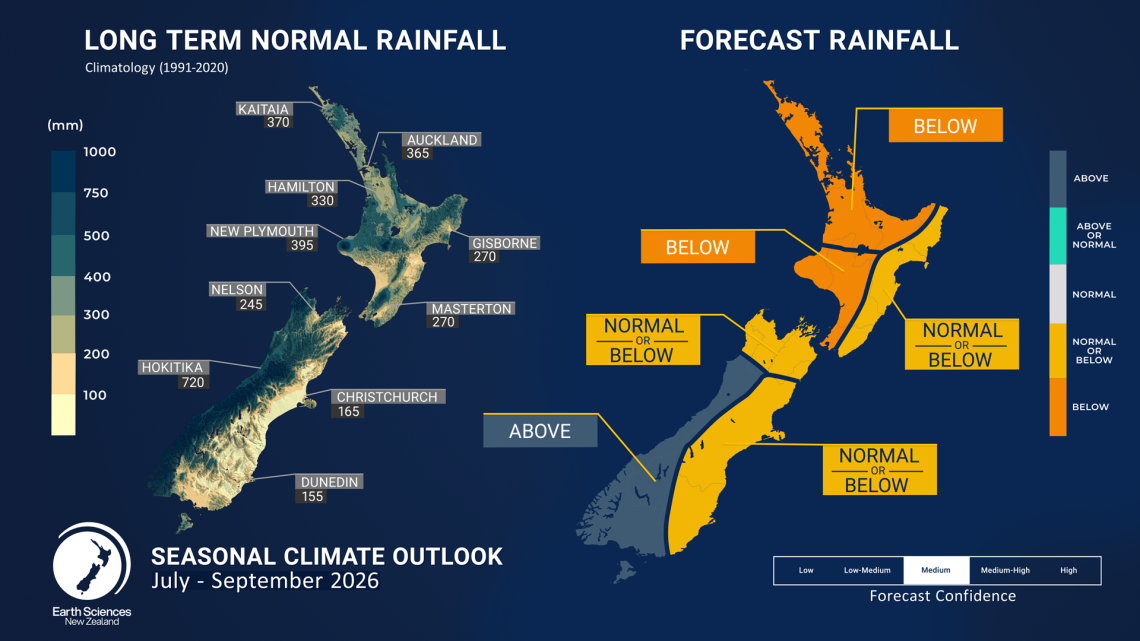
- Rainfall totals for July – September 2026 are about equally likely to be near normal or below normal for the north and east of the South Island, and the east of the North Island. Rainfall is most likely to be below normal for the remainder of the North Island. Meanwhile, rainfall is most likely to be above normal for the west of the South Island.
- New Zealand has experienced several heavy rain events from the north over the past year. In the coming months, these northerly rain events are expected to become less frequent, with the heavy rain threat shifting toward the western and lower South Island.
- The prospect of below normal winter rainfall in several regions is likely to translate to below normal groundwater recharge, creating challenges for water-reliant sectors.
- During July – September 2026, soil moisture levels and river flows are expected to be near normal or below normal for the east and north of both islands, and the west of the North Island. In the west of the South Island, they are expected to be near normal.
- Warmer than average subsurface ocean temperature anomalies have continued to intensify and expand in the tropical Pacific – this means that a significant El Niño event is increasingly likely.
- There is about an 80% chance for El Niño to reach or exceed strong intensity over the outlook period (July – September 2026).
- El Niño–related influences on regional weather patterns are expected to become more apparent later in the season as ENSO signals strengthen.
- In a New Zealand context, later this winter and especially into spring, this is expected to translate to periods favouring active weather including unusually windy conditions, along with notable temperature variability.
- Peak El Niño conditions are expected to occur during the austral summer of 2026–27, with the potential for this event to have significant impacts.
- Sudden Stratospheric Warmings (SSW) are historically rare in the Southern Hemisphere, but in recent years have become more common. Predictability is limited, but there is justification for enhanced monitoring over the coming weeks. If an SSW does occur, its impacts on New Zealand weather patterns can be delayed by a month or more.
- Out-of-season Southwest Pacific tropical cyclones (July–October) are extremely rare. When they do occur, it is almost always under El Niño conditions. This remote risk does not currently factor into New Zealand's current Seasonal Climate Outlook, although active monitoring remains in place.
Regional predictions for July – September 2026
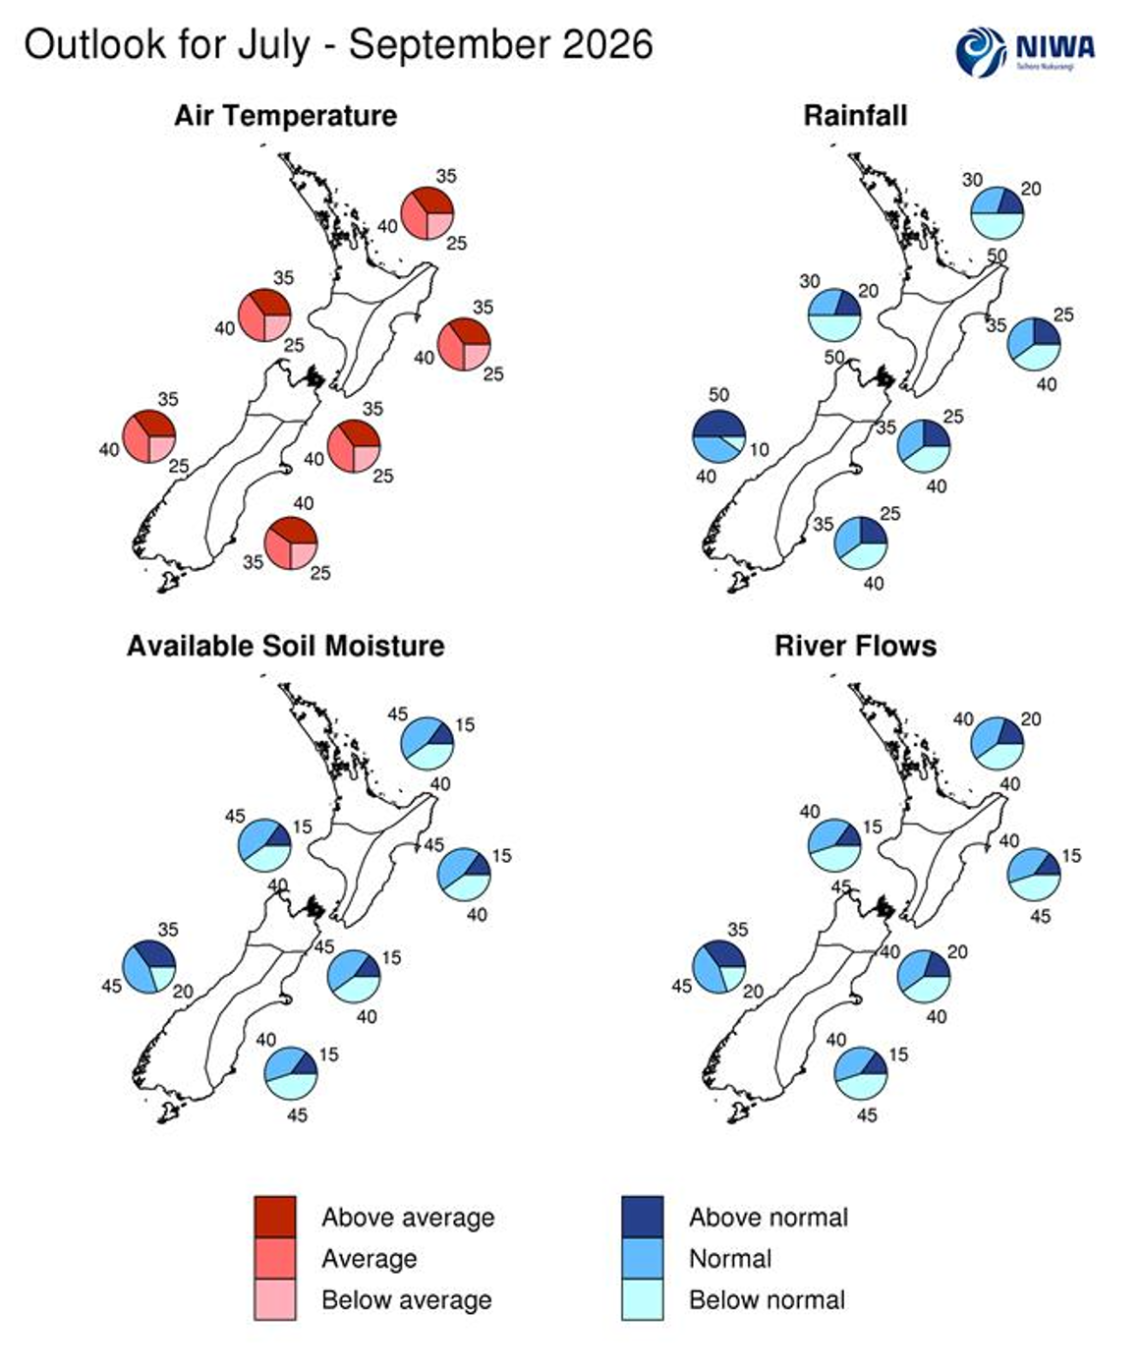
The tables below show the probabilities (or percent chances) for each of three categories: above average, near average, and below average. In the absence of any forecast guidance there would be an equal likelihood (33% chance) of the outcome for any of the three categories. Forecast information from local and global guidance models is used to indicate the deviation from equal chance that is expected for the coming three-month period. All outlooks are for the three months averaged as a whole. During these three months, there will inevitably be relatively wet and dry periods, as well as hot and cold periods. The exact range in temperature and rainfall within each of the three categories varies with location and season. However, as a guide, the “near average” or middle category for the temperature predictions includes deviations up to ±0.5°C relative to the long-term mean, whereas for rainfall the “near normal” category lies between 80 percent and 120 percent of the long-term (1991-2020) mean.
Northland, Auckland, Waikato, Bay of Plenty
Probabilities are assigned in three categories: above average, near average, and below average.
- Temperatures are about equally likely to be near average (40% chance) or above average (35% chance).
- Rainfall totals are most likely to be below normal (50% chance).
- Soil moisture levels and river flows are about equally likely to be near normal (40 - 45% chance) or below normal (40% chance).
| Temperature | Rainfall | Soil moisture | River flows | |
| Above average | 35 | 20 | 15 | 20 |
| Near average | 40 | 30 | 45 | 40 |
| Below average | 25 | 50 | 40 | 40 |
Central North Island, Taranaki, Whanganui, Manawatu, Wellington
Probabilities are assigned in three categories: above average, near average, and below average.
- Temperatures are about equally likely to be near average (40% chance) or above average (35% chance).
- Rainfall totals are most likely to be below normal (50% chance).
- Soil moisture levels and river flows are about equally likely to be near normal (40 - 45% chance) or below normal (40 - 45% chance).
| Temperature | Rainfall | Soil moisture | River flows | |
| Above average | 35 | 20 | 15 | 15 |
| Near average | 40 | 30 | 45 | 40 |
| Below average | 25 | 50 | 40 | 45 |
Gisborne, Hawke’s Bay, Wairarapa
Probabilities are assigned in three categories: above average, near average, and below average.
- Temperatures are about equally likely to be near average (40% chance) or above average (35% chance).
- Rainfall totals are about equally likely to be below normal (40% chance) or near normal (35% chance) for the outlook period as a whole, but there is a risk of some significant rainfall occurring early in July.
- Soil moisture levels and river flows are about equally likely to be near normal (40 - 45% chance) or below normal (40 - 45% chance).
| Temperature | Rainfall | Soil moisture | River flows | |
| Above average | 35 | 25 | 15 | 15 |
| Near average | 40 | 35 | 45 | 40 |
| Below average | 25 | 40 | 40 | 45 |
Tasman, Nelson, Marlborough, Buller
Probabilities are assigned in three categories: above average, near average, and below average.
- Temperatures are about equally likely to be near average (40% chance) or above average (35% chance).
- Rainfall totals are about equally likely to be below normal (40% chance) or near normal (35% chance).
- Soil moisture levels and river flows are about equally likely to be near normal (40 - 45% chance) or below normal (40% chance).
| Temperature | Rainfall | Soil moisture | River flows | |
| Above average | 35 | 25 | 15 | 20 |
| Near average | 40 | 35 | 45 | 40 |
| Below average | 25 | 40 | 40 | 40 |
West Coast, Southern Alps and foothills, inland Otago, Southland
Probabilities are assigned in three categories: above average, near average, and below average.
- Temperatures are about equally likely to be near average (40% chance) or above average (35% chance).
- Rainfall totals are most likely to be above normal (50% chance). Chances for active weather (heavy rain and strong wind) are expected to increase later in the winter season, and especially into spring.
- Soil moisture levels and river flows are most likely to be near normal (45% chance).
| Temperature | Rainfall | Soil moisture | River flows | |
| Above average | 35 | 50 | 35 | 35 |
| Near average | 40 | 40 | 45 | 45 |
| Below average | 25 | 10 | 20 | 20 |
Coastal Canterbury and the nearby plains, east Otago
Probabilities are assigned in three categories: above average, near average, and below average.
- Temperatures are about equally likely to be above average (40% chance) or near average (35% chance). Chances for increased temperature variability, i.e., large temperatures swings, and unusually windy periods, are likely to increase later in the winter season and especially during spring.
- Rainfall totals are about equally likely to be below normal (40% chance) or near normal (35% chance), for the outlook period as a whole, but there is a risk of some significant rainfall occurring early in July.
- Soil moisture levels and river flows are about equally likely to be below normal (45% chance) or near normal (40% chance).
The full probability breakdown is:
| Temperature | Rainfall | Soil moisture | River flows | |
| Above average | 40 | 25 | 15 | 15 |
| Near average | 35 | 35 | 40 | 40 |
| Below average | 25 | 40 | 45 | 45 |
Graphical representation of the regional probabilities
Background
The Southern Oscillation Index (SOI) in June 2026 was persistently and significantly negative, crossing well beyond the El Niño threshold. Based on daily data through 29 June, the monthly SOI value was −1.73.
Sea Surface Temperature (SST) anomalies across the central equatorial Pacific remain positive along the entire Equator east of the International Date Line. The Relative Niño 3.4 Index (RONI*) averaged over the past 30 days (ending 29 June) is +1.07°C, now well above the El Niño threshold. The RONI is projected to exceed the strong El Niño threshold of +1.5°C by the end of the outlook period. The current pattern of equatorial SST anomalies is consistent with the rapid development of a “canonical” El Niño event - similar to those of 1997/98 and 1982/83 - in which the strongest warming is concentrated in the eastern, rather than central, Pacific.
During June 2026, subsurface ocean temperatures across the equatorial Pacific were markedly above average and intensified further, particularly in the eastern Pacific (east of ~160°W). Temperature anomalies locally exceeded +7°C, occurring between depths of around 150 m (centred near 150°W) and 50 m (close to the South American coast). These subsurface anomalies are increasingly being expressed at the surface, with June showing a clearer and more coherent surface warming signal emerging across the eastern and central Pacific, reflected in the sharp increase in the Relative Niño 3.4 Index.
Positive upper-ocean heat content anomalies (0-300 m) remain firmly established along the Equator east of the International Date Line. The magnitude of this subsurface heat reservoir is consistent with other observed indicators and with dynamical and statistical forecast guidance which together suggest that the ongoing El Niño is likely to intensify further and reach at least strong, and likely very strong, thresholds later in the year.
Rainfall and Convection: During June 2026, enhanced convection and rainfall – indicated by negative outgoing longwave radiation (OLR) anomalies – was primarily constrained to the intertropical convergence zone (ITCZ) through the equatorial Pacific. Supressed convection and rainfall – indicated by positive OLR anomalies – was widespread across the Indian subcontinent and the maritime continent. This rainfall pattern diverged from May, and more strongly resembled an El Niño-like configuration.
Trade winds weakened significantly throughout the Pacific, and reversed entirely at times. This development was as expected, and is likely to signal a long-lasting change.
In summary, oceanic conditions are in an El Niño configuration, and setting the stage for further development in the very near future, with particularly significant warmth (positive heat content anomalies) stored in the ocean along the Equator in the Pacific. These signals are only growing ever-stronger with time. Meanwhile, the atmosphere is also increasingly resembling El Niño. A fully-coupled El Niño has therefore emerged, although stronger ocean and atmospheric responses are anticipated as the event develops further.
The Relative Oceanic Niño Index forecasts indicate a 100% chance for El Niño conditions over the next three-month period (July – September 2026). The IRI/CPC forecasts also support this outlook. Further strengthening of the event is likely far beyond the outlook period, with a strong possibility of this developing into an historic event during spring or summer.
The Southern Annular Mode (SAM) was frequently positive during June 2026; this partly contributed to the very warm conditions experienced. Forecasts favour neutral SAM conditions early in July, although the expected weather patterns are not well-represented by this index. Beyond a two week period, forecasting the SAM skilfully is not possible.
The Indian Ocean Dipole (IOD) value for June 2026 is weakly negative (-0.43°C). Forecasts from the Australian Bureau of Meteorology indicate that the IOD is likely to become positive over the next three month period, and may reach thresholds (+0.4°C) required to declare a positive IOD event during the late winter or spring.
During June 2026, the Madden Julian Oscillation (MJO) moved through the Pacific Ocean, before weakening again. It is re-emerging into the western Pacific over the next 7-14 days, and is likely contributing to the low pressure system expected near New Zealand around the end of the first week of July.
With the MJO in the western Pacific, it can also contribute to both oceanic and atmospheric components of El Niño strengthening further.
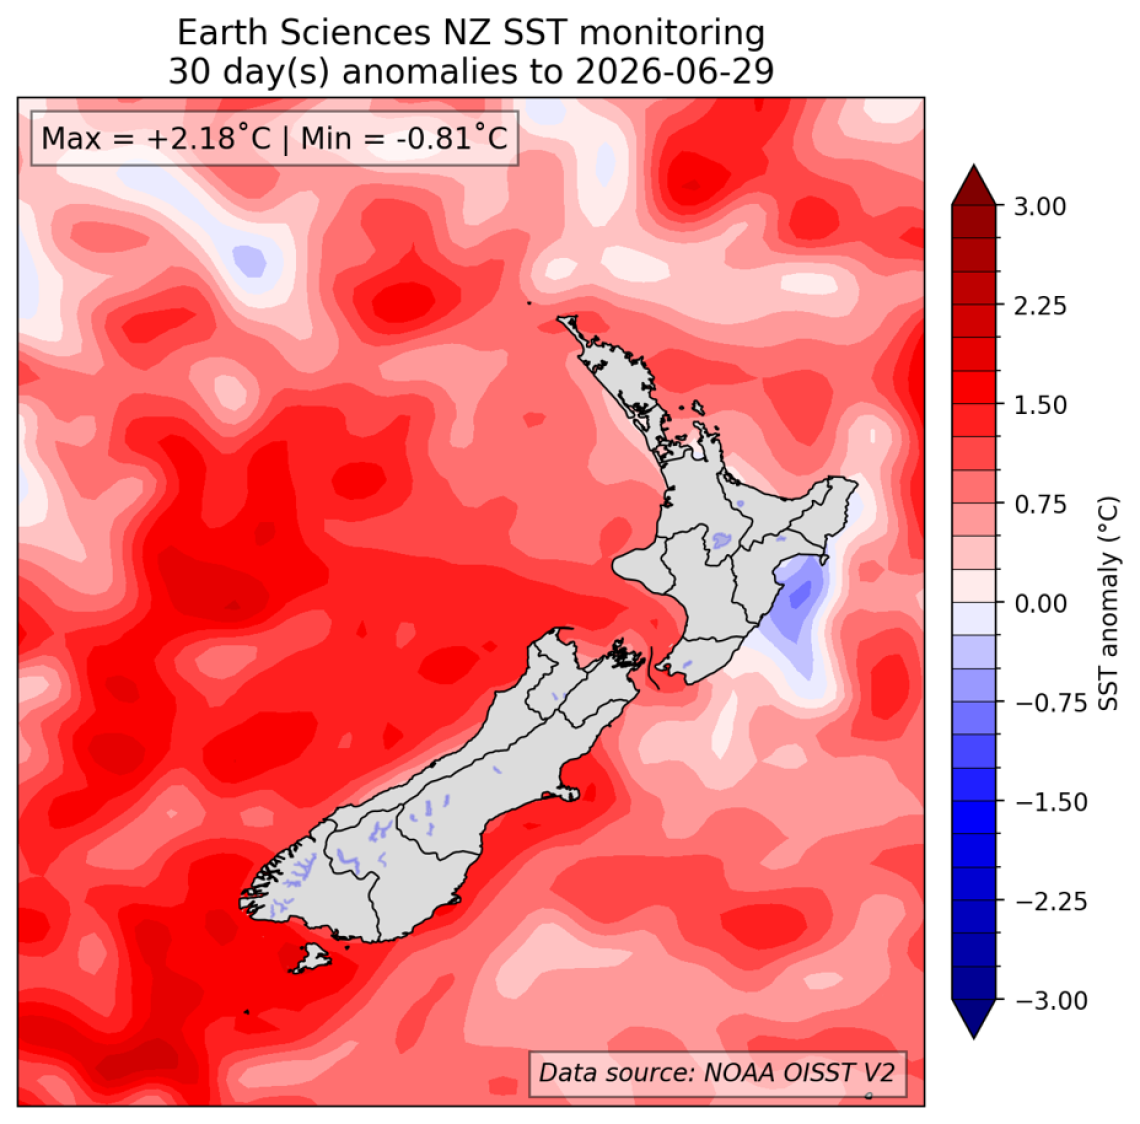
Local Sea Surface Temperatures (SSTs) are near average or above average around the majority of the country, and marine heatwave (MHW) conditions are continuing around an increasing part of the South Island. Forecasts from coupled ocean-atmosphere models for the next three-month period (see Sea Surface Temperature Update | Earth Sciences New Zealand | NIWA) indicate SSTs should continue to warm around the coastal waters of the country, especially around the South Island.
| North NI | +0.68°C |
| West NI | +1.02°C |
| East NI | +0.09°C |
| North SI | +1.09°C |
| West SI | +1.18°C |
| East SI | +1.29°C |
[1]The Relative Oceanic Niño 3.4 Index (RONI) is a modern way of measuring oceanic El Niño and La Niña that is complementary to traditional oceanic indices. While traditional oceanic indices like the Niño 3.4 Index monitor SSTs in one region, the RONI compares the average SST in the central equatorial Pacific with the average SST across the global tropics. Since tropical rainfall patterns respond to changes in ocean temperatures, this new relative index can help forecasters better determine if the equatorial Pacific is warmer or cooler than the rest of the global tropics, which has become more challenging to discern as seas warm because of climate change.
Forecast confidence
Temperature
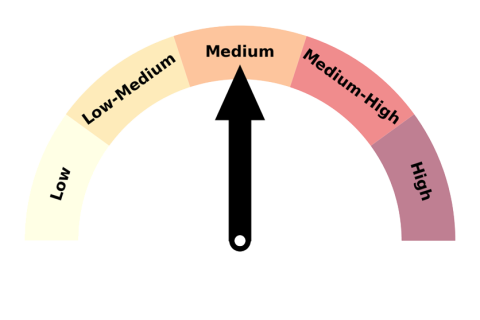
Forecast confidence for temperatures is Medium. Warm sea surface temperatures put a mild tinge on the outlook for much of the country, but there will be times when this is counterbalanced by colder circulation patterns.
Rainfall
Forecast confidence for rainfall is Medium. A pattern change is still expected during the outlook period, as the El Niño influence becomes stronger. Prior to this setting in, our rainfall distribution will be subject to short term variability, especially in July – this is the main reason for reduced confidence, which would otherwise be higher.
