Outlook summary
- Very strong El Niño conditions are now present in the tropical Pacific and are expected to strengthen further. El Niño’s influence on New Zealand’s weather patterns is becoming increasingly apparent and is expected to be a dominant driver of climate patterns during the outlook period.
- El Niño is expected to favour more frequent westerly airflows over New Zealand, along with increased wind strength and gustiness. This pattern is likely to bring more frequent fronts to western and southern areas, while increasing the potential for dry, warm föhn conditions in eastern regions.
- At times, this pattern may be disrupted by stratospheric influences favouring a positive Southern Annular Mode (SAM), which can partly counteract the circulation patterns associated with El Niño.
- Additionally, it’s important to remember that El Niño does not prevent short-lived departures from the typical El Niño pattern, including occasional northerly flows that may result in heavy rainfall for parts of the country.
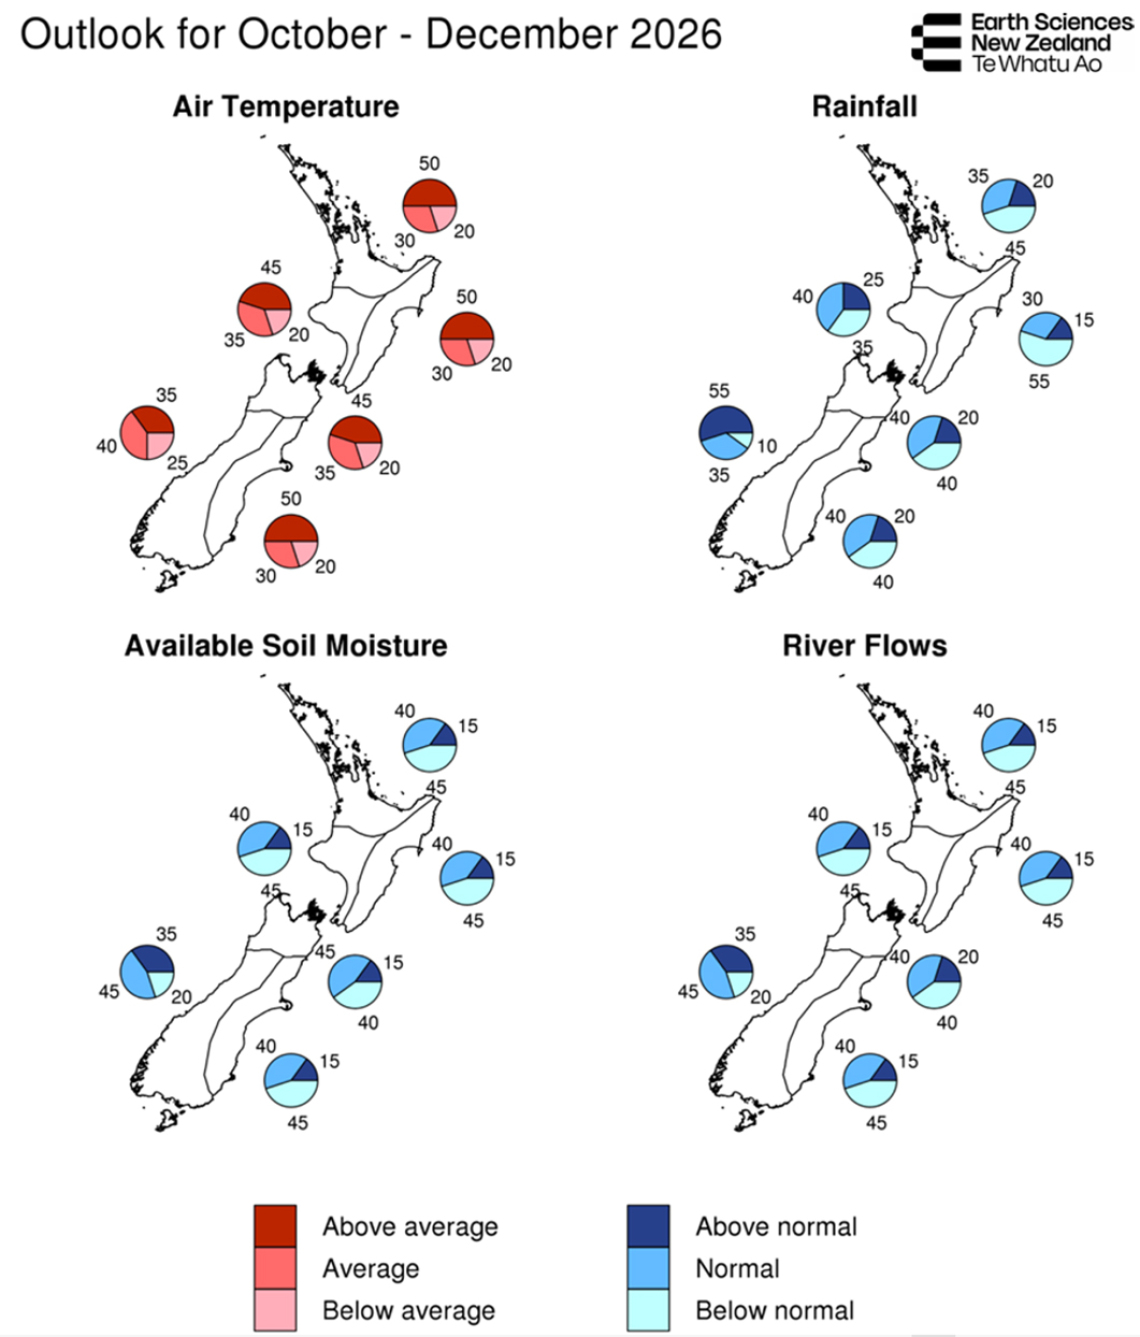
- Temperatures for October–December 2026 are most likely to be above average across most of New Zealand. In the west of the South Island, near average or above average temperatures are about equally likely. Despite the overall warmer outlook, temperatures are expected to be more variable than usual, with pronounced swings between warm and cold conditions.
- Rainfall totals for October–December 2026 are most likely to be below normal in the north and east of the North Island, while above normal rainfall is most likely in the west of the South Island. Elsewhere, near normal or below normal rainfall are about equally likely over the outlook period as a whole.
- Soil moisture, river flows, and snow and lake storage are currently generally healthy across the South Island, while below normal soil moisture and river flows are evident in parts of the North Island. The north and east of the North Island are particularly likely to experience reduced rainfall, more frequent dry spells, and increased drying of soils and vegetation, potentially creating challenges for water-reliant sectors.
- Soil moisture levels and river flows are most likely to be near normal or below normal across most of New Zealand, while near normal conditions are favoured in the west of the South Island.
- El Niño is expected to peak in late spring or early summer, with the potential for significant impacts. The event is likely to rank among the strongest on record, as anticipated over recent months (see El Niño 2026: What you need to know). The Relative Oceanic Niño Index (RONI) has already exceeded 1997 values for this time of year and has undergone the most rapid warming on record.
- Out-of-season Southwest Pacific tropical cyclones (July–October) are rare and, when they do occur, are more common during El Niño conditions. This remote risk does not currently factor into New Zealand’s Seasonal Climate Outlook, although active monitoring remains in place. The tropical cyclone season formally begins on 1 November.
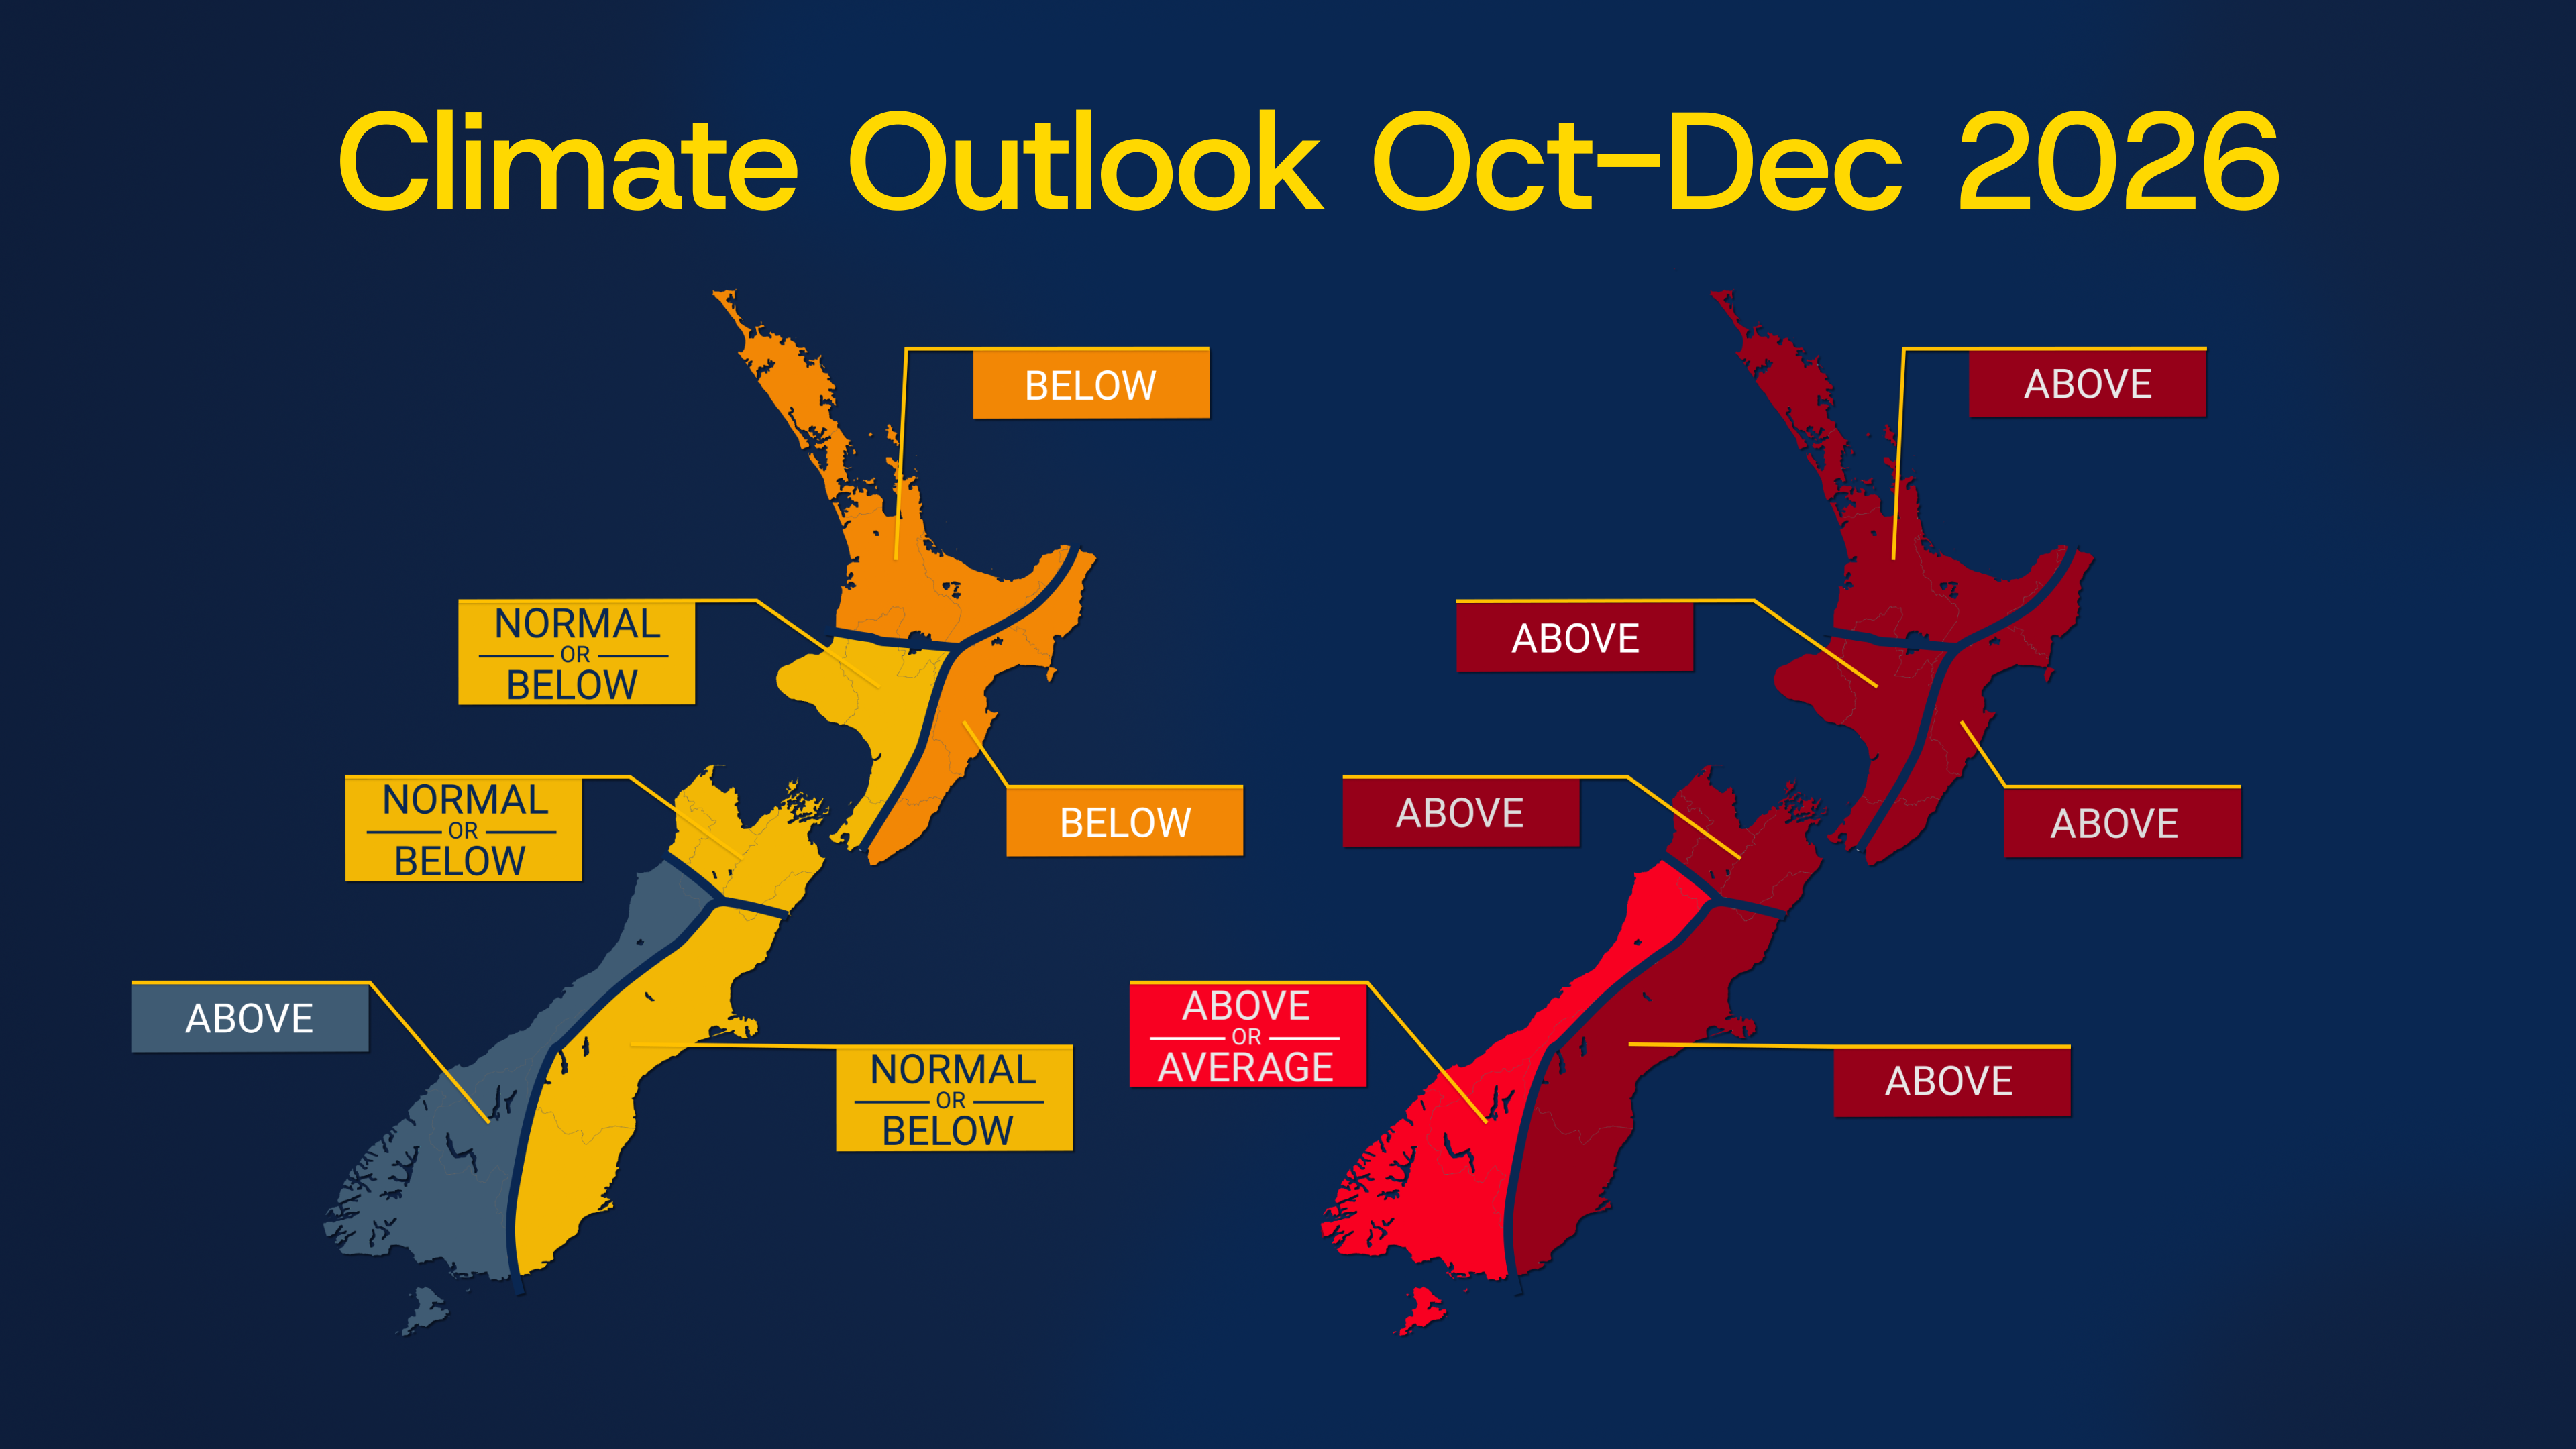
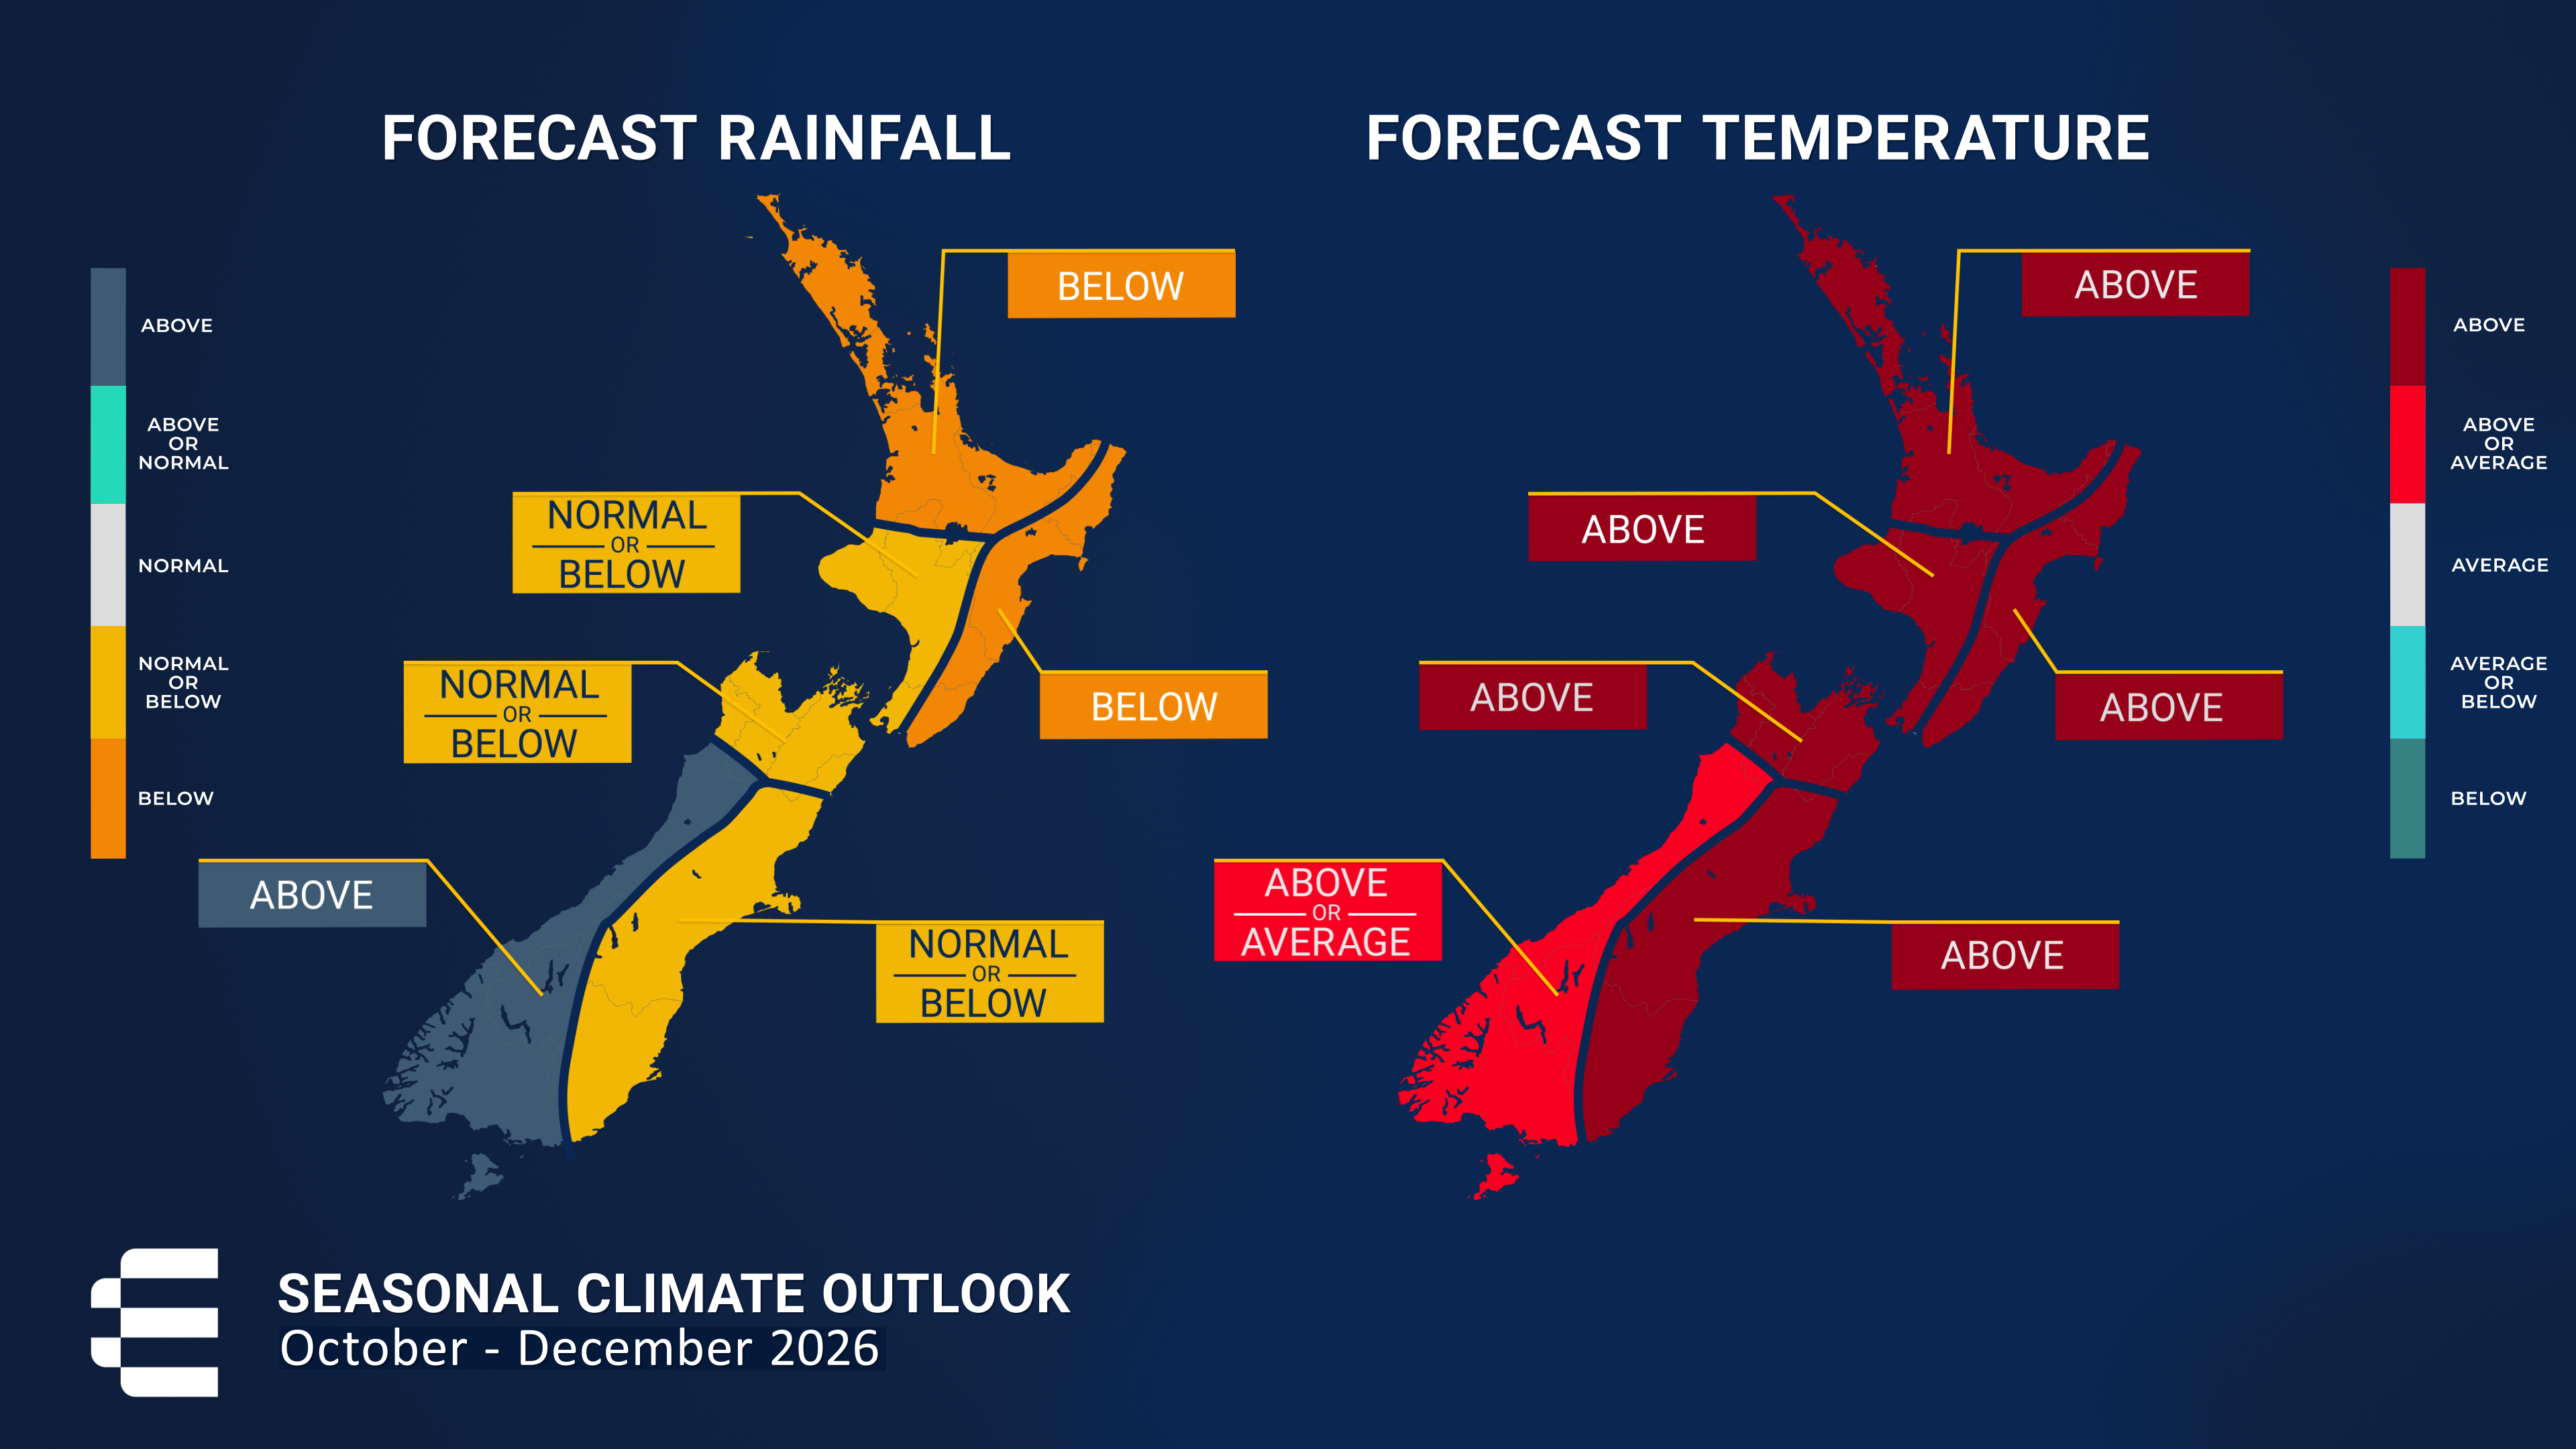
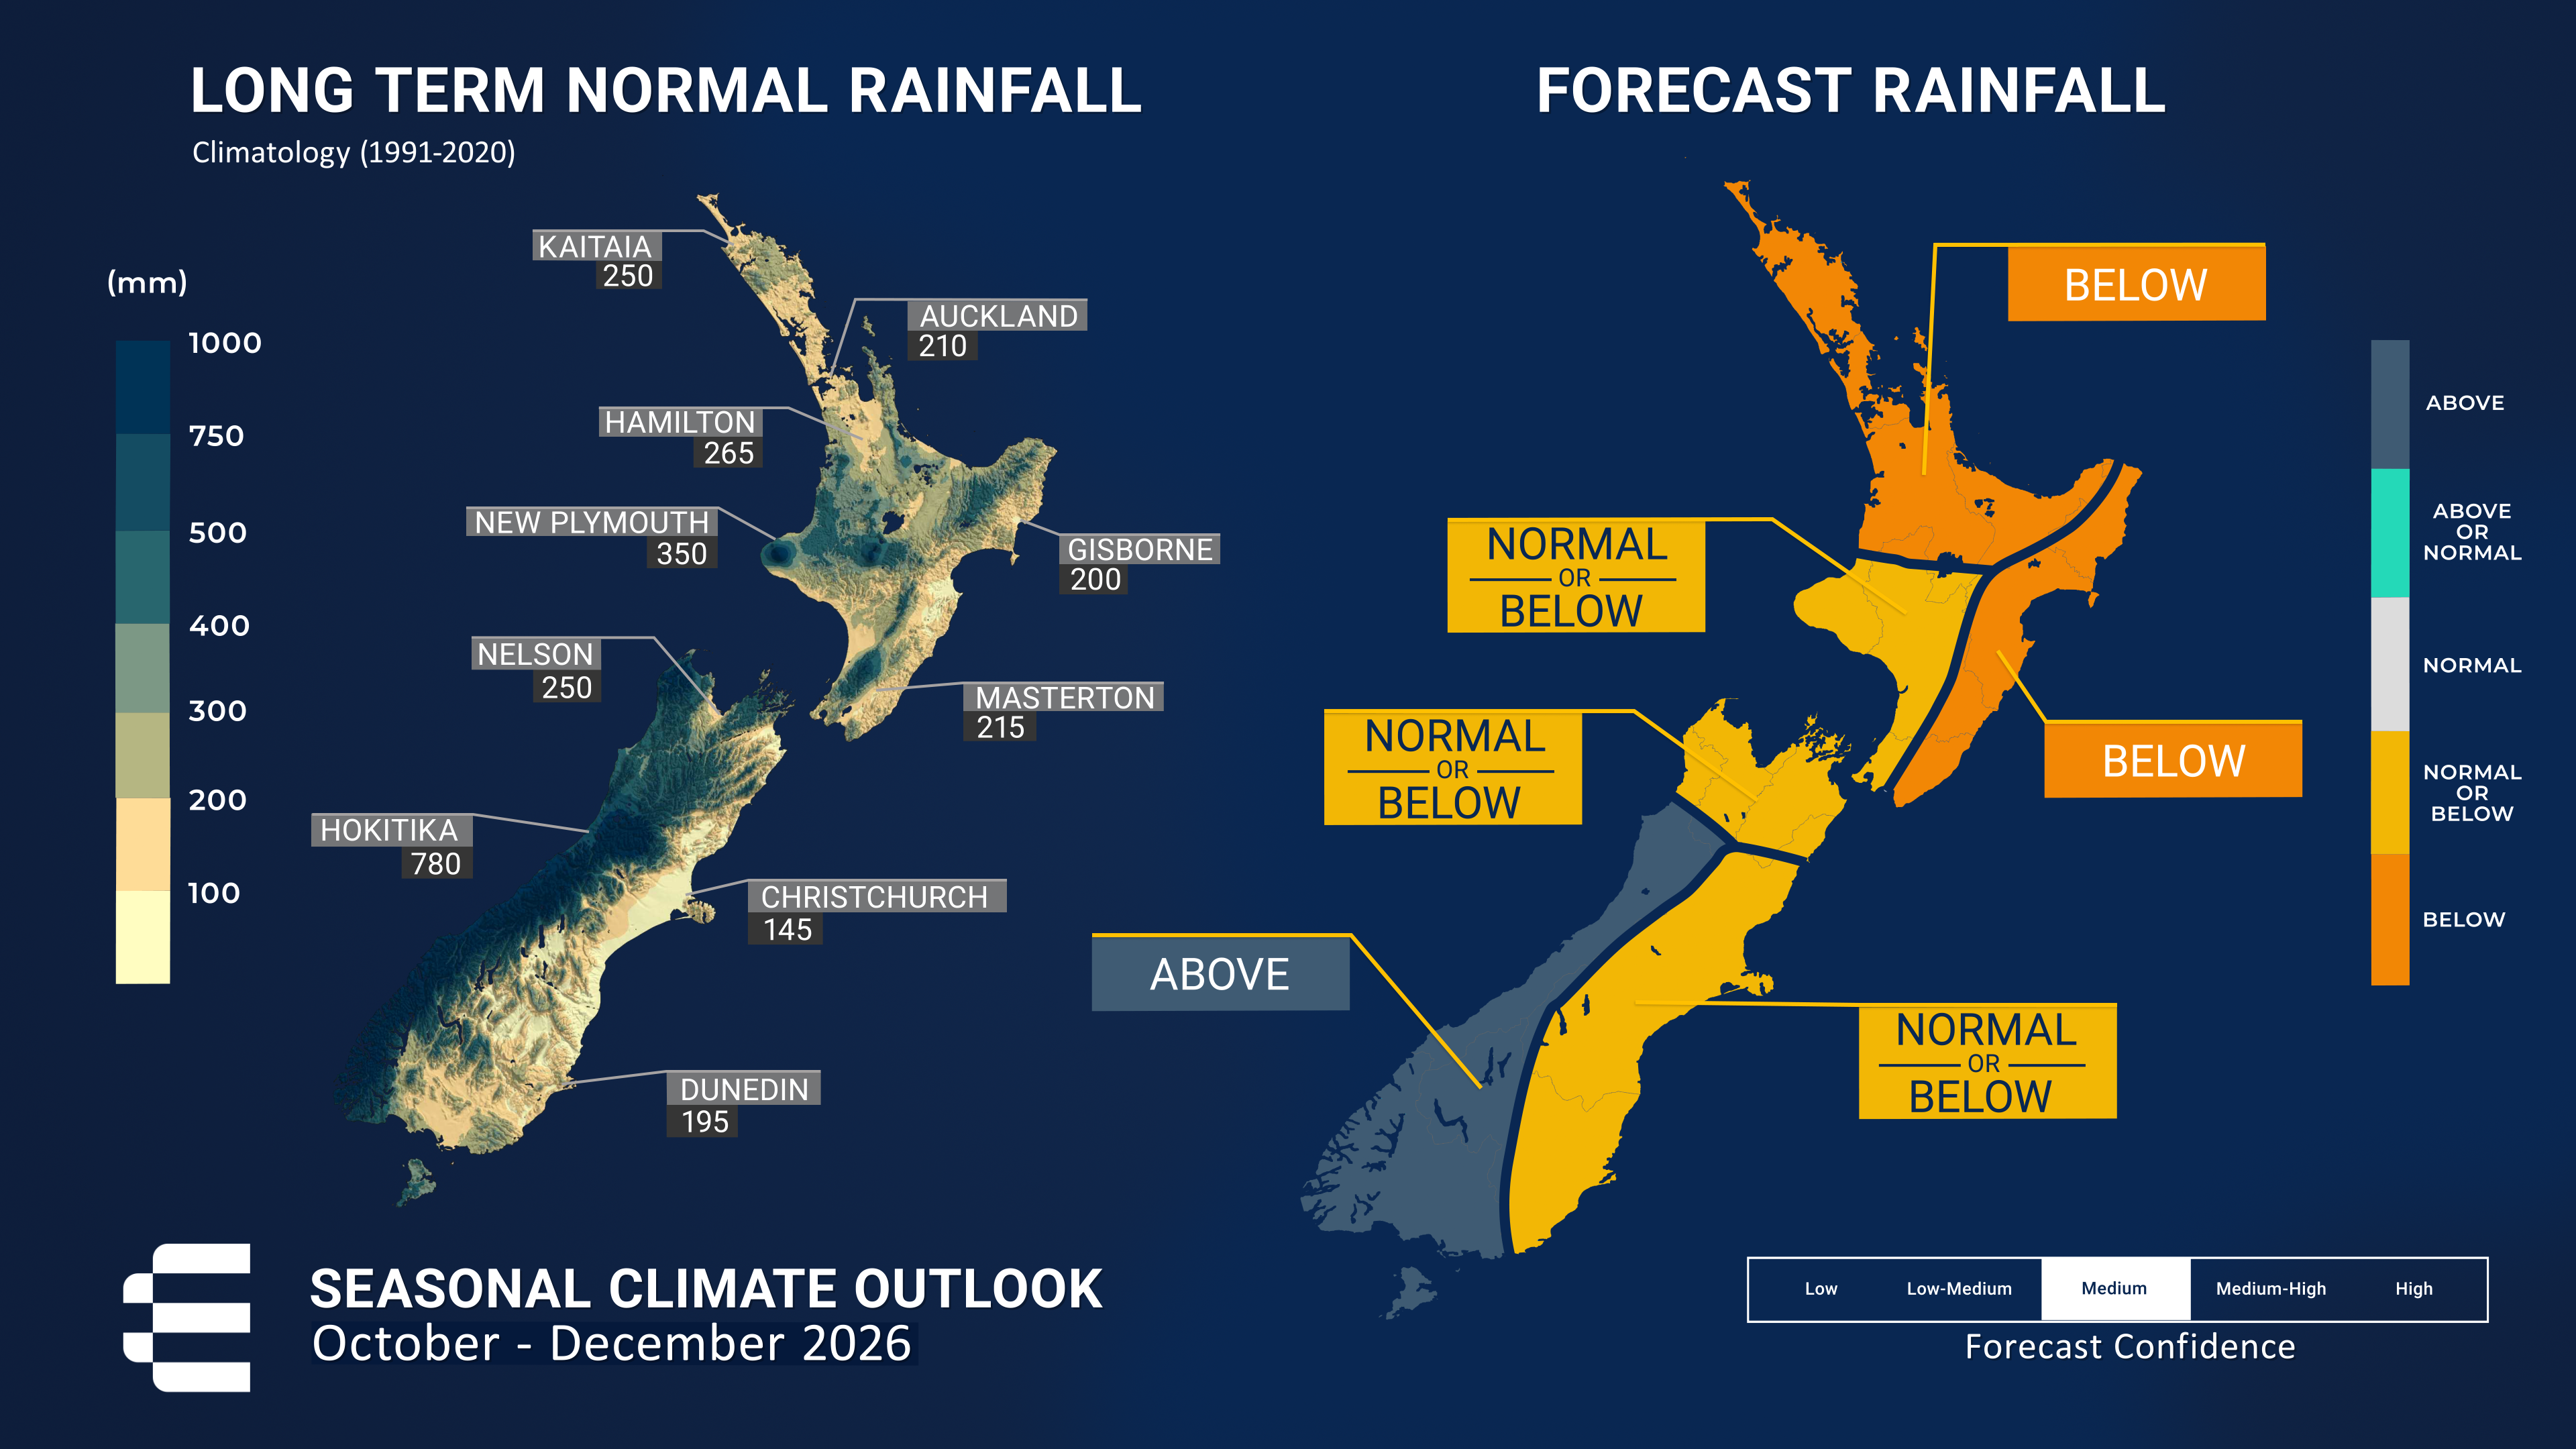
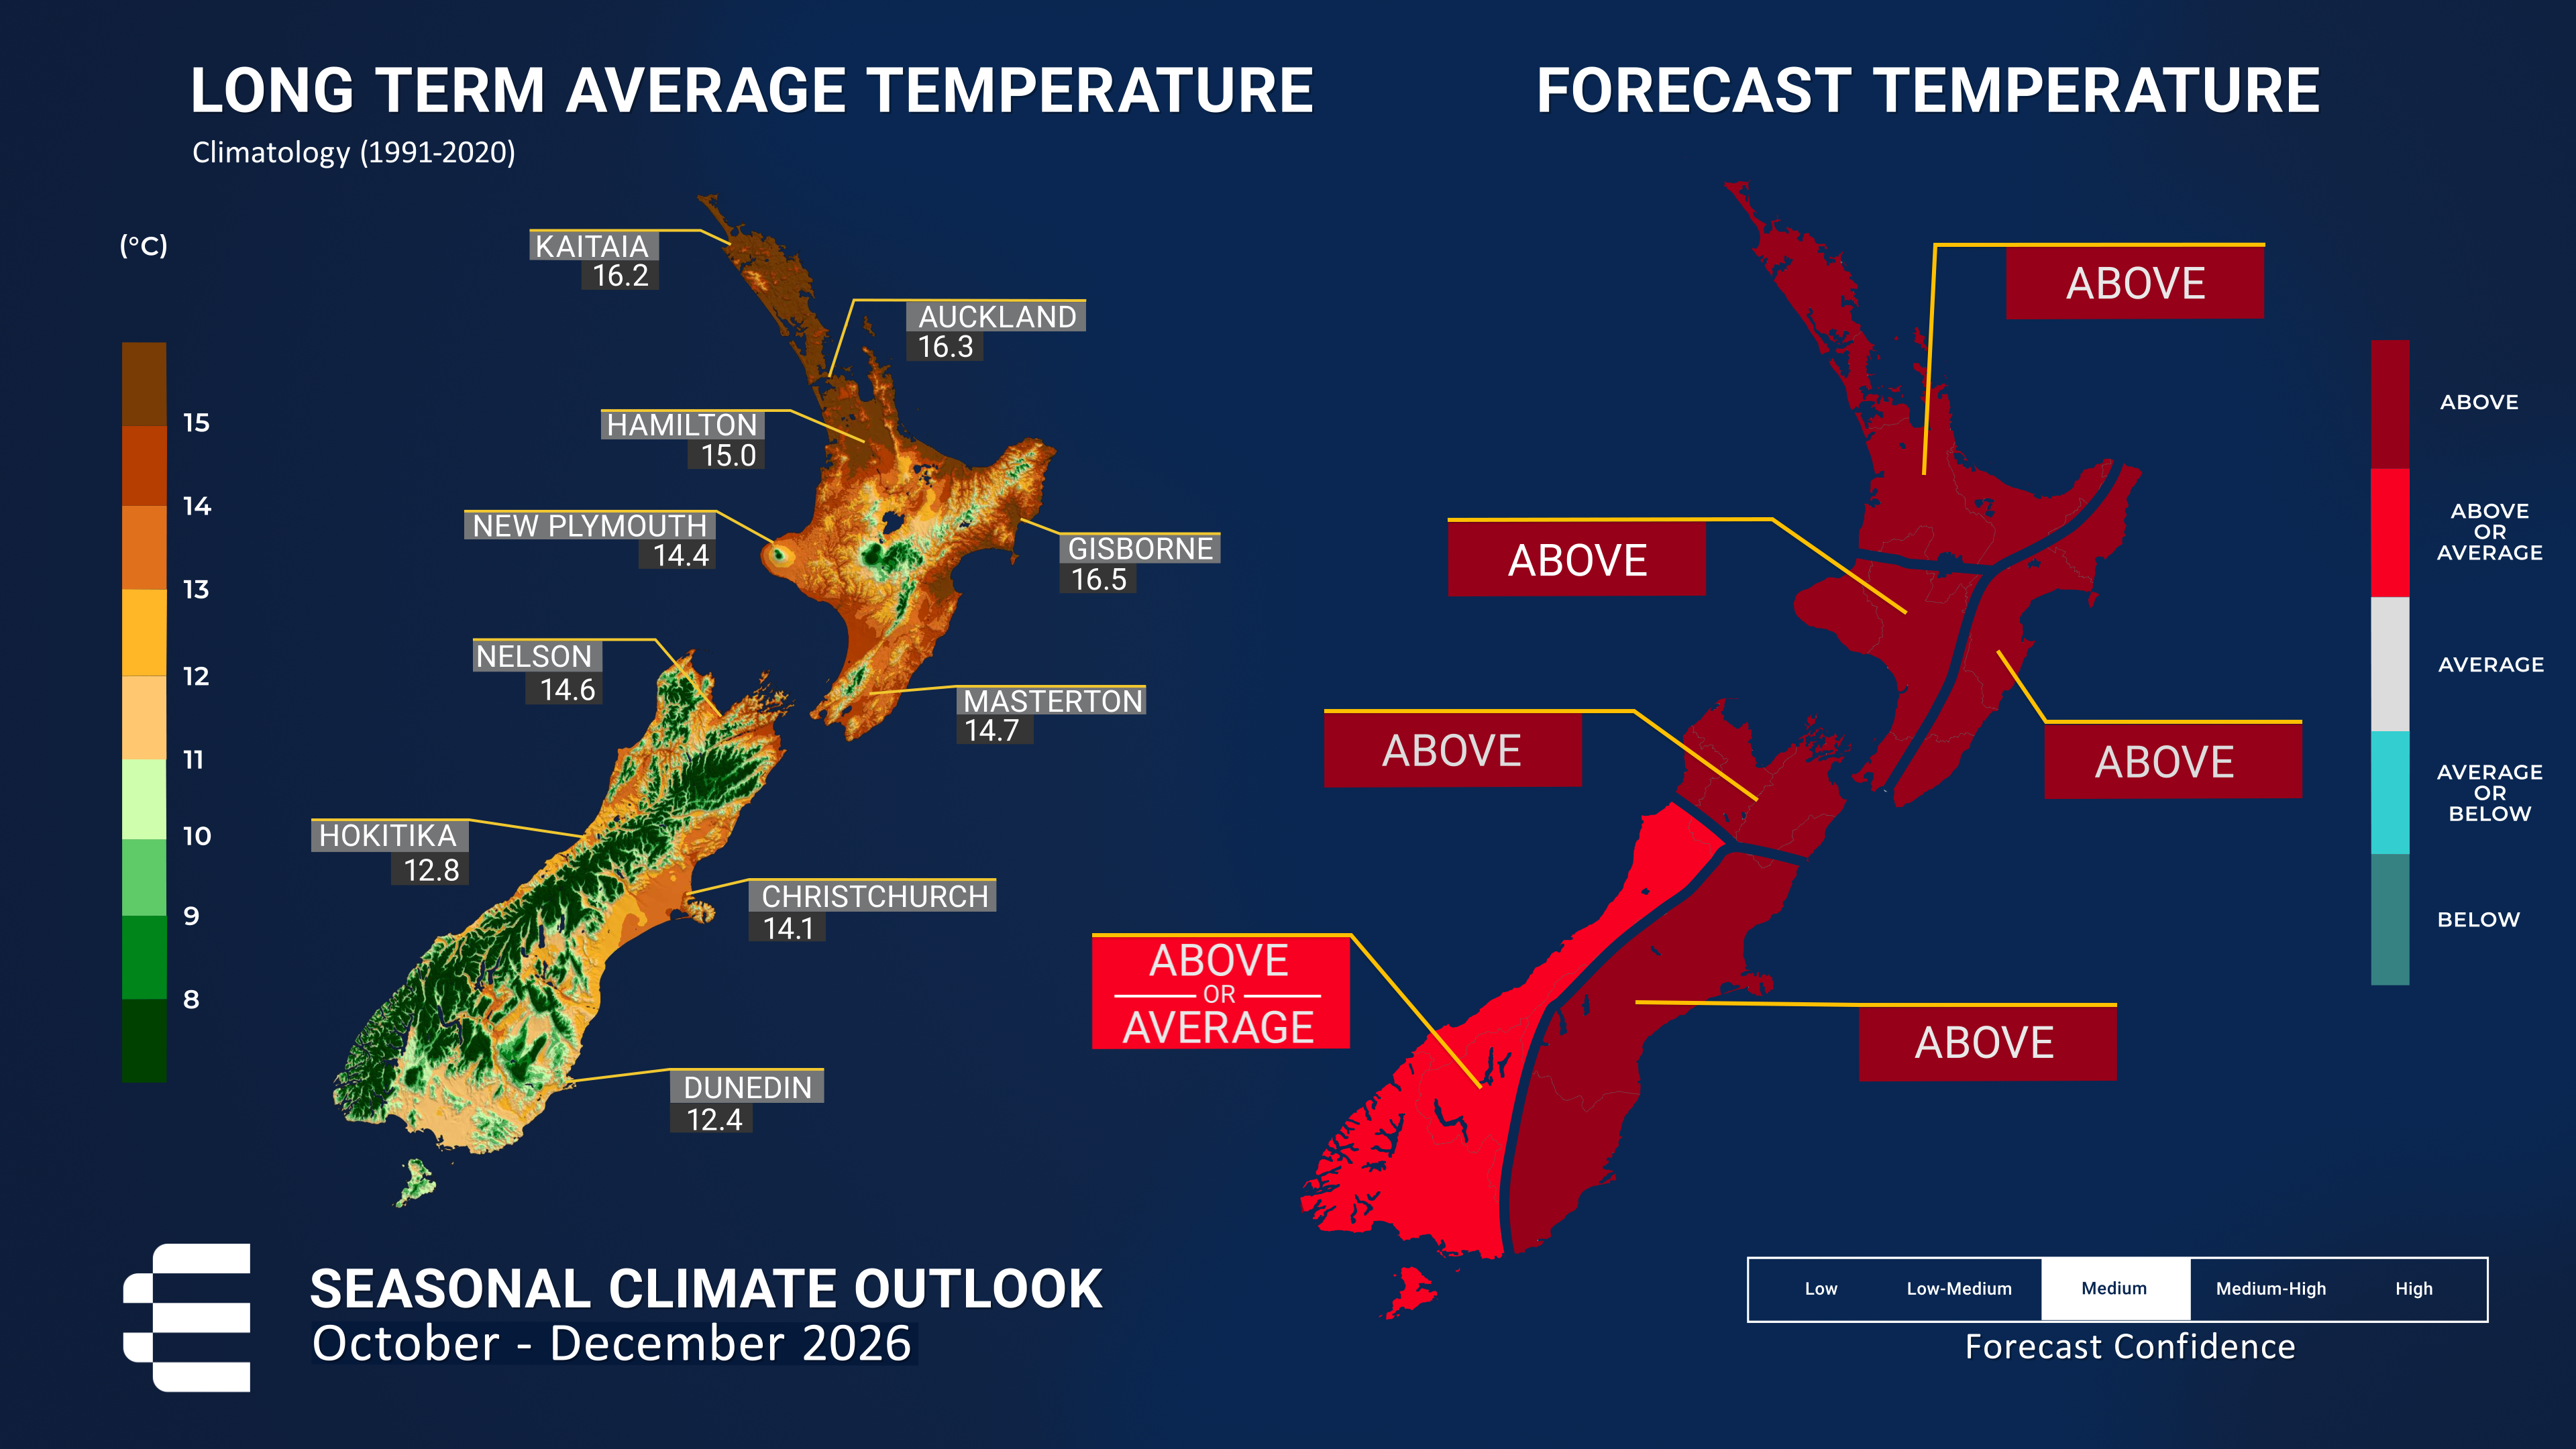
Regional predictions for October – December 2026
The tables below show the probabilities (or percent chances) for each of three categories: above average, near average, and below average. In the absence of any forecast guidance there would be an equal likelihood (33% chance) of the outcome for any of the three categories. Forecast information from local and global guidance models is used to indicate the deviation from equal chance that is expected for the coming three-month period. All outlooks are for the three months averaged as a whole. During these three months, there will inevitably be relatively wet and dry periods, as well as hot and cold periods. The exact range in temperature and rainfall within each of the three categories varies with location and season. However, as a guide, the “near average” or middle category for the temperature predictions includes deviations up to ±0.5°C relative to the long-term mean, whereas for rainfall the “near normal” category lies between 80 percent and 120 percent of the long-term (1991-2020) mean.
Northland, Auckland, Waikato, Bay of Plenty
Probabilities are assigned in three categories: above average, near average, and below average.
- Temperatures are most likely to be above average (50% chance).
- Rainfall totals are most likely to be below normal (45% chance).
- Soil moisture levels and river flows are about equally likely to be below normal (45% chance) or near normal (40% chance).
| Temperature | Rainfall | Soil moisture | River flows | |
| Above average | 50 | 20 | 15 | 15 |
| Near average | 30 | 35 | 40 | 40 |
| Below average | 20 | 45 | 45 | 45 |
Central North Island, Taranaki, Whanganui, Manawatu, Wellington
Probabilities are assigned in three categories: above average, near average, and below average.
- Temperatures are most likely to be above average (45% chance).
- Rainfall totals are about equally likely to be near normal (40% chance) or below normal (35% chance).
- Soil moisture levels and river flows are about equally likely to be below normal (45% chance) or near normal (40% chance).
| Temperature | Rainfall | Soil moisture | River flows | |
| Above average | 45 | 25 | 15 | 15 |
| Near average | 35 | 40 | 40 | 40 |
| Below average | 20 | 35 | 45 | 45 |
Gisborne, Hawke’s Bay, Wairarapa
Probabilities are assigned in three categories: above average, near average, and below average.
- Temperatures are most likely to be above average (50% chance), with the potential for notable short-duration warm spells associated with strong, gusty westerly winds.
- Rainfall totals are most likely to be below normal (55% chance) over the outlook period as a whole.
- Soil moisture levels and river flows are about equally likely to be below normal (45% chance) or near normal (40% chance).
| Temperature | Rainfall | Soil moisture | River flows | |
| Above average | 50 | 15 | 15 | 15 |
| Near average | 30 | 30 | 40 | 40 |
| Below average | 20 | 55 | 45 | 45 |
Tasman, Nelson, Marlborough, Buller
Probabilities are assigned in three categories: above average, near average, and below average.
- Temperatures are most likely to be above average (45% chance), with greater-than-usual variability, including pronounced swings between warm and cold conditions and periods of unusually windy weather.
- Rainfall totals are equally likely to be below normal (40% chance) or near normal (40% chance).
- Soil moisture levels are about equally likely to be near normal (45% chance) or below normal (40% chance).
- River flows are equally likely to be below normal (40% chance) or near normal (40% chance).
| Temperature | Rainfall | Soil moisture | River flows | |
| Above average | 45 | 20 | 15 | 20 |
| Near average | 35 | 40 | 45 | 40 |
| Below average | 20 | 40 | 40 | 40 |
West Coast, Southern Alps and foothills, inland Otago, Southland
Probabilities are assigned in three categories: above average, near average, and below average.
- Temperatures are about equally likely to be near average (40% chance) or above average (35% chance).
- Rainfall totals are most likely to be above normal (55% chance), with an increased potential for heavy rain events and unusually strong winds.
- Soil moisture levels and river flows are most likely to be near normal (45% chance).
| Temperature | Rainfall | Soil moisture | River flows | |
| Above average | 35 | 55 | 35 | 35 |
| Near average | 40 | 35 | 45 | 45 |
| Below average | 25 | 10 | 20 | 20 |
Coastal Canterbury and the nearby plains, east Otago
Probabilities are assigned in three categories: above average, near average, and below average.
- Temperatures are most likely to be above average (50% chance), but greater-than-usual variability is expected. Strong westerly wind episodes may bring short-lived warm, föhn-like conditions to eastern areas, interspersed with cooler changes as fronts move across the country.
- Rainfall totals are equally likely to be below normal (40% chance) or near normal (40% chance).
- Soil moisture levels and river flows are about equally likely to be below normal (45% chance) or near normal (40% chance).
The full probability breakdown is:
| Temperature | Rainfall | Soil moisture | River flows | |
| Above average | 50 | 20 | 15 | 15 |
| Near average | 30 | 40 | 40 | 40 |
| Below average | 20 | 40 | 45 | 45 |
Graphical representation of the regional probabilities
Background
During September 2026, the Southern Oscillation Index (SOI) increased compared with August, reaching -2.1 based on daily observations through 30 September. This strongly negative SOI value is consistent with very strong El Niño conditions and indicates a well-established atmospheric response to the tropical Pacific warming.
Sea surface temperature (SST) anomalies across the central and eastern equatorial Pacific continued to strengthen during September 2026. The 30-day average Relative Oceanic Niño Index (RONI) crossed the +2°C threshold associated with a very strong (or “super”) El Niño on 19 September. The latest 30-day RONI value, to 28 September, is +2.14°C, is exceeding the value observed at the same time of year during the 1997/98 El Niño event. The rate of warming since January 2026 is the fastest on record. The pattern of equatorial Pacific warming is characteristic of a canonical, eastern-Pacific El Niño, similar to the 1997/98 and 1982/83 events, with the strongest SST anomalies concentrated in the eastern Pacific.
During September, subsurface ocean temperatures in the eastern equatorial Pacific, east of the International Date Line, intensified further. Temperature anomalies locally exceed +10°C, extending from depths of around 150 m near 150°W to around 50 m near the South American coast. This unusually warm subsurface water continues to be expressed at the surface, contributing to the ongoing increase in the RONI. In contrast, subsurface waters in the western equatorial Pacific remain cooler than average. This pronounced east-west contrast in subsurface ocean temperature anomalies is characteristic of very strong El Niño conditions and, like the RONI, has developed exceptionally rapidly during 2026.
Accordingly, positive upper-ocean heat content anomalies (0 - 300 m) remain firmly established along the Equator east of the International Date Line. The magnitude of this subsurface heat reservoir is consistent with other observed indicators and with dynamical and statistical forecast guidance, which together point to further strengthening of El Niño during the outlook period.
Rainfall and Convection: During September, enhanced convection and rainfall, indicated by negative outgoing longwave radiation (OLR) anomalies, extended along the Intertropical Convergence Zone (ITCZ) over much of the equatorial Pacific east of the International Date Line. In contrast, suppressed convection and rainfall persisted across the Maritime Continent. This broad pattern has changed little over the past two months and is characteristic of a well-established, canonical El Niño state.
Trade winds remained dramatically weaker than normal across much of the equatorial Pacific during September, with westerly winds occurring at times, consistent with a strongly coupled El Niño state.
In summary, very strong (“super”) El Niño conditions are now firmly established and are expected to strengthen further during the outlook period. A substantial reservoir of anomalous warmth remains stored beneath the surface of the equatorial Pacific, providing support for continued development of the event. These oceanic signals have strengthened considerably over the past few months. The atmosphere is also strongly coupled to the ocean, with trade winds, tropical convection, and the Southern Oscillation all displaying clear El Niño characteristics.
The Relative Oceanic Niño Index forecasts indicate a 100% chance of very strong El Niño conditions persisting during October–December 2026, with the IRI/CPC forecasts also supporting this outlook. Forecasts from the Multi-Model Ensemble system primarily used by ESNZ suggest two possible trajectories for the evolution of El Niño. One indicates a peak in November 2026 followed by a relatively rapid decline, while the other indicates continued strengthening into December 2026 or January 2027, followed by a slower decline. Both scenarios project peak RONI values above those observed in the historical record.
The Southern Annular Mode (SAM) recently shifted into its positive phase. A significant ozone hole is currently present over Antarctica, associated with a stronger stratospheric circumpolar vortex. This stratospheric configuration can favour the development and persistence of a positive SAM at the surface. For New Zealand, a positive SAM can produce rainfall anomalies that partly oppose those typically associated with El Niño, introducing additional uncertainty to the forecast, particularly during the first part of the outlook period. Nevertheless, the very strong and well-coupled El Niño is expected to be the dominant influence on regional atmospheric circulation over the outlook period.
The Indian Ocean Dipole (IOD) was positive in September (+0.6°C for the 30 days value to 28 September), exceeding the conventional +0.4°C threshold to define a positive IOD event, as forecast last month. Forecasts from the Australian Bureau of Meteorology indicate further strengthening, with the IOD expected to peak during October or November. A positive IOD during spring is consistent with the broader El Niño state. However, the latest forecasts have generally reduced the expected magnitude of the event, reflecting widespread warming across the Indian Ocean that is limiting the east-west temperature gradient that defines the IOD.
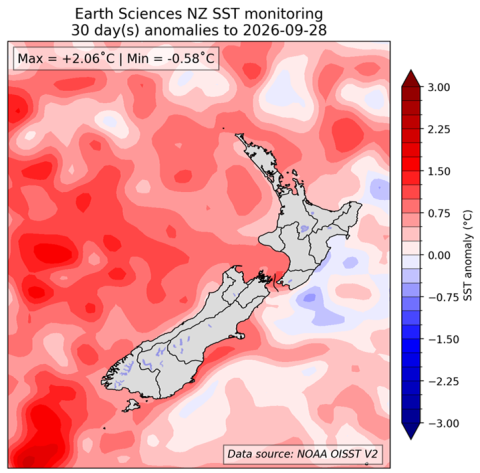
The Madden-Julian-Oscillation (MJO) signal remained weak throughout September, with intra-seasonal tropical Pacific variability largely masked by the dominant background state associated with the ongoing El Niño event. Local Sea Surface Temperatures (SSTs) are near average or above average around most of New Zealand, except to the east of the North Island, where cooler-than-average ocean temperatures are present. SSTs generally decreased during September around the South Island. While marine heatwave (MHW) conditions persist west and south of the South Island and across parts of the Tasman Sea, their extent and intensity have decreased. Forecasts from coupled ocean-atmosphere models for the next three months (see Sea Surface Temperature Update) indicate that ocean temperature are expected to further decrease around much of the country.
| North NI | +0.52°C |
| West NI | +0.70°C |
| East NI | +0.04°C |
| North SI | +0.66°C |
| West SI | +0.62°C |
| East SI | +0.82°C |
[1] The Relative Oceanic Niño 3.4 Index (RONI) is a modern way of measuring oceanic El Niño and La Niña that is complementary to traditional oceanic indices. While traditional oceanic indices like the Niño 3.4 Index monitor SSTs in one region, the RONI compares the average SST in the central equatorial Pacific with the average SST across the global tropics. Since tropical rainfall patterns respond to changes in ocean temperatures, this new relative index can help forecasters better determine if the equatorial Pacific is warmer or cooler than the rest of the global tropics, which has become more challenging to discern as seas warm because of climate change.
Forecast confidence
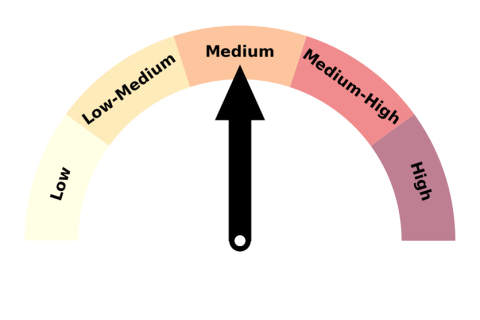
Forecast confidence for temperatures is medium. Above average temperatures are favoured overall, but greater-than-usual variability is expected, with pronounced swings between warm and cold conditions. Confidence is also moderated by the potential for a positive Southern Annular Mode (SAM) and stratospheric influences to periodically disrupt the expected El Niño circulation patterns.
Forecast confidence for rainfall is medium. While El Niño is expected to be the dominant influence over the outlook period, the recent emergence of a positive Southern Annular Mode (SAM), together with potential influences from the stratosphere, introduces uncertainty as these may partly counteract the expected El Niño circulation patterns.