Unprecedented rainfall in the north, hot and dry for the south
|
Rainfall |
Above normal (120-149% of normal) or well above normal (>149% of normal) rainfall was observed across most of the North Island, northern Tasman and eastern Marlborough. It was an exceptionally wet month for the southern half of Northland, Auckland, the Coromandel Peninsula, western Bay of Plenty and parts of Hawke’s Bay which all received at least 400% of normal January rainfall. Auckland observed its wettest ever month in records dating back to 1853. In stark contrast, below normal (50-79% of normal) or well below normal (<50% of normal) rainfall was observed across the majority of the South Island. |
|
Temperature |
Temperatures were above average (0.51-1.20°C above average) or well above average (>1.20°C above average) across the majority of the South Island, and most western, inland and northern parts of the North Island. Temperatures were generally near average (±0.50°C of average) along the eastern North Island, Marlborough, and coastal North Canterbury, with patches of below average temperature (0.51-1.20°C below average) observed in coastal parts of Gisborne and Wairarapa. |
|
Soil Moisture |
At the end of January, soil moisture levels were considerably higher than normal across the majority of the North Island. The exception was southwestern parts from Manawatū-Whanganui to Wellington where soil moisture levels were near normal. Soil moisture levels were lower than normal for the lower half of the South Island and most of the West Coast, as well as much of Tasman, with near normal soil moisture levels prevailing for most remaining parts of the South Island. |
Important note on climate normals
NIWA have updated Aotearoa New Zealand’s climate normals to the 1991-2020 baseline period.
This is in line with a World Meteorological Organization recommendation that the 30-year standard reference periods should be updated every decade to better reflect the changing climate, and its influence on day-to-day weather. Beginning now and until further notice, all normal values and differences from normal reported in this and subsequent climate summaries are compared to the 1991-2020 baseline period. Using the latest baseline period has no bearing on rankings which are presented in these summaries. For example, the nationwide average temperature in January 2023 was 18.38°C. This was New Zealand’s 10th-warmest January on record, at 1.16°C above the 1991-2020 January average (and 1.25°C above the 1981-2010 January average). Detailed analyses are ongoing to understand how New Zealand’s climate normals have changed between the 1981-2010 and 1991-2020 baseline periods. Results from these analyses will be publicised in due course.
Overview
La Niña persisted during January 2023 and was a key climate driver for the month. In addition, the Southern Annular Mode (SAM) was positive every day during January, with positive SAM phases associated with higher than normal air pressure in the Aotearoa New Zealand region. Indeed, an expansive high air pressure anomaly near and over the South Island was observed. This, coupled with an equally strong low pressure anomaly north of the North Island, contributed to more easterly winds than normal over the country.
The prevailing air pressure pattern also contributed to several slow-moving, high impact rainfall events in the North Island, very dry conditions in the west and south of the South Island, and a record marine heatwave off the South Island’s West Coast. The monthly sea-surface temperature anomaly of +3.15˚C to the west of the South Island surpassed the previous monthly record of +2.46˚C set in January 2018 (records began in 1982). By the end of January, marine heatwave conditions were widespread around the South Island and in parts of the western and lower North Island.
Rainfall extremes were a dominant feature of January 2023. Northern and eastern parts of the North Island were subject to several consecutive rainfall events that each delivered a typical month’s worth of rainfall, or more. Rainfall totals for the month were above normal (120-149% of normal) or well above normal (>149% of normal) across most of the North Island, northern Tasman and eastern Marlborough, but these descriptors don’t do justice to the exceptional totals that were observed. For example, the southern half of Northland, Auckland, the Coromandel Peninsula, western Bay of Plenty and parts of Hawke’s Bay each received at least 400% of normal January rainfall. Several stations in Auckland received more than 600% of normal rainfall, with the highest anomaly of 859% recorded in Māngere. In Albert Park, a January total of 538.5 mm was observed, making it the all-time monthly high for that site’s homogenised record which begins in 1853[Ref 1]. See NIWA’s statement on Auckland’s record-breaking month of rainfall for more information.
In stark contrast to the North Island, rainfall was below normal (50-79% of normal) or well below normal (<50% of normal) across the majority of the South Island. It was exceptionally dry for parts of western and southern Southland, coastal south Otago, northwestern Otago, Banks Peninsula and Aoraki Mt Cook Village, which each received less than 20% of normal January rainfall. Isolated pockets of near normal rainfall (80-119% of normal) were observed in the Kāpiti Coast and Nelson.
January temperatures were above average (0.51-1.20°C above average) or well above average (>1.20°C above average) across the majority of the South Island, and most western, inland and northern parts of the North Island. It was particularly warm for western parts of the South Island, with temperature anomalies exceeding 3.0°C in many locations. Such high temperatures were largely a result of regular Foehn wind events and very high sea surface temperatures nearby. Foehn events are typically associated with northwest winds in New Zealand, but the same process occurs for western locations during easterly winds events, and easterlies were a regular feature during January. The nationwide average temperature in January 2023 was 18.4°C. This was 1.2°C above the 1991-2020 January average from NIWA’s seven station temperature series which begins in 1909, and New Zealand’s 10th-warmest January on record.
The prevalence of high pressure over the South Island contributed to relatively high sunshine hours for many locations there. Alexandra recorded 305 hours of sunshine, making it the town’s sunniest January since records began in 1930. Farther north, Hokitika observed 274 hours of sunshine, which was the town’s fourth-highest January sunshine total since records began in 1912. In the North Island, high rainfall totals were accompanied by low sunshine hours. Dargaville, Whangārei, Auckland, Gisborne, Dannevirke, Masterton and Martinborough each observed their lowest January sunshine hour total on record [Ref 2].
Further highlights [Ref 3]
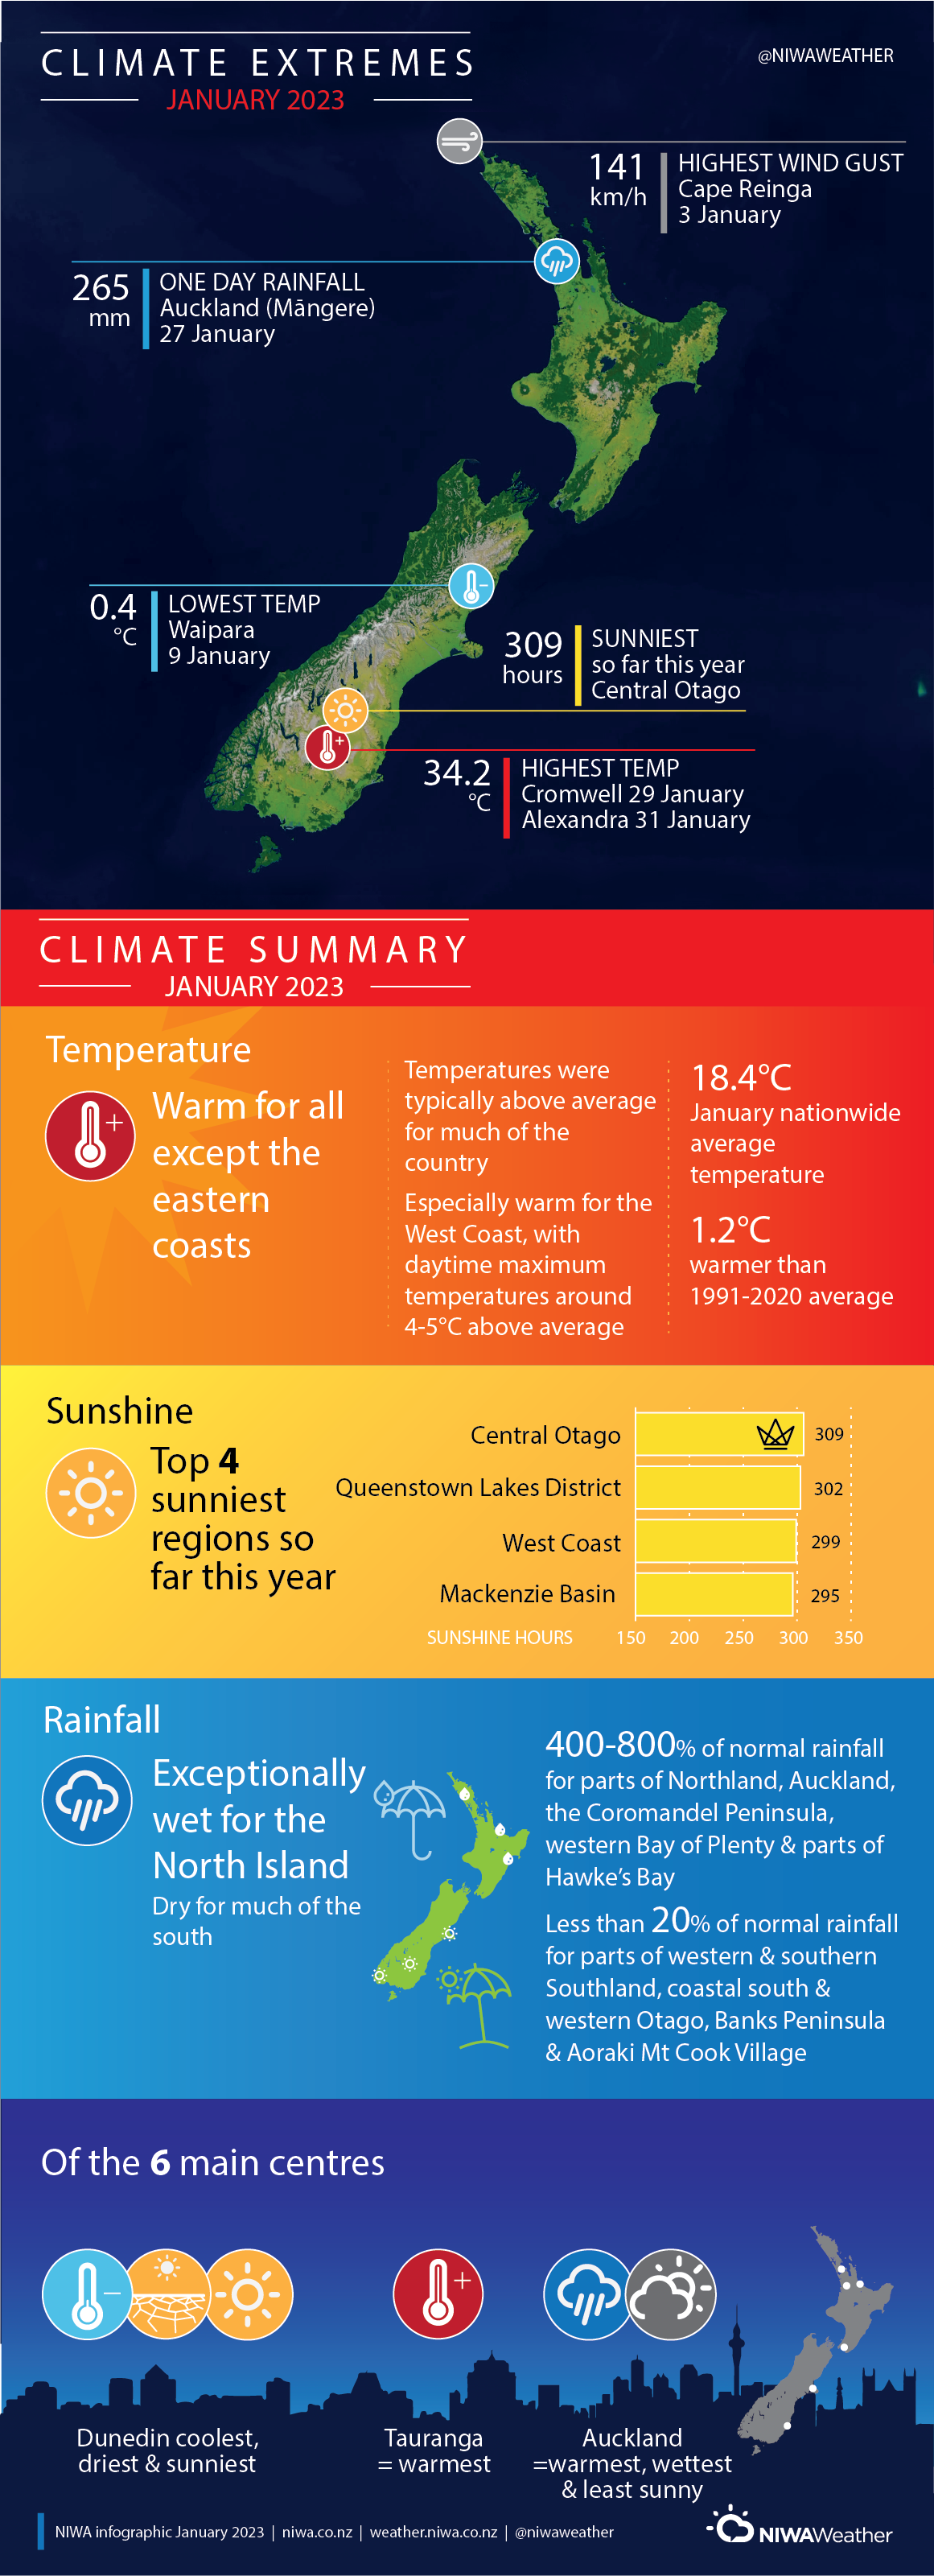
- The highest temperature was 34.2°C, observed at Cromwell on 29 January, and Alexandra on 31 January.
- The lowest temperature was 0.4°C, observed at Waipara on 9 January.
- The highest 1-day rainfall was 265 mm, recorded at Māngere (Auckland) on 27 January.
- The highest wind gust was 141 km/h, observed at Cape Reinga on 3 January.
- Of the six main centres in January 2023, Dunedin was the coolest, driest and sunniest, Auckland and Tauranga were the equal-warmest, while Auckland was additionally the wettest and least sunny.
- Of the available, regularly reporting sunshine observation sites, the sunniest four locations so far in 2023 are Central Otago (308.6 hours), Queenstown Lakes District (302.1 hours), West Coast (299.1 hours) and Mackenzie Basin (294.8 hours).
Climate summary infographic
Download
- Climate Summary - January 2023 [PDF 400KB]
- Climate Statistics - January 2023 [PDF 155 KB]
References
[1] Fowler, A. M. (2021) Central Auckland rainfall, 1853-2020: towards a homogenous record. Journal of Hydrology (NZ) 60 (1): 25-47
[2] It is important to note that sunshine durations in New Zealand have been measured with different instruments over time. Contemporary observations are typically made with Kipp & Zonen instruments (electronic), whereas historic observations were made with Campbell Stokes instruments (manual). As such, these data are not reliably comparable. This topic was examined by NIWA Scientists in 2019 – for further information see Sunshine duration instrument comparisons in New Zealand (https://www.jstor.org/stable/26892910)
[3] From stations available in NIWA’s National Climate Database.