Outlook Summary
- For April-June, air pressure is expected to be lower than normal to the northwest and higher than normal to the east of the country. Although air flows will be mixed, slightly more easterly quarter winds are favoured for the three month period as a whole.
- Low pressure systems are expected to be more common in the NZ region during April due to the presence of the Madden-Julian Oscillation (MJO), a tropical climate driver in the Pacific – there is an elevated chance for heavy rain events in the middle part of the month.
- Rainfall is about equally likely to be near normal or above normal in the north and west of the North Island and equally likely to be near normal or below normal in the South Island. Near normal rainfall is expected in the east of the North Island.
- Temperatures are about equally likely to be near average or above average for all regions of the country. While cold snaps and frosts will occur periodically, they aren’t expected to define the season.
- Coastal sea surface temperatures (SSTs) ranged from 0.1˚C to 0.6˚C above average during March. Some areas experienced marine heatwave conditions, as described in the Background.
- Soil moisture levels and river flows are about equally likely to be near normal (35-40% chance) or below normal (35-40% chance) in all regions of the country.


Regional predictions for April – June 2021
Northland, Auckland, Waikato, Bay of Plenty
The table below shows the probabilities (or percent chances) for each of three categories: above average, near average, and below average. In the absence of any forecast guidance there would be an equal likelihood (33% chance) of the outcome being in any one of the three categories. Forecast information from local and global guidance models is used to indicate the deviation from equal chance expected for the coming three-month period, with the following outcomes the most likely (but not certain) for this region:
- Temperatures are equally likely to be near average (45% chance) or above average (45% chance).
- Rainfall totals are about equally likely to be near normal (40% chance) or above normal (35% chance).
- Soil moisture levels and river flows are equally likely to be near normal (40% chance) or below normal (40% chance).
The full probability breakdown is:
|
Temperature |
Rainfall |
Soil moisture |
River flows |
|
|
Above average |
45 |
35 |
20 |
20 |
|
Near average |
45 |
40 |
40 |
40 |
|
Below average |
10 |
25 |
40 |
40 |
Central North Island, Taranaki, Whanganui, Manawatu, Wellington
Probabilities are assigned in three categories: above average, near average, and below average.
- Temperatures are equally likely to be near average (45% chance) or above average (45% chance).
- Rainfall totals are about equally likely to be near normal (40% chance) or above normal (35% chance).
- Soil moisture levels and river flows are about equally likely to be near normal (40% chance) or below normal (35% chance).
The full probability breakdown is:
|
Temperature |
Rainfall |
Soil moisture |
River flows |
|
|
Above average |
45 |
35 |
25 |
25 |
|
Near average |
45 |
40 |
40 |
40 |
|
Below average |
10 |
25 |
35 |
35 |
Gisborne, Hawke’s Bay, Wairarapa
Probabilities are assigned in three categories: above average, near average, and below average.
- Temperatures are equally likely to be near average (45% chance) or above average (45% chance).
- Rainfall totals are most likely to be near normal (45% chance).
- Soil moisture levels and river flows are equally likely to be near normal (40% chance) or below normal (40% chance).
The full probability breakdown is:
|
Temperature |
Rainfall |
Soil moisture |
River flows |
|
|
Above average |
45 |
25 |
20 |
20 |
|
Near average |
45 |
45 |
40 |
40 |
|
Below average |
10 |
30 |
40 |
40 |
Tasman, Nelson, Marlborough, Buller
Probabilities are assigned in three categories: above average, near average, and below average.
- Temperatures are equally likely to be near average (40% chance) or above average (40% chance).
- Rainfall totals are about equally likely to be near normal (40% chance) or below normal (35% chance).
- Soil moisture levels and river flows are equally likely to be near normal (40% chance) or below normal (40% chance).
The full probability breakdown is:
|
Temperature |
Rainfall |
Soil moisture |
River flows |
|
|
Above average |
40 |
25 |
20 |
20 |
|
Near average |
40 |
40 |
40 |
40 |
|
Below average |
20 |
35 |
40 |
40 |
West Coast, Alps and foothills, inland Otago, Southland
Probabilities are assigned in three categories: above average, near average, and below average.
- Temperatures are about equally likely to be above average (45% chance) or above average (40% chance).
- Rainfall totals are about equally likely to be below normal (40% chance) or near normal (35% chance).
- Soil moisture levels and river flows are about equally likely to be below normal (40% chance) or near normal (35-40% chance).
The full probability breakdown is:
|
Temperature |
Rainfall |
Soil moisture |
River flows |
|
|
Above average |
45 |
25 |
20 |
25 |
|
Near average |
40 |
35 |
40 |
35 |
|
Below average |
15 |
40 |
40 |
40 |
Coastal Canterbury, east Otago
Probabilities are assigned in three categories: above average, near average, and below average.
- Temperatures are about equally likely to be above average (45% chance) or near average (40% chance).
- Rainfall totals are about equally likely to be below normal (40% chance) or near normal (35% chance).
- Soil moisture levels and river flows are equally likely to be near normal (40% chance) or below normal (40% chance).
The full probability breakdown is:
|
Temperature |
Rainfall |
Soil moisture |
River flows |
|
|
Above average |
45 |
25 |
20 |
20 |
|
Near average |
40 |
40 |
40 |
40 |
|
Below average |
15 |
35 |
40 |
40 |
Graphical representation of the regional probabilities:

Background
The NINO3.4 Index anomaly (in the central Pacific) during March was -0.44˚C. This marked the first time since August 2020 that SSTs in this region were in the neutral range. The SOI (Southern Oscillation Index) value for March was +0.1 (in the neutral range).
In the subsurface equatorial Pacific, warming continued at depth in the west and central regions during March, associated with the expansion of the western Pacific warm pool. Ocean temperatures remained marginally cooler than normal closer to the surface. This is aligned with other indicators: La Niña has waned considerably and a transition to ENSO neutral is well underway, but it will likely take an additional month for the transition to fully occur.
According to the consensus from international models, the probability for ENSO neutral conditions is 66% for April – June. For July – September and October – December, the probability for ENSO neutral is 56% and 42% respectively.
During March, convective forcing was influenced by the active phase of the Madden-Julian Oscillation (MJO) over Africa and the Indian Ocean, moving into Australasia at the end of the month.
When the MJO was active over the Indian Ocean during mid-March, it was associated with a weakening of jet stream winds and higher than normal air pressure around New Zealand. From late March into April, the MJO’s movement from Australasia into the Pacific is expected to spark periods of unsettled weather for New Zealand. A more substantial change in convective forcing is possible during June as La Niña fully fades.
The resultant patterns may be conducive to northern low pressure systems during April-May and drier than normal conditions in southern parts of the country during May-June.
New Zealand’s coastal water temperature anomalies increased during March with substantially warmer than average seas east of the South Island. Pockets of marine heatwave conditions were observed in east coastal Northland, western Auckland, East Cape, coastal Canterbury, and near Fiordland.
NZ coastal SSTs during March 2021(through the 30th)

|
North NI |
0.36˚C |
|
West NI |
0.33˚C |
|
East NI |
0.25˚C |
|
North SI |
0.15˚C |
|
West SI |
0.64˚C |
|
East SI |
0.53˚C |
The Southern Annular Mode (SAM) was briefly negative in early March before turning positive for the second and third week of the month. A more variable SAM pattern is expected during April as different climate drivers battle for dominance.
Forecast Confidence
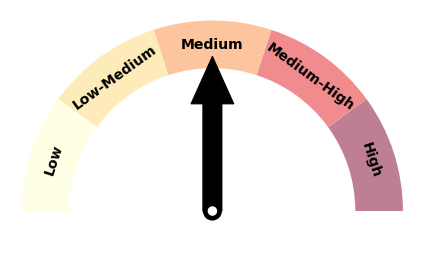
Temperature
|
Forecast confidence for temperatures is medium to high. Air flow patterns over the coming three months are not expected to favour cold southerlies. Warmer than average SSTs, particularly near the South Island, may have an upward influence on air temperatures. |
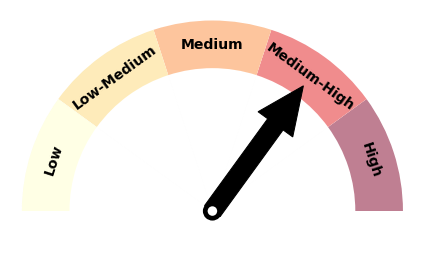
Rainfall
|
|
Forecast confidence for rainfall is medium. The easing of La Niña is expected to be associated with more variable weather patterns in the New Zealand region over the coming months. Activity associated with the MJO is contributing to increased climate predictability on the sub-seasonal scale, such as expected low pressure activity during April. |