Outlook Summary
- During autumn, New Zealand’s climate patterns are expected to become more variable as the impact from a non-traditional central Pacific La Niña starts to ease.
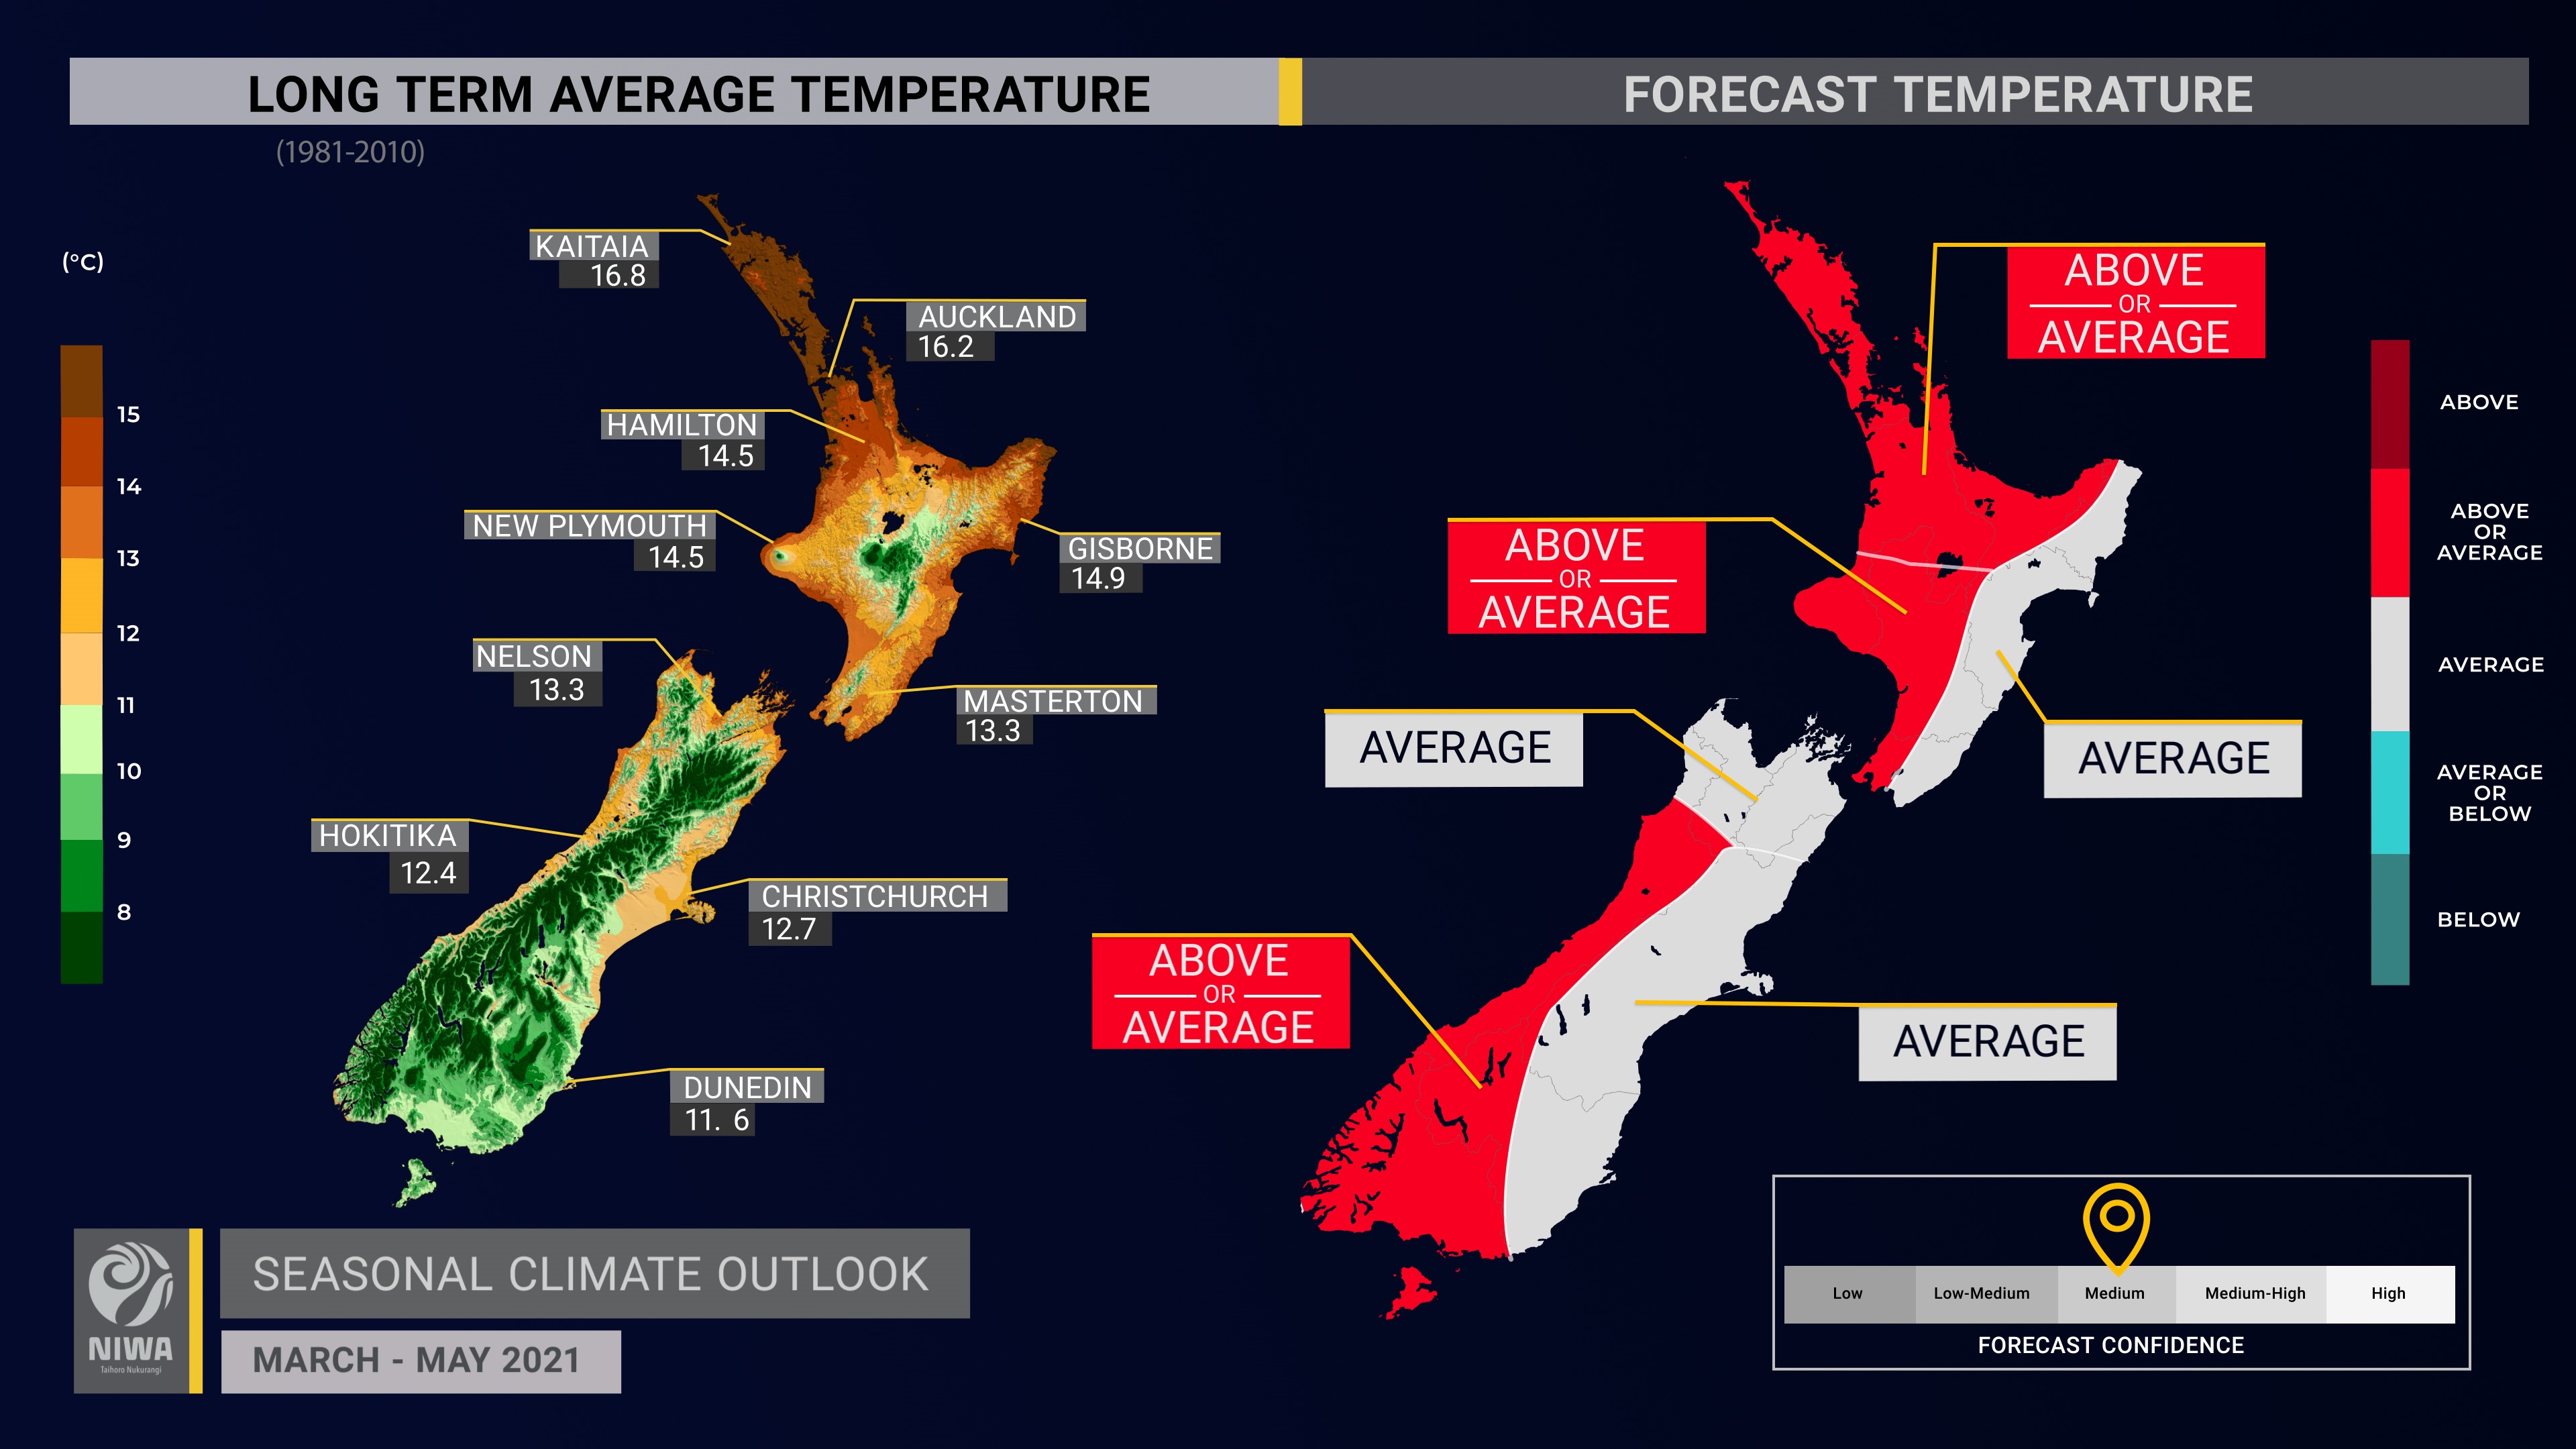
- Temperatures are most likely to be near average in the north and east of the South Island and east of the North Island and about equally likely to be near average or above average in all other regions. Cool spells are also likely to occur from time to time, such as during the first half of March.
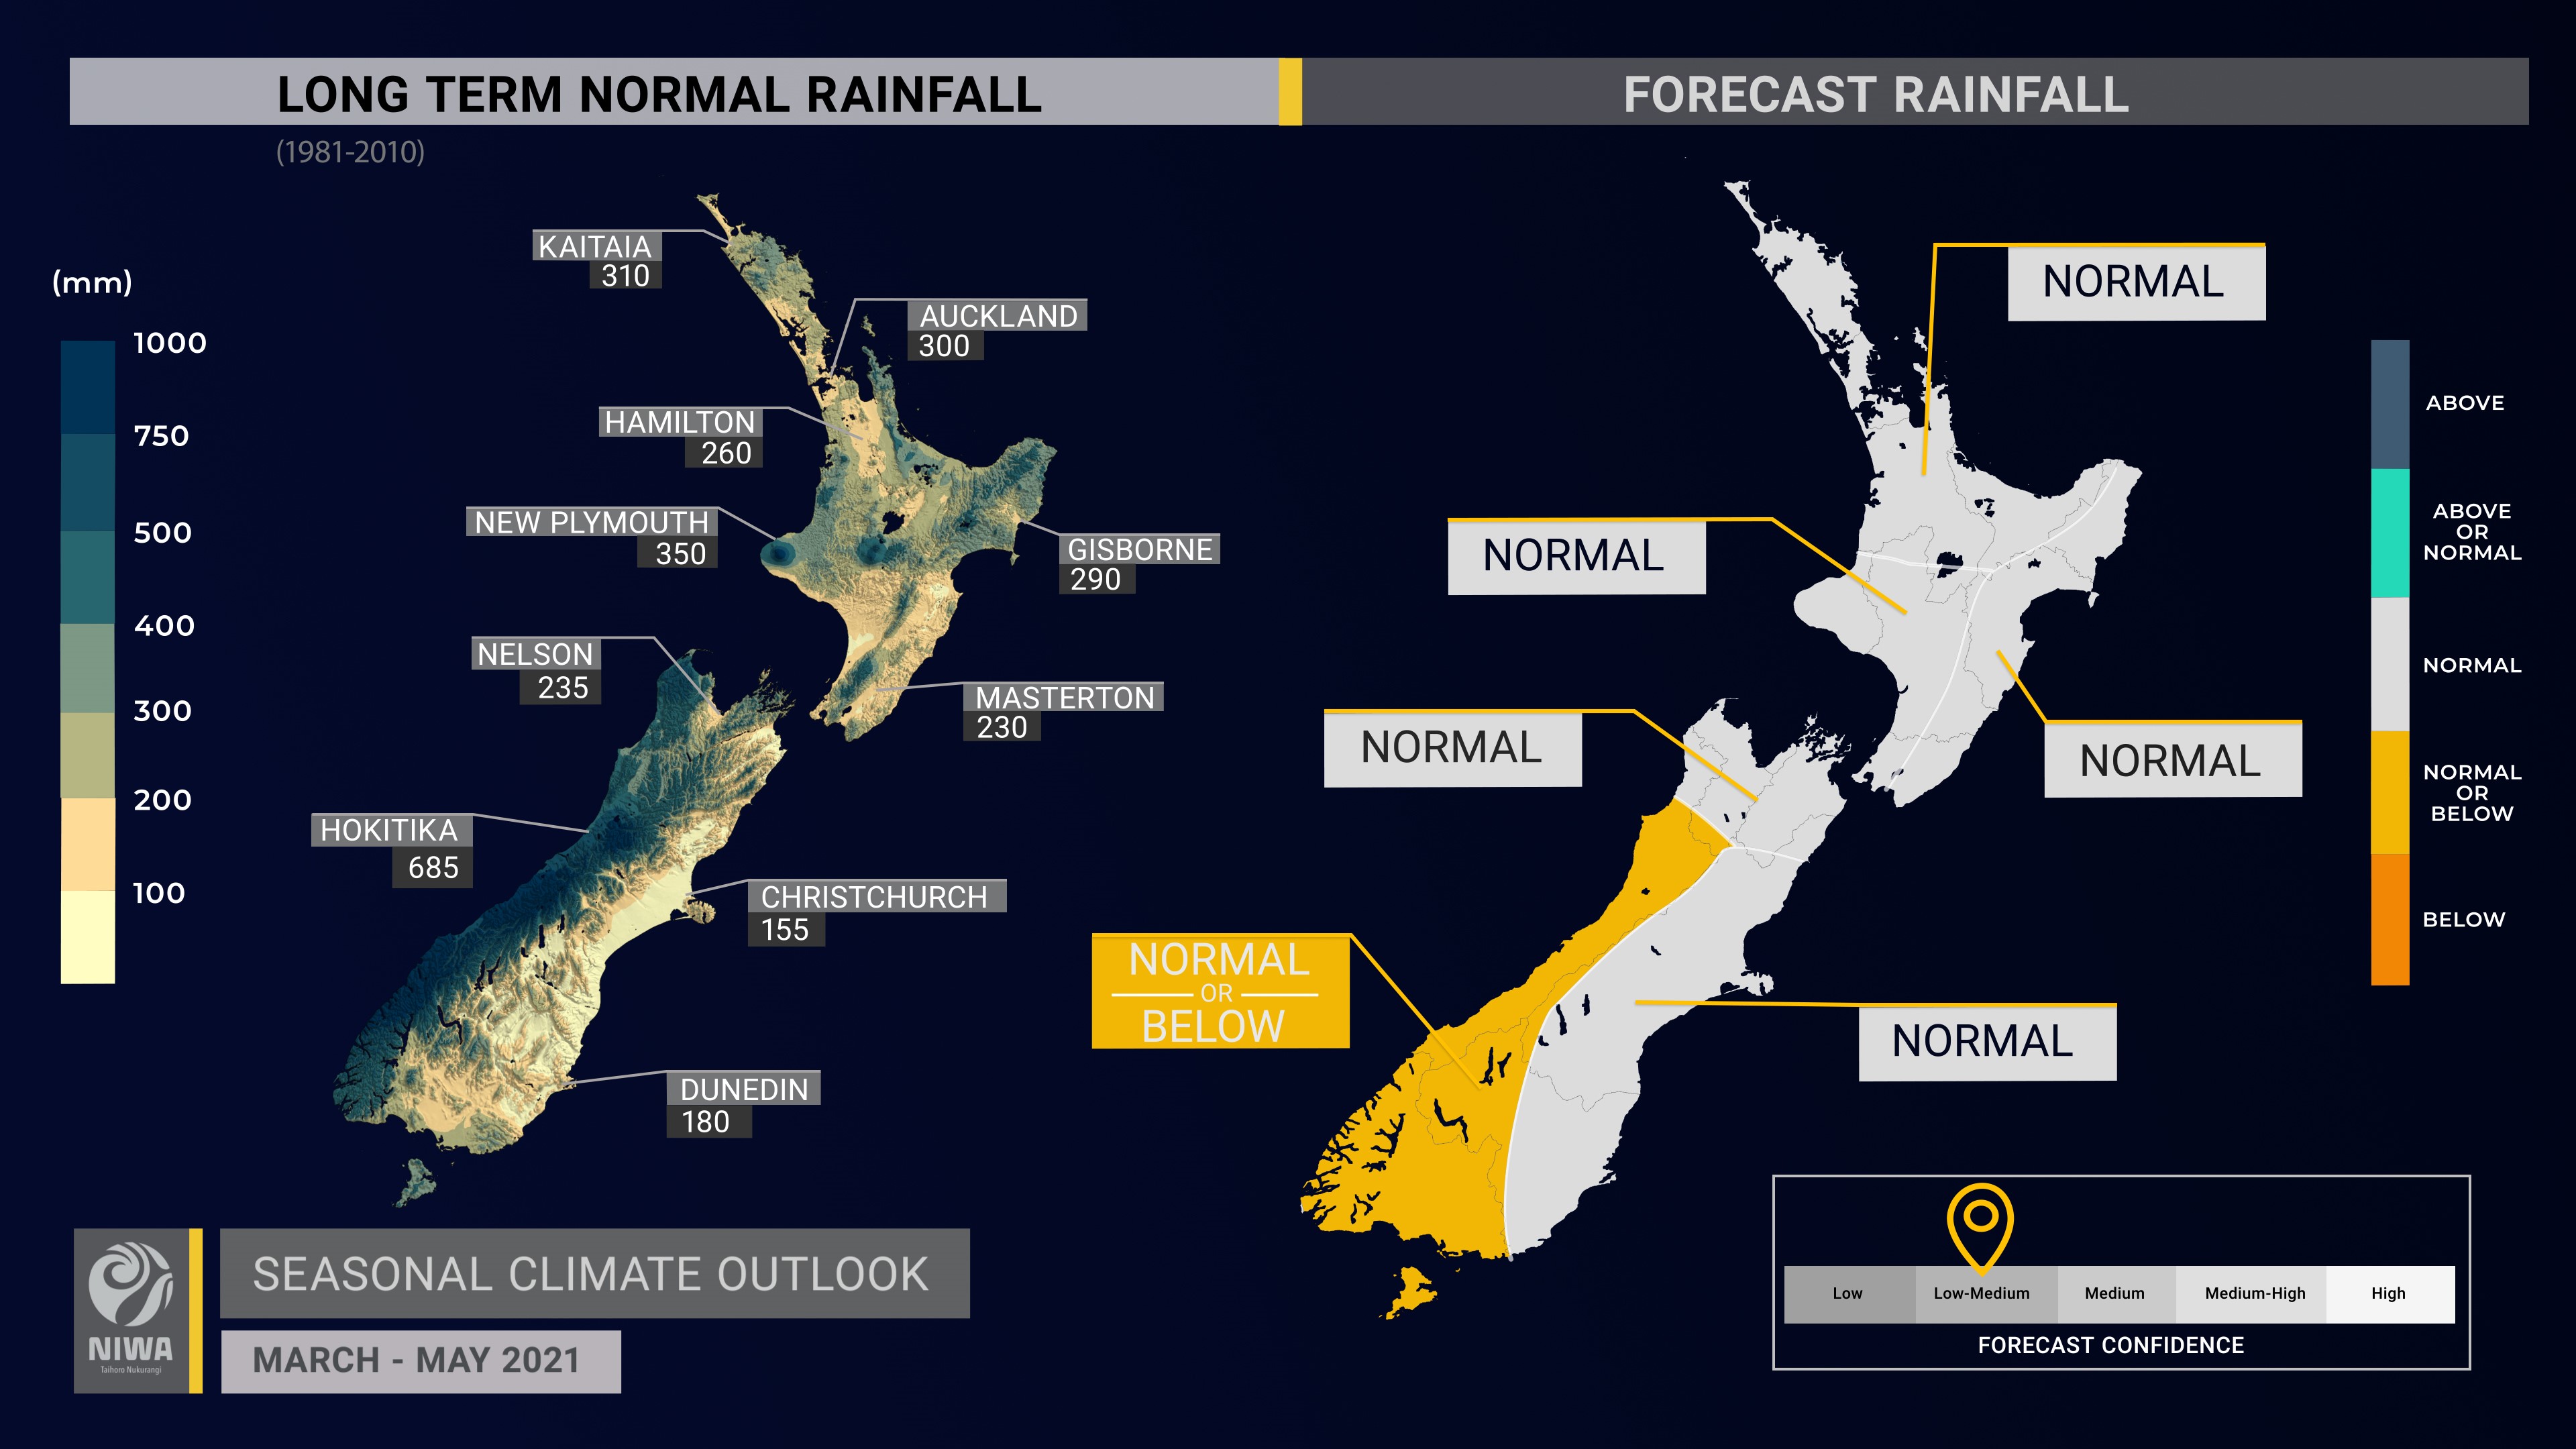
- Rainfall is about equally likely to be near normal or below normal in the west of the South Island. Near normal rainfall is most likely in all other regions as low pressure systems become more common in the NZ region.
- The tropical Southwest Pacific may feature cyclone activity during the first half of March. Should one of these features or their moisture affect New Zealand, heavy rainfall that can cause flooding would be possible for some regions, but it isn’t possible to predict where it would happen weeks in advance.
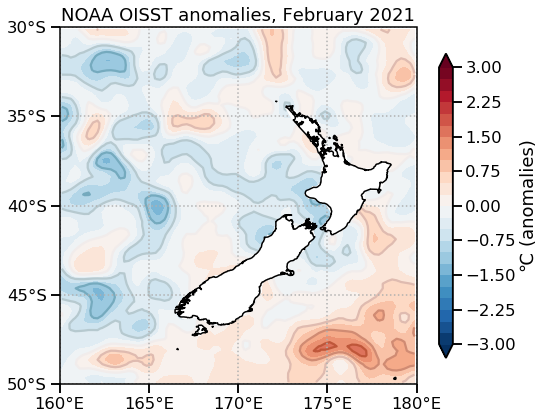
- Coastal sea surface temperatures (SSTs) ranged from -0.8˚C below average to near average during February.
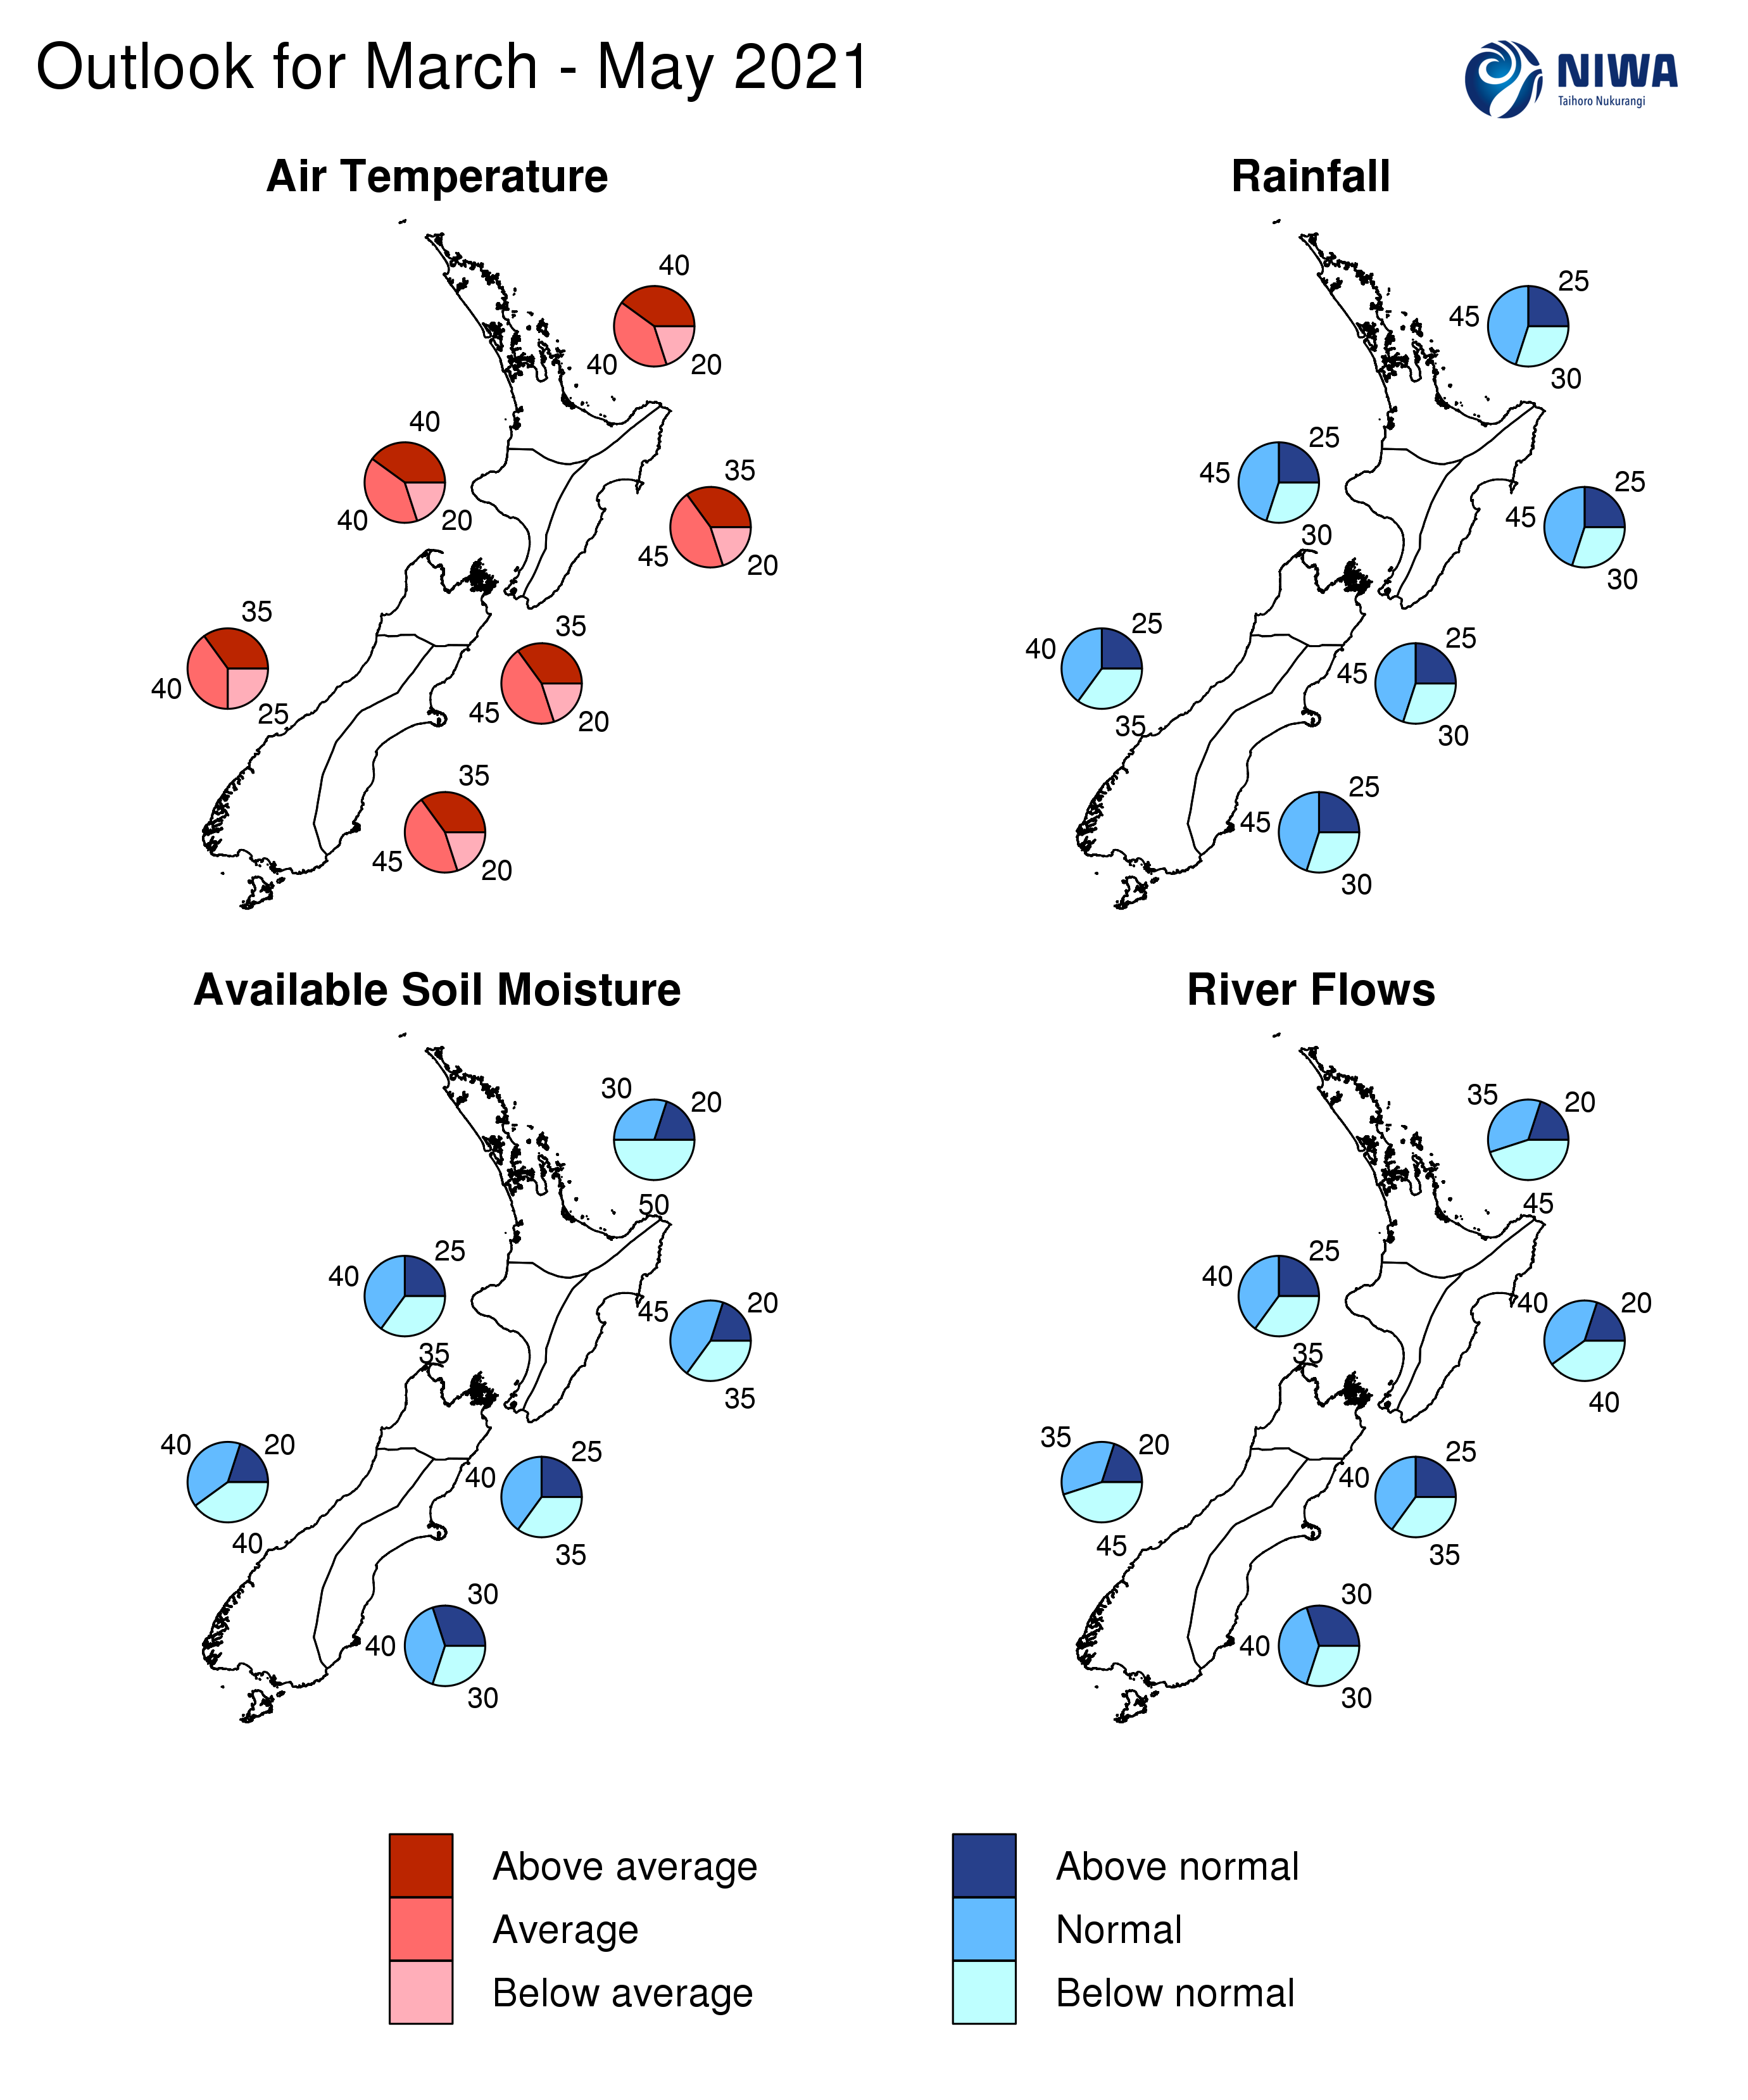
- Soil moisture levels are most likely to be below normal in the north of the North Island, near normal in the east of both islands, and about equally likely to be near normal or below normal in all other regions.
- River flows are most likely to be below normal in the north of the North Island and west of the South Island, near normal in the east of the South Island, and about equally likely to be near normal or below normal in all other regions.
Regional predictions for March – May 2021
Northland, Auckland, Waikato, Bay of Plenty
The table below shows the probabilities (or percent chances) for each of three categories: above average, near average, and below average. In the absence of any forecast guidance there would be an equal likelihood (33% chance) of the outcome being in any one of the three categories. Forecast information from local and global guidance models is used to indicate the deviation from equal chance expected for the coming three-month period, with the following outcomes the most likely (but not certain) for this region:
- Temperatures are about equally likely to be near average (40% chance) or above average (40% chance).
- Rainfall totals are most likely to be near normal (45% chance).
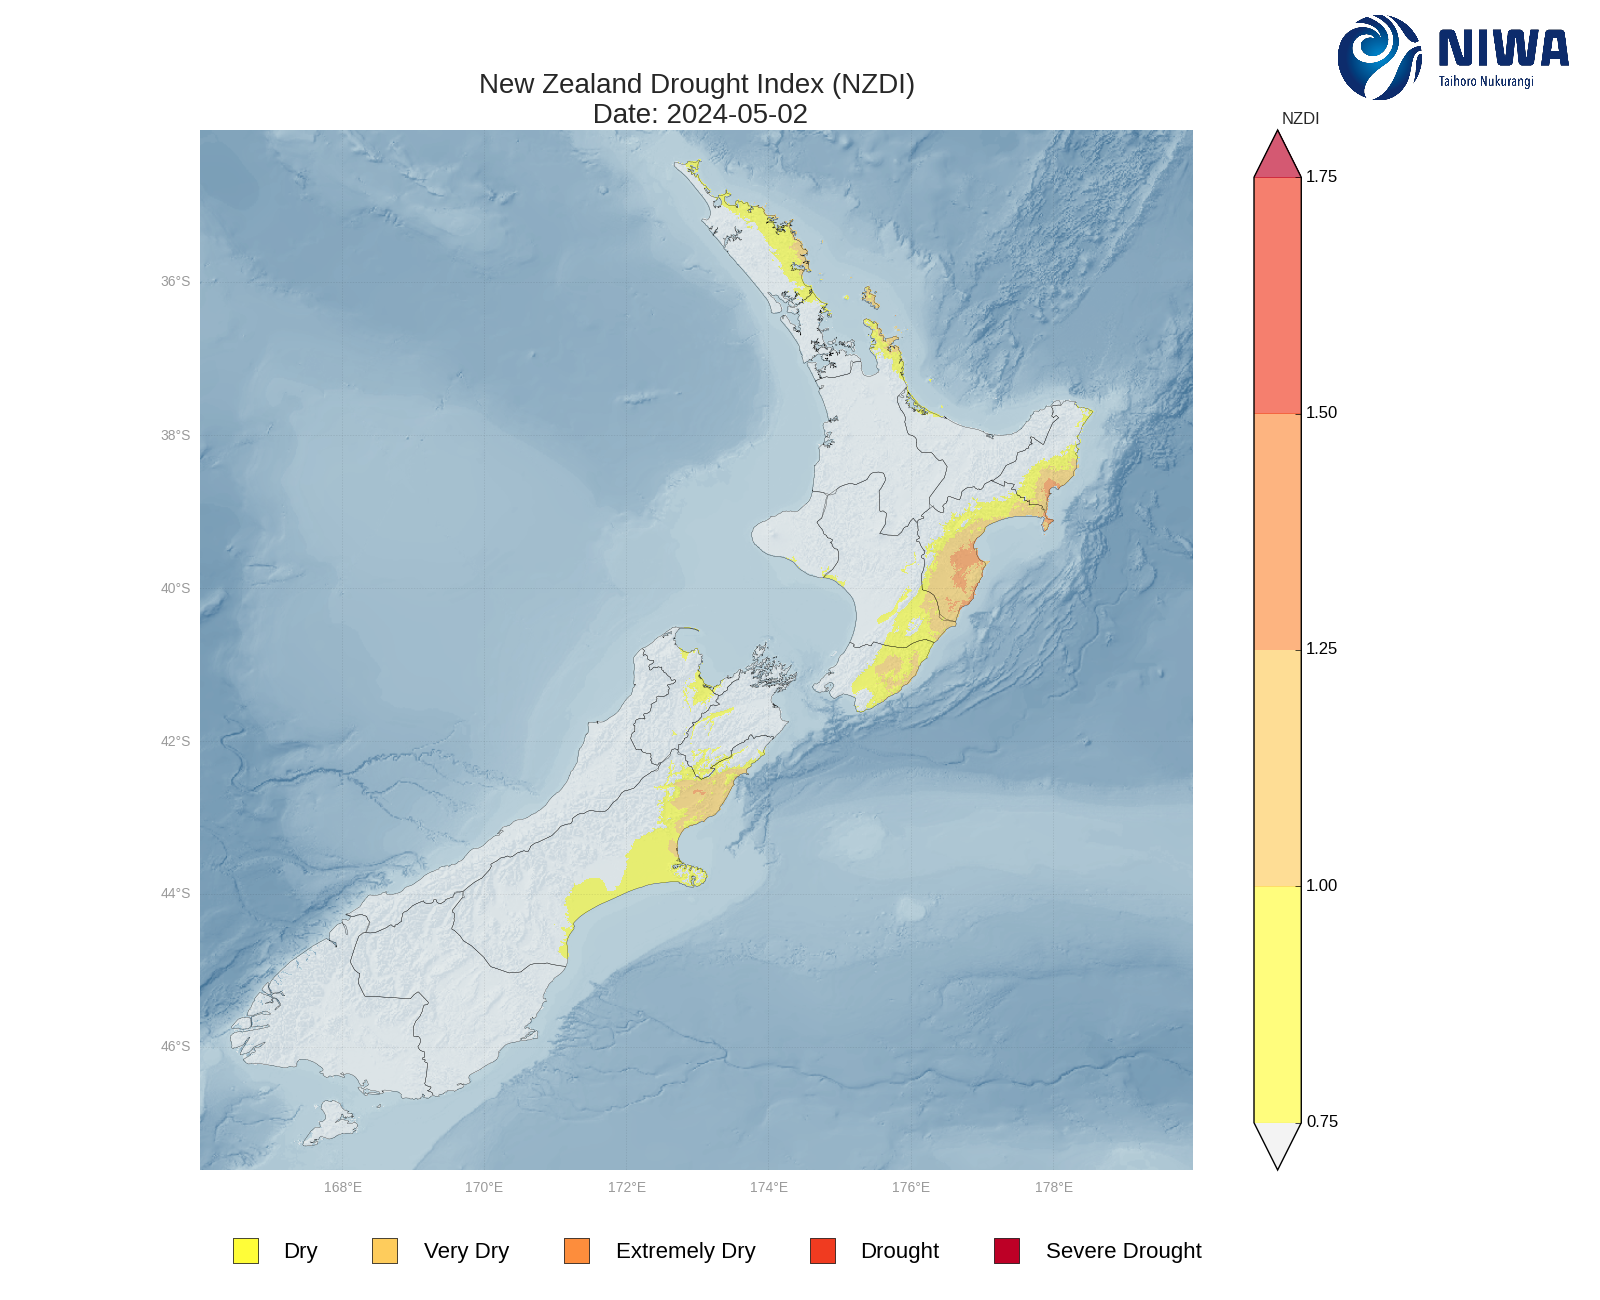
- Abnormally dry conditions are occurring across much of the region according to NIWA’s New Zealand Drought Index.
- Soil moisture levels and river flows are most likely to be below normal (45-50% chance).
The full probability breakdown is:
|
Temperature |
Rainfall |
Soil moisture |
River flows |
|
|
Above average |
40 |
25 |
20 |
20 |
|
Near average |
40 |
45 |
30 |
35 |
|
Below average |
20 |
30 |
50 |
45 |
Central North Island, Taranaki, Whanganui, Manawatu, Wellington
Probabilities are assigned in three categories: above average, near average, and below average.
- Temperatures are about equally likely to be near average (40% chance) or above average (40% chance).
- Rainfall totals are most likely to be near normal (45% chance).
- Soil moisture levels and river flows are about equally likely to be near normal (40% chance) or below normal (40% chance).
The full probability breakdown is:
|
Temperature |
Rainfall |
Soil moisture |
River flows |
|
|
Above average |
40 |
25 |
25 |
25 |
|
Near average |
40 |
45 |
40 |
40 |
|
Below average |
20 |
30 |
35 |
35 |
Gisborne, Hawke’s Bay, Wairarapa
Probabilities are assigned in three categories: above average, near average, and below average.
- Temperatures are most likely to be near average (45% chance).
- Rainfall totals are most likely to be near normal (45% chance).
- Abnormally dry conditions are occurring across Gisborne, Hawke’s Bay, and Wairarapa according to NIWA’s New Zealand Drought Index. Meteorological drought is occurring in East Cape.
- Soil moisture levels are most likely to be near normal (45% chance) while river flows are equally likely to be near normal (40% chance) or below normal (40% chance).
The full probability breakdown is:
|
Temperature |
Rainfall |
Soil moisture |
River flows |
|
|
Above average |
35 |
25 |
20 |
20 |
|
Near average |
45 |
45 |
45 |
40 |
|
Below average |
20 |
30 |
35 |
40 |
Tasman, Nelson, Marlborough, Buller
Probabilities are assigned in three categories: above average, near average, and below average.
- Temperatures are most likely to be near average (45% chance).
- Rainfall totals are most likely to be near normal (45% chance).
- Abnormally dry conditions are occurring across Marlborough, Nelson, and western Tasman according to NIWA’s New Zealand Drought Index.
- Soil moisture levels and river flows are about equally likely to be near normal (40% chance) or below normal (35% chance).
The full probability breakdown is:
|
Temperature |
Rainfall |
Soil moisture |
River flows |
|
|
Above average |
35 |
25 |
25 |
25 |
|
Near average |
45 |
45 |
40 |
40 |
|
Below average |
20 |
30 |
35 |
35 |
West Coast, Alps and foothills, inland Otago, Southland
Probabilities are assigned in three categories: above average, near average, and below average.
- Temperatures are about equally likely to be near average (40% chance) or above average (35% chance).
- Rainfall totals are about equally likely to be near normal (40% chance) or below normal (35% chance).
- Soil moisture levels are equally likely to be near normal (40% chance) or below normal (40% chance) while river flows are most likely to be below normal (45% chance).
The full probability breakdown is:
|
Temperature |
Rainfall |
Soil moisture |
River flows |
|
|
Above average |
35 |
25 |
20 |
20 |
|
Near average |
40 |
40 |
40 |
35 |
|
Below average |
25 |
35 |
40 |
45 |
Coastal Canterbury, east Otago
Probabilities are assigned in three categories: above average, near average, and below average.
- Temperatures are most likely to be near average (45% chance).
- Rainfall totals are most likely to be near normal (45% chance).
- Abnormally dry conditions are occurring in parts of mid and north Canterbury according to NIWA’s New Zealand Drought Index.
- Soil moisture levels and river flows are most likely to be near normal (40% chance).
The full probability breakdown is:
|
Temperature |
Rainfall |
Soil moisture |
River flows |
|
|
Above average |
35 |
25 |
30 |
30 |
|
Near average |
45 |
45 |
40 |
40 |
|
Below average |
20 |
30 |
30 |
30 |
Graphical representation of the regional probabilities
Background
The NINO3.4 Index anomaly (in the central Pacific) during February was -0.64˚C, increasing for the second consecutive month and now into “cool-neutral” territory, which sits between ENSO-neutral and La Niña. SSTs in the west-central Pacific continued in the La Niña range but subsided to neutral in the east. This signature (warmer west, cooler east) remained consistent with a non-traditional central Pacific La Niña known as Modoki.
The SOI (Southern Oscillation Index) value for February was +1.1 (in the La Niña range). While the oceanic La Niña has peaked, the atmospheric expression of La Niña is expected to continue for at least the start of autumn.
The subsurface equatorial central Pacific saw an intensification of its cool pool of water at depth, suggesting that the La Niña-like flavour of the climate system may persist for some time to come, even after traditional monitoring indices like the SOI and SSTs return to the neutral range.
According to the consensus from international models, the probability for La Niña conditions is 56% for March – May. For June – August, the probability for La Niña falls to 33% with ENSO-neutral favoured at 56%. During September – November, ENSO-neutral conditions and La Niña are about equally likely (40-45% chance each).
During February, convective forcing was influenced by La Niña and the active phase of the Madden-Julian Oscillation (MJO) in the western Pacific. The latter contributed to an atmospheric river event, bringing about a month’s worth of rainfall to parts of the northern and eastern North Island.
The MJO is expected to move across the Pacific during the first week to ten days of March, bringing a chance for unsettled and cooler weather to New Zealand. Tropical cyclone activity could increase to the north and west with an opportunity for some moisture to become wrapped into a mid-latitude cyclone closer to New Zealand.
In April and May, as La Niña continues to diminish, convective activity is expected to become more frequent about the eastern Pacific and South America, which can result in more frequent low pressure systems around New Zealand.
New Zealand’s coastal SSTs ranged from -0.8˚C below average to near average during February.
New Zealand Coastal Sea Surface Temperatures during February 2021 (through the 26th)
|
North NI |
-0.15˚C |
|
West NI |
-0.82˚C |
|
East NI |
0.01˚C |
|
North SI |
-0.60˚C |
|
West SI |
-0.12˚C |
|
East SI |
-0.03˚C |
The Southern Annular Mode (SAM) was strongly positive through the first half of February before becoming neutral. The SAM may become negative in early March in association with unsettled weather around New Zealand. A trend toward neutral or positive values is possible during the second half of the month.
Forecast Confidence
Temperature
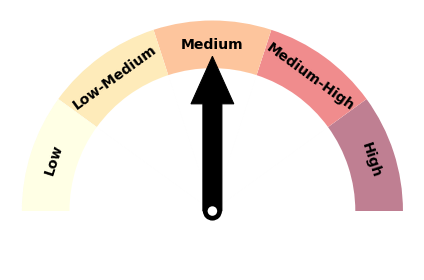
|
Forecast confidence for temperature is medium. The emergence of cooler than average SSTs and a weakening La Niña state means that New Zealand’s temperature patterns may turn more variable during the coming months. |
Rainfall
|
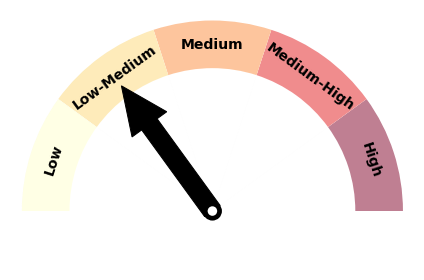
|
Forecast confidence for rainfall is low-medium. While the influence of a non-traditional La Niña is expected to gradually weaken over the coming months, it will still play a role in New Zealand’s weather patterns. Over summer, it was associated with drier than normal conditions across much of the country. Model guidance continues to predict wetter conditions, but this hasn’t been realised in recent months. |
