Outlook Summary
- Although moderate La Niña conditions continued during December, the impact was non-traditional for parts of New Zealand. This owes to persistently warm ocean waters in the tropical Indian Ocean and the flavour of the ongoing La Niña event.
- An example of the non-traditional impact of La Niña is the ongoing unusually dry conditions across the upper North Island. According to NIWA’s New Zealand Drought Index, abnormally dry conditions were affecting northern Waikato, Auckland, and Northland.
- While extended dry spells are expected to continue over the coming three months, three month rainfall totals are about equally likely to be near normal or above normal in the north of the North Island.
- Sub-tropical air flows may fuel areas of localised, heavy rainfall that can cause flooding, similar to what was in experienced in parts of the country during late December and early January. It is not possible to pinpoint exactly which regions may experience extreme weather months in advance, hence the need to keep an eye on day to day weather forecasts through the season.
- Extended dry spells will likely continue to be interspersed with the unsettled conditions, a by-product of the ongoing non-traditional La Niña and a predominantly positive Southern Annular Mode (SAM).
- Air pressure is forecast to be higher than normal over and to the southeast of New Zealand and occasionally lower than normal to the northwest. This is expected to be associated with northeasterly quarter air flow anomalies.
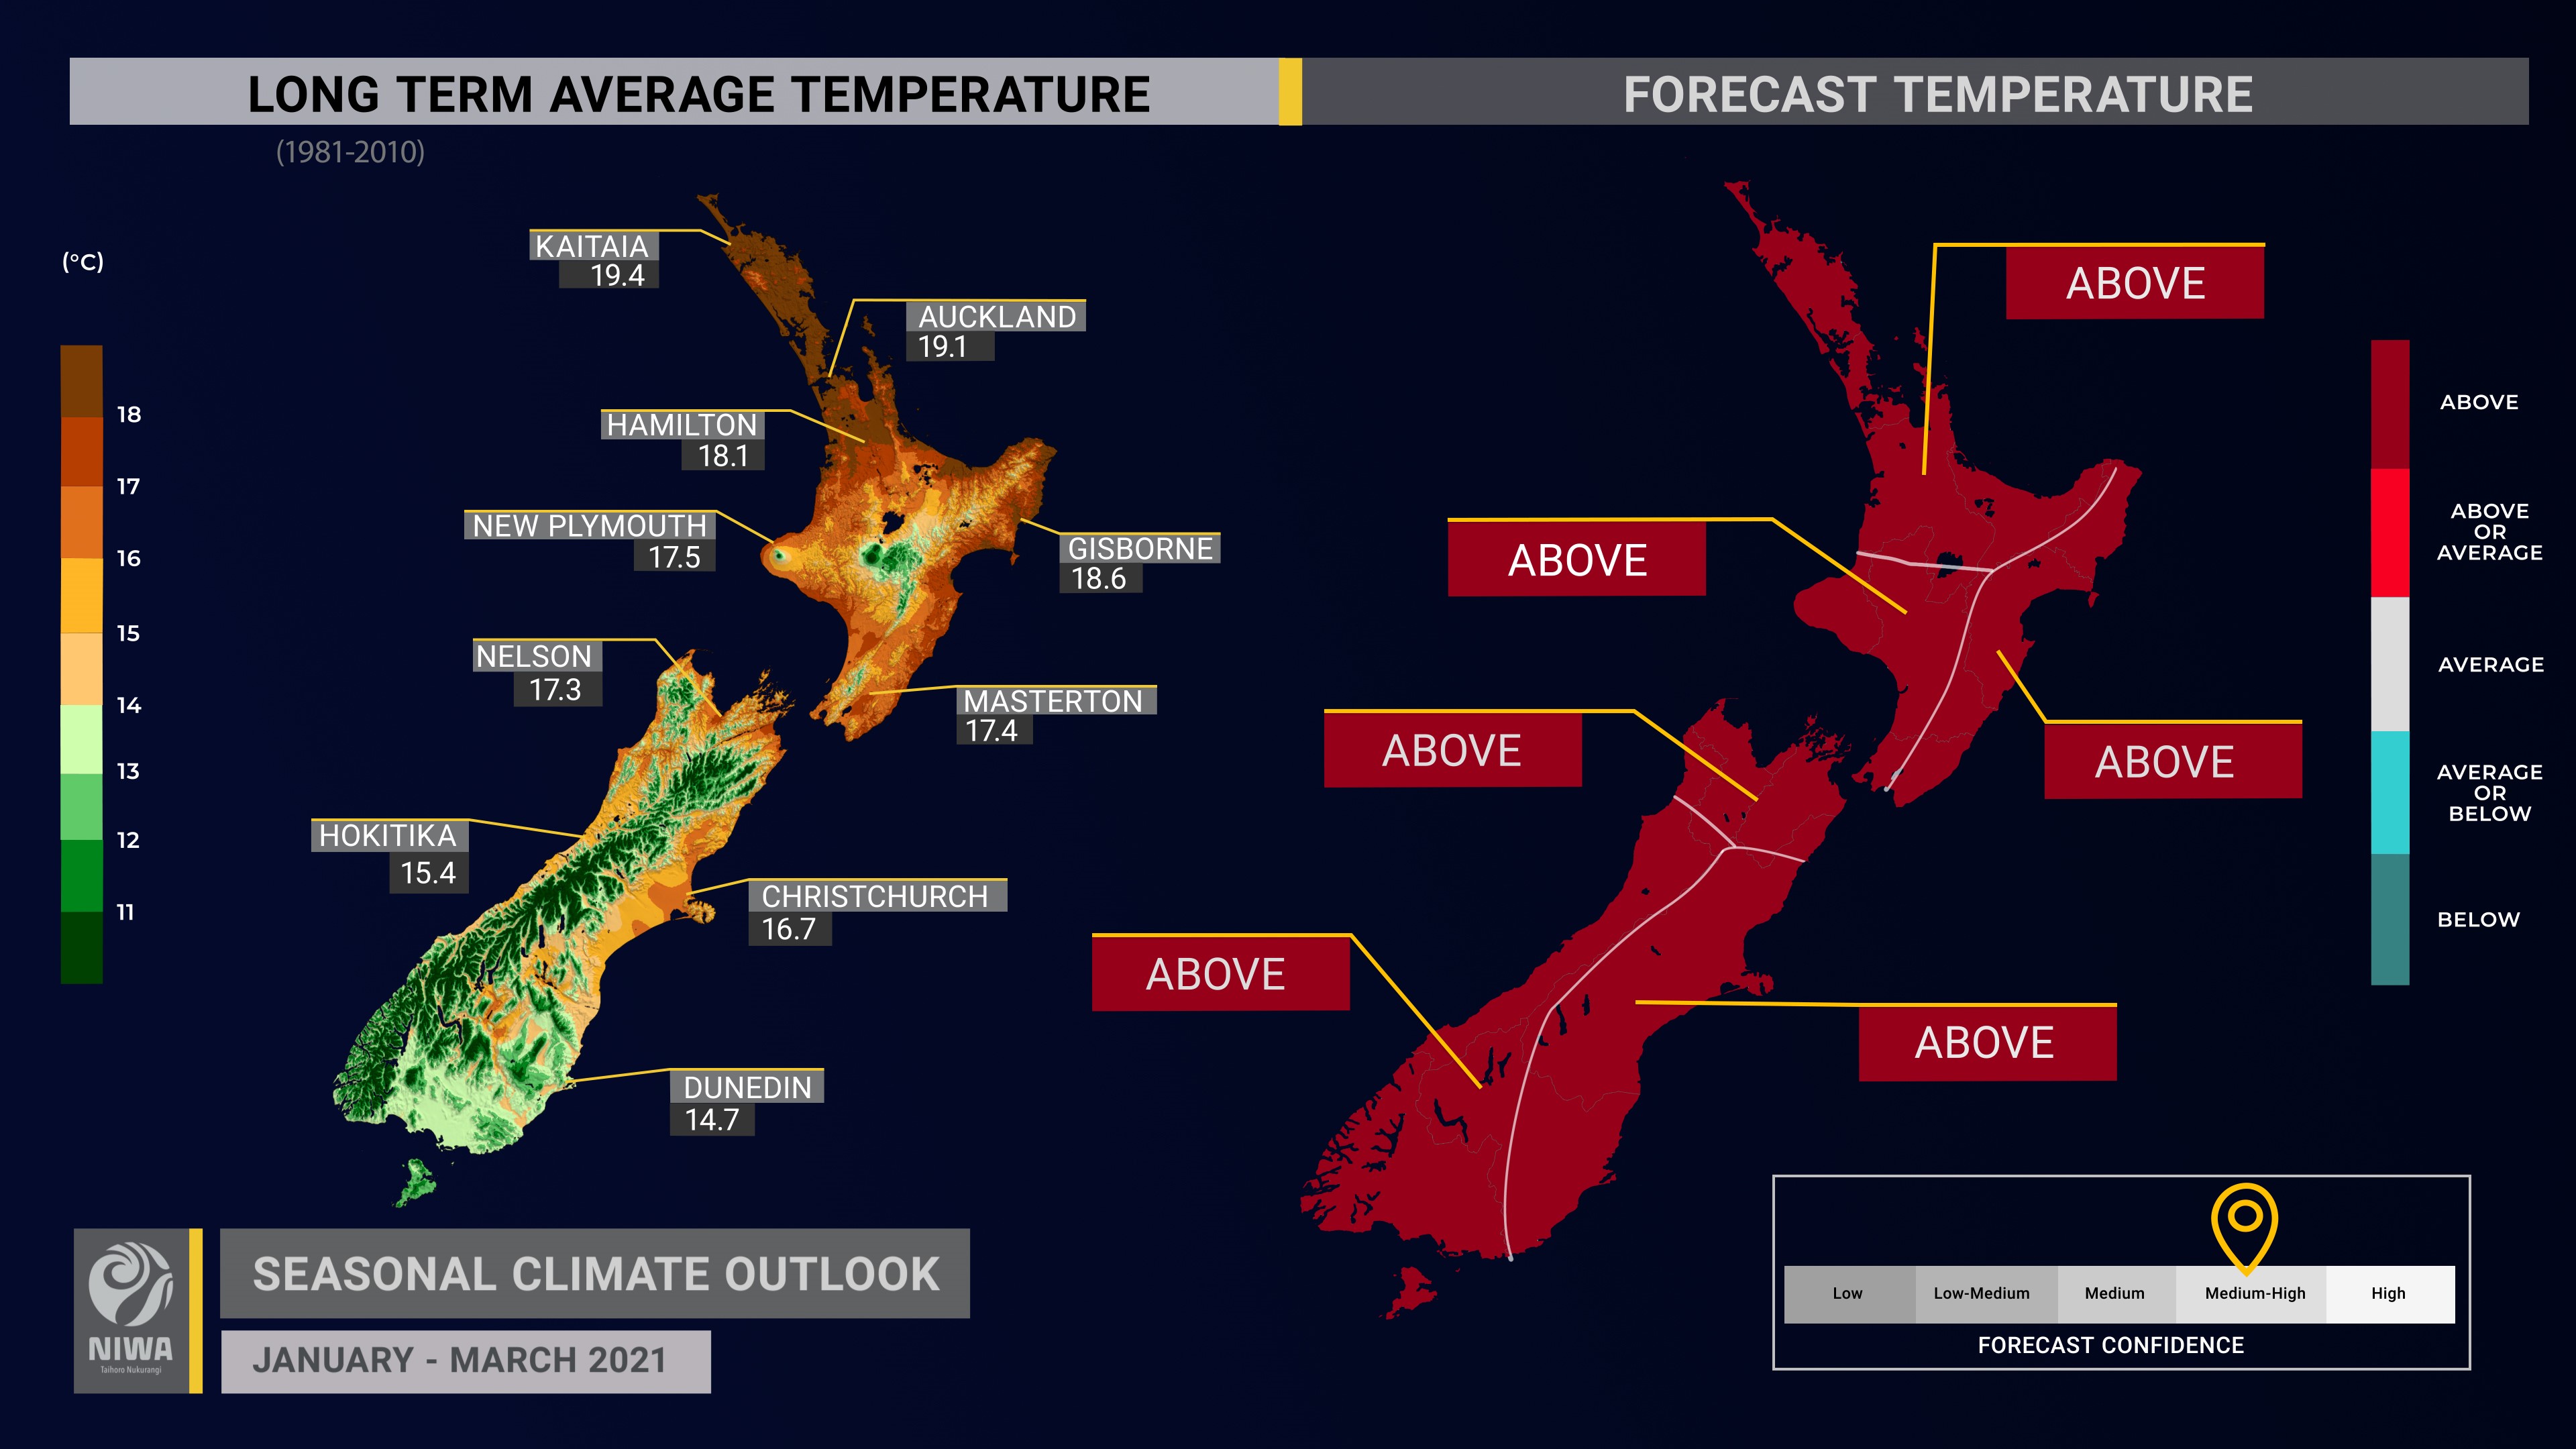
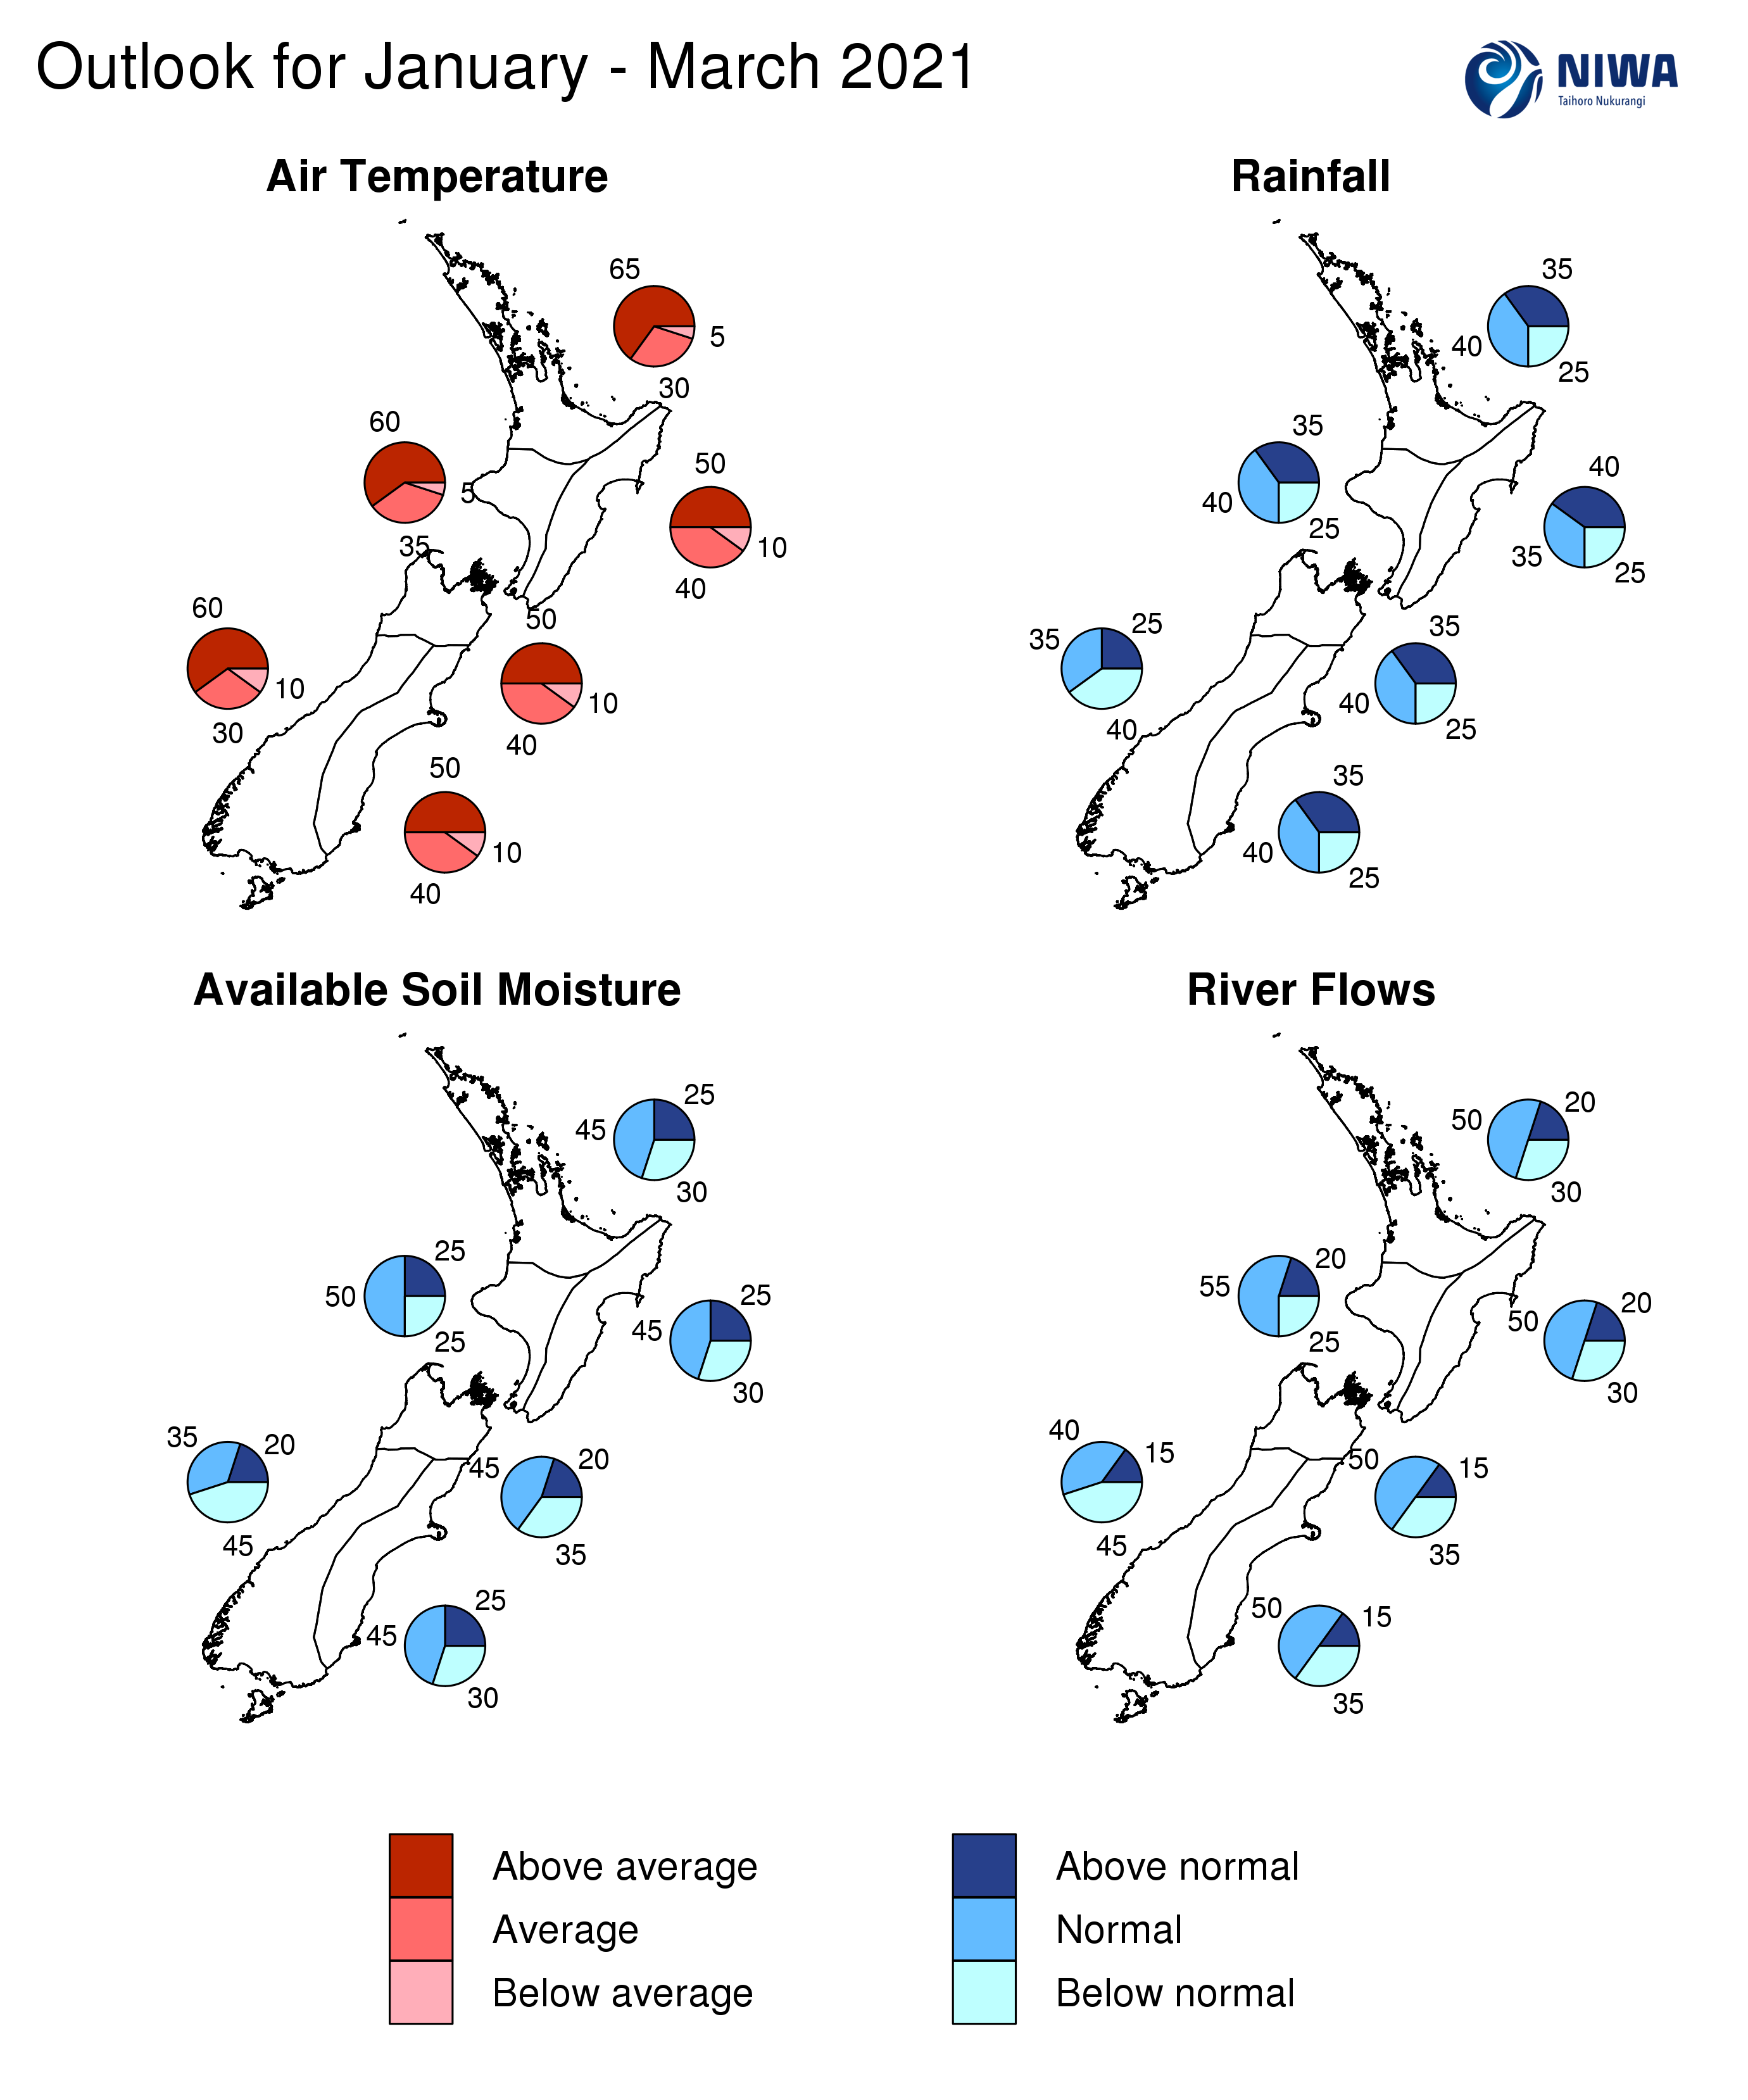
- Air temperatures are most likely to be above average in all regions of the country with elevated humidity levels from time to time, particularly in the North Island. An outlook of warmer than average three month temperatures doesn’t preclude cool snaps.
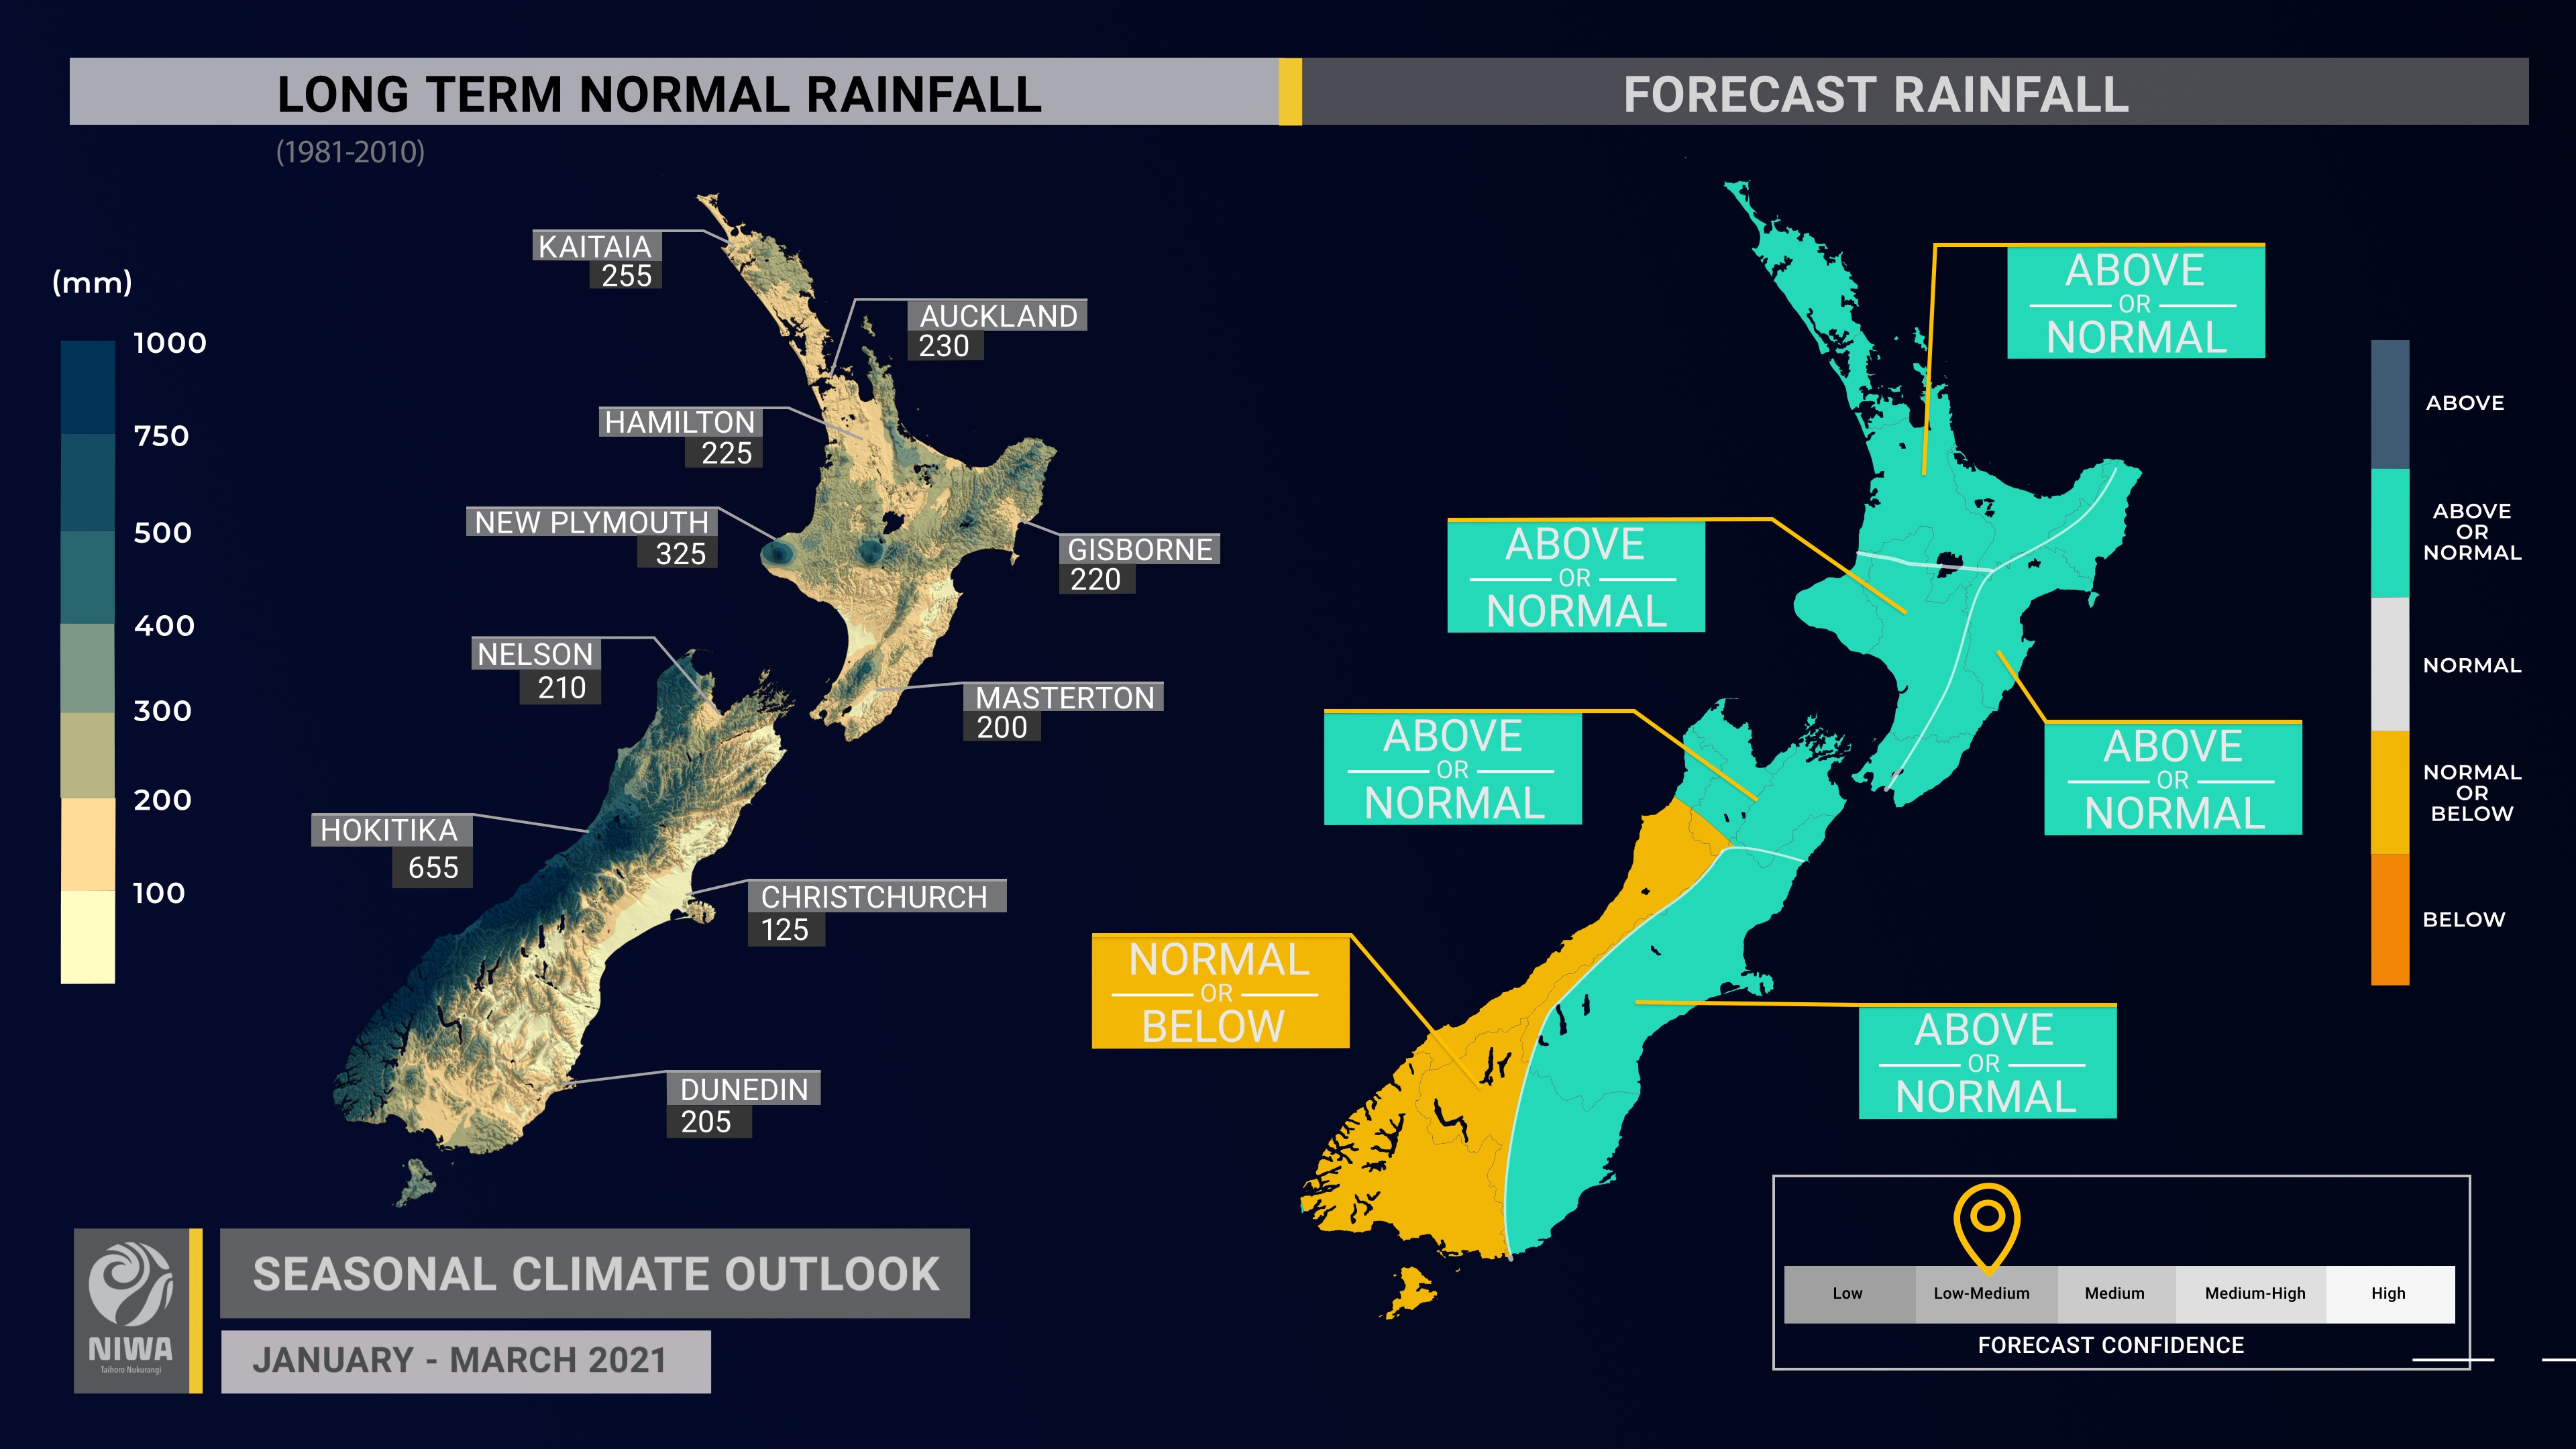
- Rainfall is about equally likely to be near normal or below normal in the west of the south Island and about equally likely to be near normal or above normal in the remaining regions of the country.
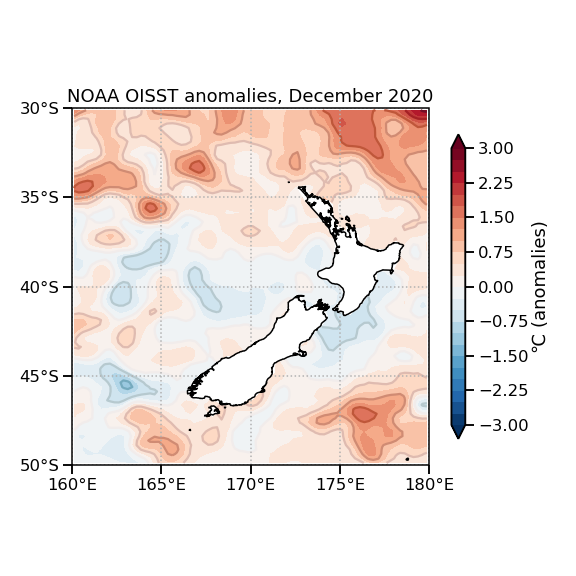
- Coastal sea surface temperature (SST) anomalies subsided to near average during December but have increased in early January, a trend that is expected to continue.
- Tropical cyclone (TC) development is unlikely in the Southwest Pacific over the next several weeks. However, for the current TC season (continuing through April), the risk for New Zealand remains elevated. On average, one ex-tropical cyclone passes near the country each year. Significant rainfall, damaging winds, and coastal inundation can occur during these events.
- Soil moisture levels are most likely to be below normal in the west of the South Island and most likely to near normal for the remaining regions of the country.
- River flows are about equally likely to be below normal or near normal in the west of the South Island and most likely to be near normal for the remaining regions of the country.
Regional predictions for January – March 2021
Northland, Auckland, Waikato, Bay of Plenty
The table below shows the probabilities (or percent chances) for each of three categories: above average, near average, and below average. In the absence of any forecast guidance there would be an equal likelihood (33% chance) of the outcome being in any one of the three categories. Forecast information from local and global guidance models is used to indicate the deviation from equal chance expected for the coming three-month period, with the following outcomes the most likely (but not certain) for this region:
- Temperatures are very likely to be above average (65% chance).
- Rainfall totals are about equally likely to be near normal (40% chance) or above normal (35% chance).
- Abnormally dry conditions are occurring across northern Waikato, Auckland, and Northland according to NIWA’s New Zealand Drought Index.
- Extended dry spells are expected to continue with the potential for periodic heavy rainfall, particularly later in the three month period.
- Soil moisture levels and river flows are most likely to be near normal (45-50% chance).
The full probability breakdown is:
|
Temperature |
Rainfall |
Soil moisture |
River flows |
|
|
Above average |
65 |
35 |
25 |
20 |
|
Near average |
30 |
40 |
45 |
50 |
|
Below average |
05 |
25 |
30 |
30 |
Central North Island, Taranaki, Whanganui, Manawatu, Wellington
Probabilities are assigned in three categories: above average, near average, and below average.
- Temperatures are very likely to be above average (60% chance).
- Rainfall totals are about equally likely to be near normal (40% chance) or above normal (35% chance).
- Soil moisture levels and river flows are most likely to be near normal (50-55% chance).
The full probability breakdown is:
|
Temperature |
Rainfall |
Soil moisture |
River flows |
|
|
Above average |
60 |
35 |
25 |
20 |
|
Near average |
35 |
40 |
50 |
55 |
|
Below average |
05 |
25 |
25 |
25 |
Gisborne, Hawke’s Bay, Wairarapa
Probabilities are assigned in three categories: above average, near average, and below average.
- Temperatures are most likely to be above average (50% chance).
- Rainfall totals are about equally likely to be above normal (40% chance) or near normal (35% chance).
- Episodes of heavy rainfall are possible, which could increase the chance for flooding events.
- Soil moisture levels and river flows are most likely to be near normal (45-50% chance).
The full probability breakdown is:
|
Temperature |
Rainfall |
Soil moisture |
River flows |
|
|
Above average |
50 |
40 |
25 |
20 |
|
Near average |
40 |
35 |
45 |
50 |
|
Below average |
10 |
25 |
30 |
30 |
Tasman, Nelson, Marlborough, Buller
Probabilities are assigned in three categories: above average, near average, and below average.
- Temperatures are most likely to be above average (50% chance).
- Rainfall totals are about equally likely to be near normal (40% chance) or above normal (35% chance).
- Soil moisture levels and river flows are most likely to be near normal (45-50% chance).
The full probability breakdown is:
|
Temperature |
Rainfall |
Soil moisture |
River flows |
|
|
Above average |
50 |
35 |
20 |
15 |
|
Near average |
40 |
40 |
45 |
50 |
|
Below average |
10 |
25 |
35 |
35 |
West Coast, Alps and foothills, inland Otago, Southland
Probabilities are assigned in three categories: above average, near average, and below average.
- Temperatures are very likely to be above average (60% chance).
- Rainfall totals are about equally likely to be below normal (40% chance) or near normal (35% chance).
- Warmer than average temperatures and drier than normal conditions are favoured to persist along the West Coast and about the hydro lake areas in particular.
- Soil moisture levels are most likely to be below normal (45% chance) while river flows are about equally likely to be below normal (45% chance) or near normal (40% chance).
The full probability breakdown is:
|
Temperature |
Rainfall |
Soil moisture |
River flows |
|
|
Above average |
60 |
25 |
20 |
15 |
|
Near average |
30 |
35 |
35 |
40 |
|
Below average |
10 |
40 |
45 |
45 |
Coastal Canterbury, east Otago
Probabilities are assigned in three categories: above average, near average, and below average.
- Temperatures are most likely to be above average (50% chance).
- Rainfall totals are about equally likely to be near normal (40% chance) or above normal (35% chance).
- Soil moisture levels and river flows are most likely to be near normal (45-50% chance).
The full probability breakdown is:
|
Temperature |
Rainfall |
Soil moisture |
River flows |
|
|
Above average |
50 |
35 |
25 |
15 |
|
Near average |
40 |
40 |
45 |
50 |
|
Below average |
10 |
25 |
30 |
35 |
Graphical representation of the regional probabilities
Background
The NINO3.4 Index anomaly (in the central Pacific) for the last month (through the 3rd of January) was -0.84˚C, increasing from -1.03˚C from last month. This likely means that the oceanic La Niña has peaked – however, La Niña’s influence on the atmosphere is expected to last for months to come. Overall, the most unusually cool SSTs continued in the central Pacific, consistent with a non-traditional central Pacific La Niña.
The SOI (Southern Oscillation Index) value for December 2020 was +1.6 (in the La Niña range), signalling that the tropical atmosphere continues to respond to La Niña’s ocean temperature anomalies.
During December, convective forcing and the Madden-Julian Oscillation (MJO) were active over the Maritime Continent, extending into the West Pacific, in association with the development of two tropical cyclones, Yasa and Zazu, in the Southwest Pacific.
In January, convective forcing is favoured over the Indian Ocean, located west of what is typical of La Niña. This is because of persistently warmer than average ocean waters across the Indian Ocean. For New Zealand, this favours high pressure over the country along with brief unsettled periods.
Over the next three months, convective activity may migrate eastward toward the Maritime Continent, a more classical La Niña response. This could favour a wetter North Island later in the three month period.
In the subsurface equatorial Pacific, ocean temperatures increased slightly during December. This was particularly evident near and just below the surface in the eastern part of the basin. Cool anomalies intensified in the central Pacific down to about 50m depth, more typical of the central Pacific style of La Niña. The West Pacific warm pool made little if any advancement at depth during December, meaning that La Niña is likely to continue over the next three months.
According to the consensus from international models, the probability for La Niña conditions is 92% for January – March. For April – June, the probability for La Niña falls to 32% with ENSO neutral favoured at 66%. During July – September, ENSO neutral conditions are most likely (52% chance).
During December, marine heatwave conditions temporarily eased in New Zealand coastal waters. This was due to a prevailing southwesterly air flow, which brought in cooler air masses from the Southern Ocean. Early January has seen a turnaround in coastal water temperatures, with a warming trend occurring in all regions. This warming trend is likely to continue through the month.
Abnormally warm ocean temperatures can have an impact on air temperatures over land and provide fuel to cyclones approaching from the north. The marine and fisheries sectors should continue to keep an eye on this situation.
New Zealand Coastal Sea Surface Temperatures during December 2020
|
North NI |
+0.26˚C |
|
West NI |
-0.26˚C |
|
East NI |
-0.19˚C |
|
North SI |
-0.21˚C |
|
West SI |
+0.06˚C |
|
East SI |
+0.17˚C |
The Southern Annular Mode (SAM) was positive throughout December. It was associated with higher than normal air pressure in the New Zealand region and lower pressure in the Southern Ocean and across Antarctica. The trend of a positive SAM is likely to continue through summer, influenced by lower pressures closer to the pole.
Forecast Confidence
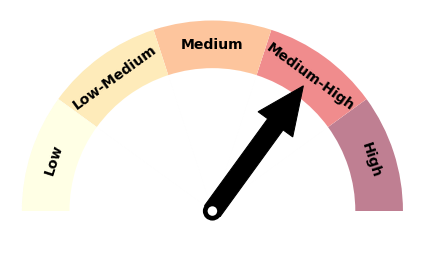
Temperature
|
Forecast confidence for temperatures is medium to high. Patterns of higher than normal pressure, northeasterly quarter winds, and the expectation for warmer than average sea temperatures support an outcome of warmer than average temperatures being most likely for the three months considered as a whole. |
Rainfall
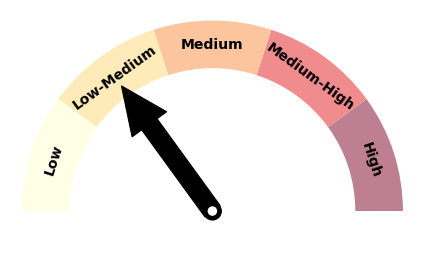
|
Forecast confidence for rainfall is low-medium. Although a climate driver (La Niña) will increase predictability, its impact is expected to be non-traditional – this is due to abnormally warm sea surface temperatures across the Indian Ocean and the type of La Niña. This confidence level is reflected by the relatively flat tercile (i.e. percentage) distribution for seasonal rainfall. |
