Overview
For the sixth consecutive month, ENSO-neutral conditions persisted across the tropical Pacific. In September 2018 however, the Southern Oscillation Index (SOI) continued to trend down and is now in the El Niño range with a value of –1. On the other hand, sea surface temperatures (SSTs) in the central and eastern equatorial Pacific remain in the neutral range: anomalies for the conventional NINO3.4 index remain just under the +0.3oC mark.
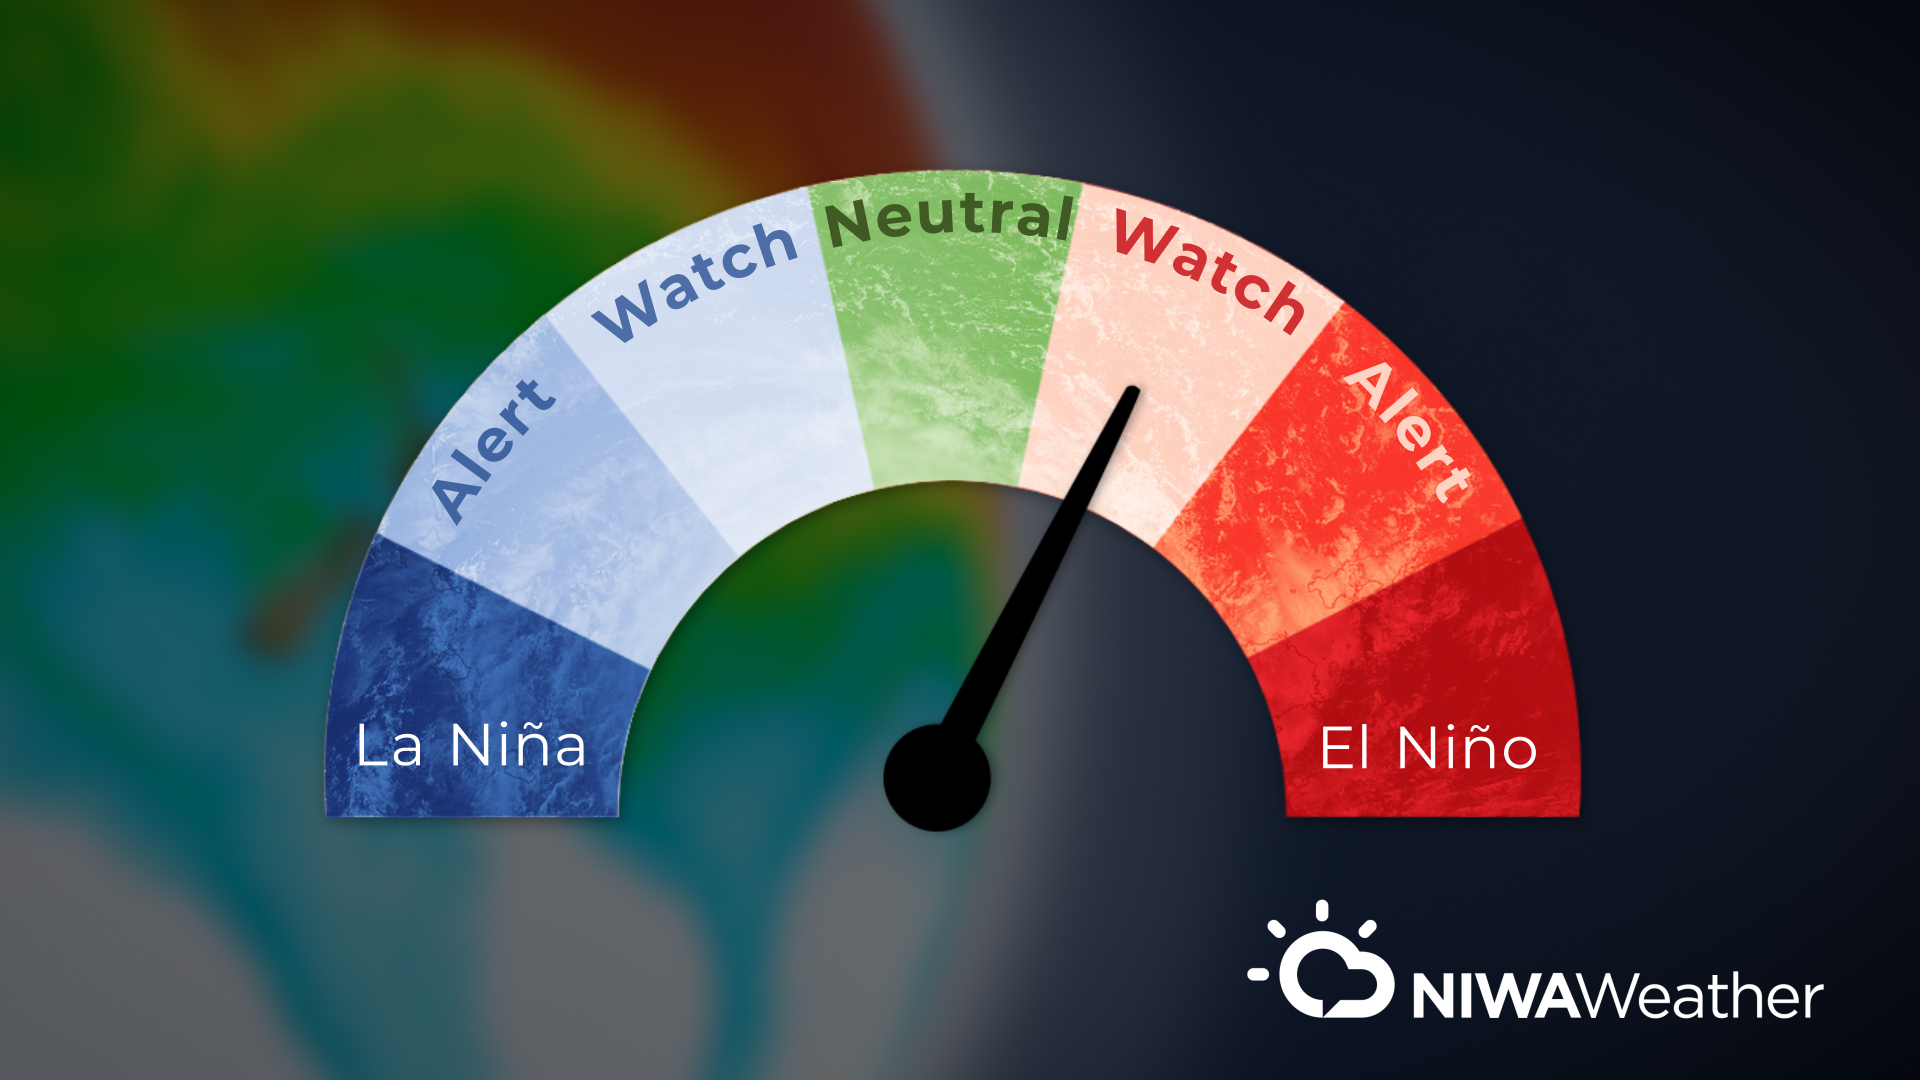
The consensus from international models is for the tropical Pacific to transition toward El Niño over the next three-month period (68% chance over October – December 2018). The probability for El Niño conditions being established remains high until autumn 2019, with a 71% chance for El Niño conditions over the April – June 2019 period. As was the case last month, most models forecast a rather weak event, characterised (at least initially) by maximum SST anomalies located in the central—rather than eastern—equatorial Pacific Ocean.
In other words, the upcoming El Niño event, should it come to fruition, is not expected to be of a similar intensity or type to what was experienced during 2015-16, 1997-98, or 1982-83.
The October – December 2018 atmospheric circulation around New Zealand is forecast to be characterized by higher pressure than normal to the west and southwest of New Zealand. This circulation pattern is expected to be associated with anticyclonic conditions extending over the country, interspersed by episodes of southerly and southwesterly winds. This circulation pattern may be associated with cold nights and mornings, as well as the potential for late-season frosts and fog, particularly during the month of October.
Furthermore, soil moisture is well below normal for the time of year across parts of the upper South Island and the expectation is for normal or below normal rainfall for the coming three-month period.
Outlook summary
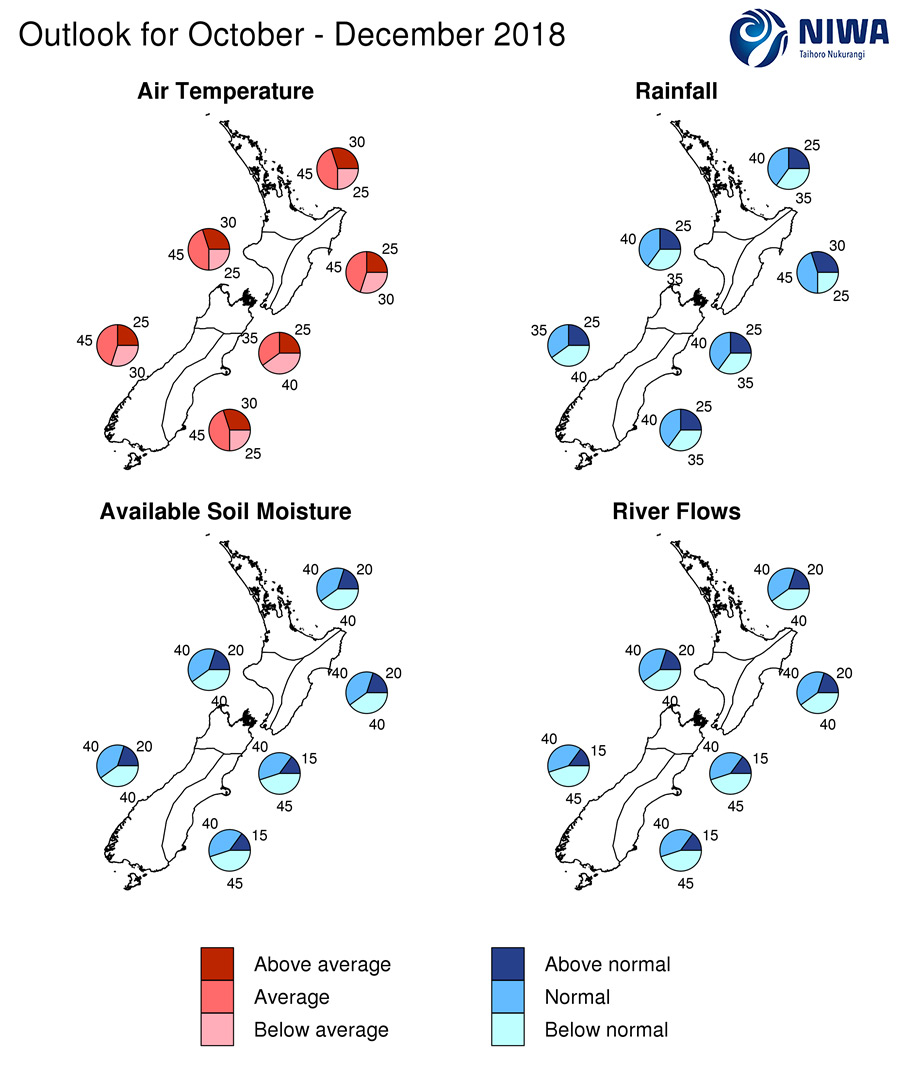
October – December 2018 temperatures are forecast to be average (45% chance) for all regions of New Zealand except the north of the South Island, where temperatures are forecast to be below average (40% chance) or near average (35% chance).

October – December 2018 rainfall totals are forecast to below normal (35 – 40% chance) or near normal (35 – 40% chance) for all regions of New Zealand except the east of the North Island, where near normal rainfall is most likely (45% chance).

October – December 2018 soil moisture levels and river flows are forecast to be below normal (40 –45% chance) or near normal (40% chance) for all regions of New Zealand.
Regional predictions for the October – December 2018 season
Northland, Auckland, Waikato, Bay of Plenty
The table below shows the probabilities (or percent chances) for each of three categories: above average, near average, and below average. In the absence of any forecast guidance there would be an equal likelihood (33% chance) of the outcome being in any one of the three categories. Forecast information from local and global guidance models is used to indicate the deviation from equal chance expected for the coming three-month period, with the following outcomes the most likely (but not certain) for this region:
- Temperatures are most likely to be near average (45% chance).
- Rainfall totals are about equally likely to be near normal (40% chance) or below normal (35% chance).
- Soil moisture levels and river flows are equally likely to be near normal (40% chance) or below normal (40% chance).
The full probability breakdown is:
|
Temperature |
Rainfall |
Soil moisture |
River flows |
|
|
Above average |
30 |
25 |
20 |
20 |
|
Near average |
45 |
40 |
40 |
40 |
|
Below average |
25 |
35 |
40 |
40 |
Central North Island, Taranaki, Whanganui, Manawatu, Wellington
Probabilities are assigned in three categories: above average, near average, and below average.
- Temperatures are about most likely to be near average (45% chance).
- Rainfall totals are about equally likely to be near normal (40% chance) or below normal (35% chance).
- Soil moisture levels and river flows are equally likely to be in the near normal (40% chance) or below normal range (40% chance).
The full probability breakdown is:
|
Temperature |
Rainfall |
Soil moisture |
River flows |
|
|
Above average |
30 |
25 |
20 |
20 |
|
Near average |
45 |
40 |
40 |
40 |
|
Below average |
25 |
35 |
40 |
40 |
Gisborne, Hawke’s Bay, Wairarapa
Probabilities are assigned in three categories: above average, near average, and below average.
- Temperatures are most likely to be near average (45% chance).
- Rainfall totals are most likely to be near normal (45% chance).
- Soil moisture levels and river flows are equally likely to be in the near normal (40% chance) or below normal range (40% chance).
The full probability breakdown is:
|
Temperature |
Rainfall |
Soil moisture |
River flows |
|
|
Above average |
25 |
30 |
20 |
20 |
|
Near average |
45 |
45 |
40 |
40 |
|
Below average |
30 |
25 |
40 |
40 |
Tasman, Nelson, Marlborough, Buller
Probabilities are assigned in three categories: above average, near average, and below average.
- Temperatures are about equally likely to be below average (40% chance) or near average (35%).
- Rainfall totals are about equally likely to be near normal (40% chance) or below normal (35% chance).
- Soil moisture levels and river flows are about equally likely to be in the below normal (45% chance) or near normal range (40% chance).
The full probability breakdown is:
|
Temperature |
Rainfall |
Soil moisture |
River flows |
|
|
Above average |
25 |
25 |
15 |
15 |
|
Near average |
35 |
40 |
40 |
40 |
|
Below average |
40 |
35 |
45 |
45 |
West Coast, Alps and foothills, inland Otago, Southland
Probabilities are assigned in three categories: above average, near average, and below average.
- Temperatures are most likely to be near average (45% chance).
- Rainfall totals are about equally likely to be below normal (40% chance) or near normal (35% chance)
- Soil moisture levels are equally likely to be near normal (40% chance) or below normal (40% chance).
- River flows are about equally likely to be below normal (45% chance) or near normal (40% chance).
The full probability breakdown is:
|
Temperature |
Rainfall |
Soil moisture |
River flows |
|
|
Above average |
25 |
25 |
20 |
15 |
|
Near average |
45 |
35 |
40 |
40 |
|
Below average |
30 |
40 |
40 |
45 |
Coastal Canterbury, east Otago
Probabilities are assigned in three categories: above average, near average, and below average.
- Temperatures are most likely to be near average (45% chance).
- Rainfall totals are about equally likely to be near normal (40% chance) or below normal (35% chance).
- Soil moisture levels and river flows are about equally likely to be below normal (45% chance) or near normal (40% chance).
The full probability breakdown is:
|
Temperature |
Rainfall |
Soil moisture |
River flows |
|
|
Above average |
30 |
25 |
15 |
15 |
|
Near average |
45 |
40 |
40 |
40 |
|
Below average |
25 |
35 |
45 |
45 |
Graphical representation of the regional probabilities
Background
The Southern Oscillation Index (SOI) is negative with a value of –1 for September 2018.
Sea surface temperatures (SSTs) across the equatorial Pacific remained mostly stable during September 2018 when compared to the previous months. The latest monthly NINO3.4 Index is in the neutral range, with a value of +0.3oC for September. The NINO3 index (in the eastern Pacific) is even weaker, at +0.25oC for September, while the NINO4 index (in the western Pacific) is the warmest with value of +0.57oC.
This pattern is similar to last month’s and again points toward the likelihood of El Niño developing (at least initially) in the so-called Modoki category, where the maximum SST anomaly is located in the central rather than the eastern Pacific. This means that the impact on New Zealand’s weather patterns may differ somewhat from what is typically experienced during a canonical, or conventional, El Niño event.
In the subsurface ocean, positive temperature anomalies (centred around 150m depth) expanded towards the eastern Pacific and strengthened during September 2018. Anomalies are now exceeding +3oC between the Dateline and 140oW. These anomalies at depth are associated with large heat content anomalies (> +2oC) being centred just west and over the international Dateline, again a signal consistent with the potential for a Modoki rather than a canonical, eastern Pacific El Niño event.
Trade winds during September 2018 were slightly weaker than normal over much of the tropical Pacific. The last week of September saw the emergence of a westerly wind burst (WWB), associated with a reversal of the climatological easterly trade winds west of 160oE. This WWB, along with the sizeable heat content anomalies in the central Pacific is expected to eventually tip the ocean – atmosphere system towards what is shaping to be a late-onset El Niño event.
Convective activity was enhanced over parts of the western equatorial Pacific but suppressed over Indonesia and parts of the eastern Indian Ocean, consistently with the development of a positive Indian Ocean Dipole (+IOD) event, which is often associated with subsequent development of El Niño and will likely have an influence on Southwest Pacific tropical cyclone activity heading into late 2018 and early 2019.
The consensus from international models is for the tropical Pacific to transition towards El Niño over the next three-month period (68% chance over October – December 2018). The probability for El Niño conditions being established remains high into the autumn of 2019, with a 71% chance for El Niño conditions over the April – June 2019 period, with some long-range models indicating the possibility of an event spanning two years (a protracted El Niño event). Almost all models are consistent in pointing towards a weak El Niño.
Near or below average SSTs are expected in New Zealand coastal waters during the next three months, which is generally consistent with +IOD events and weak El Niño conditions. The large area of positive SST anomalies offshore east and south of the country is forecast to persist.
Download
Seasonal Climate Outlook - Oct-Dec 2018 [PDF 3MB]
Contacts
Chris Brandolino, Principal Scientist – Forecasting, NIWA National Climate Centre Tel (09) 375 6335.
Dr Brett Mullan, Principal Scientist, NIWA National Climate Centre Tel (04) 386 0508.