Outlook Summary
- November 2020 – January 2021 air pressure is forecast to be higher than normal over and to the southeast and lower than normal to the northwest of New Zealand. This is expected to be associated with northeasterly air flow anomalies, a signature of La Niña.
- NIWA can confirm the arrival of La Niña conditions. Trends in the ocean-atmosphere system continued and New Zealand’s weather patterns became more aligned with La Niña throughout October. According to international guidance, the probability for oceanic La Niña conditions is 96% this season.
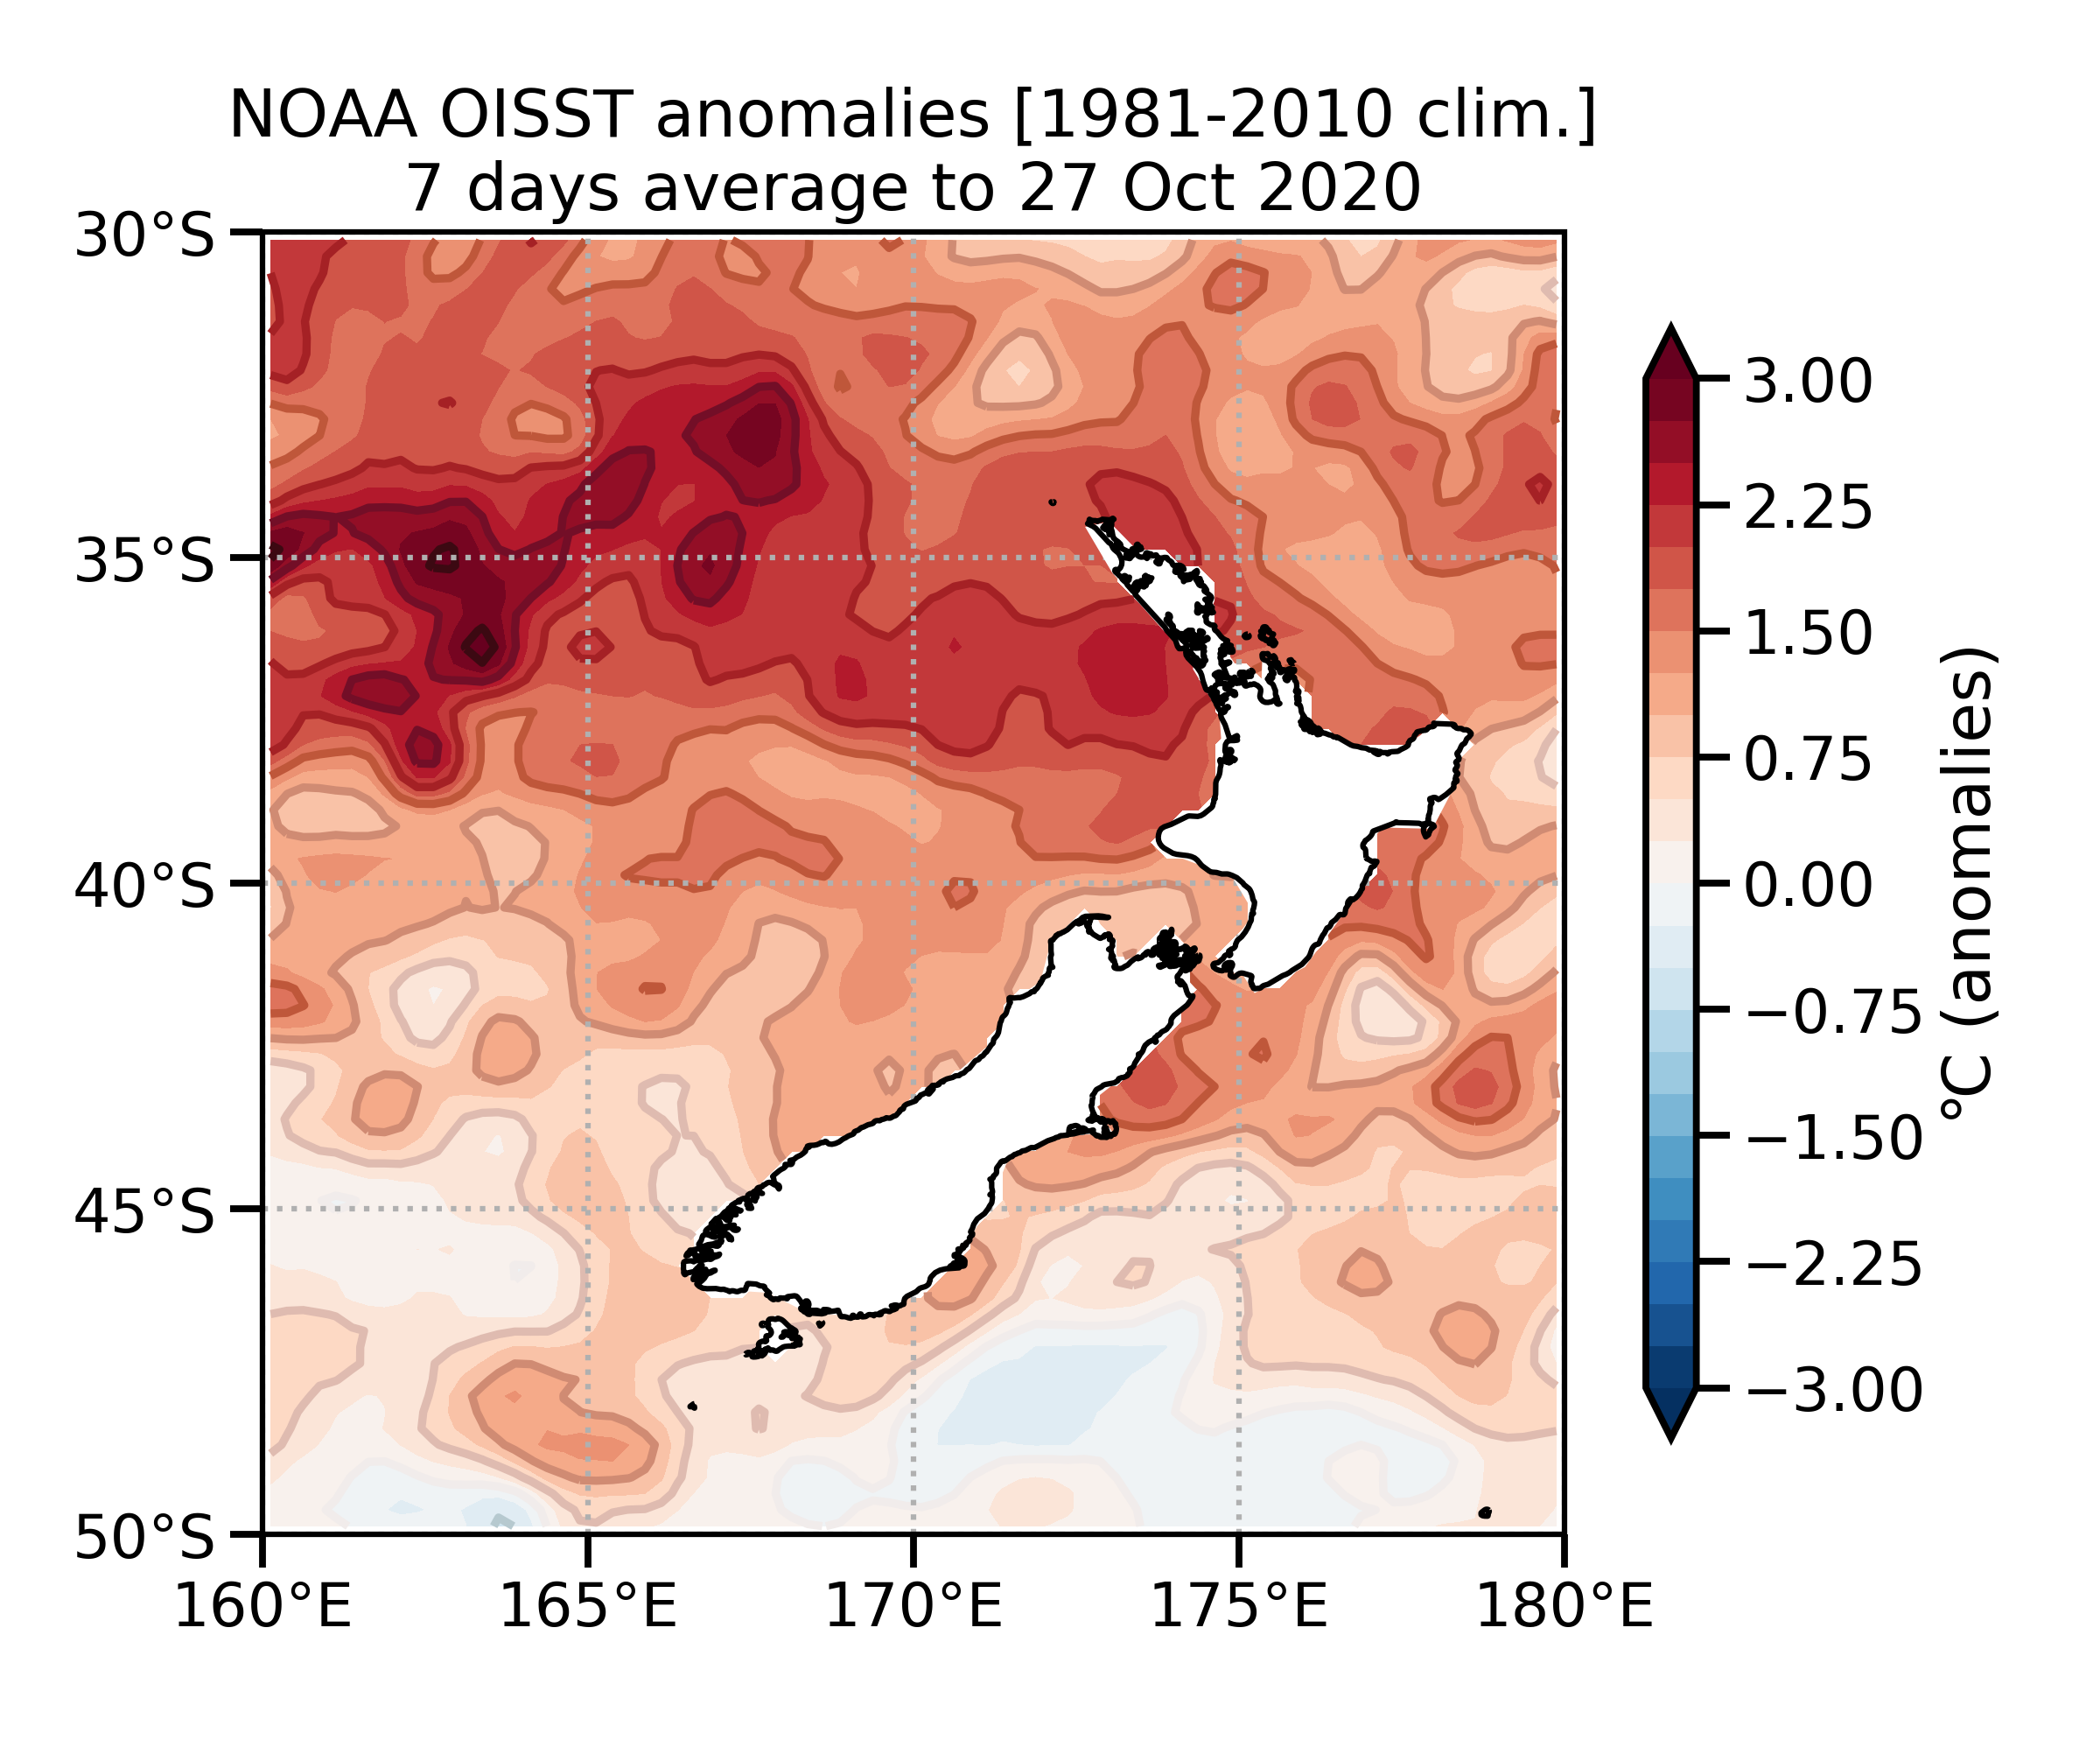
- Tasman Sea and New Zealand coastal water temperatures warmed considerably during October, particularly near the North Island, driven by warmer than average air temperatures, plenty of sunshine, and lighter winds.
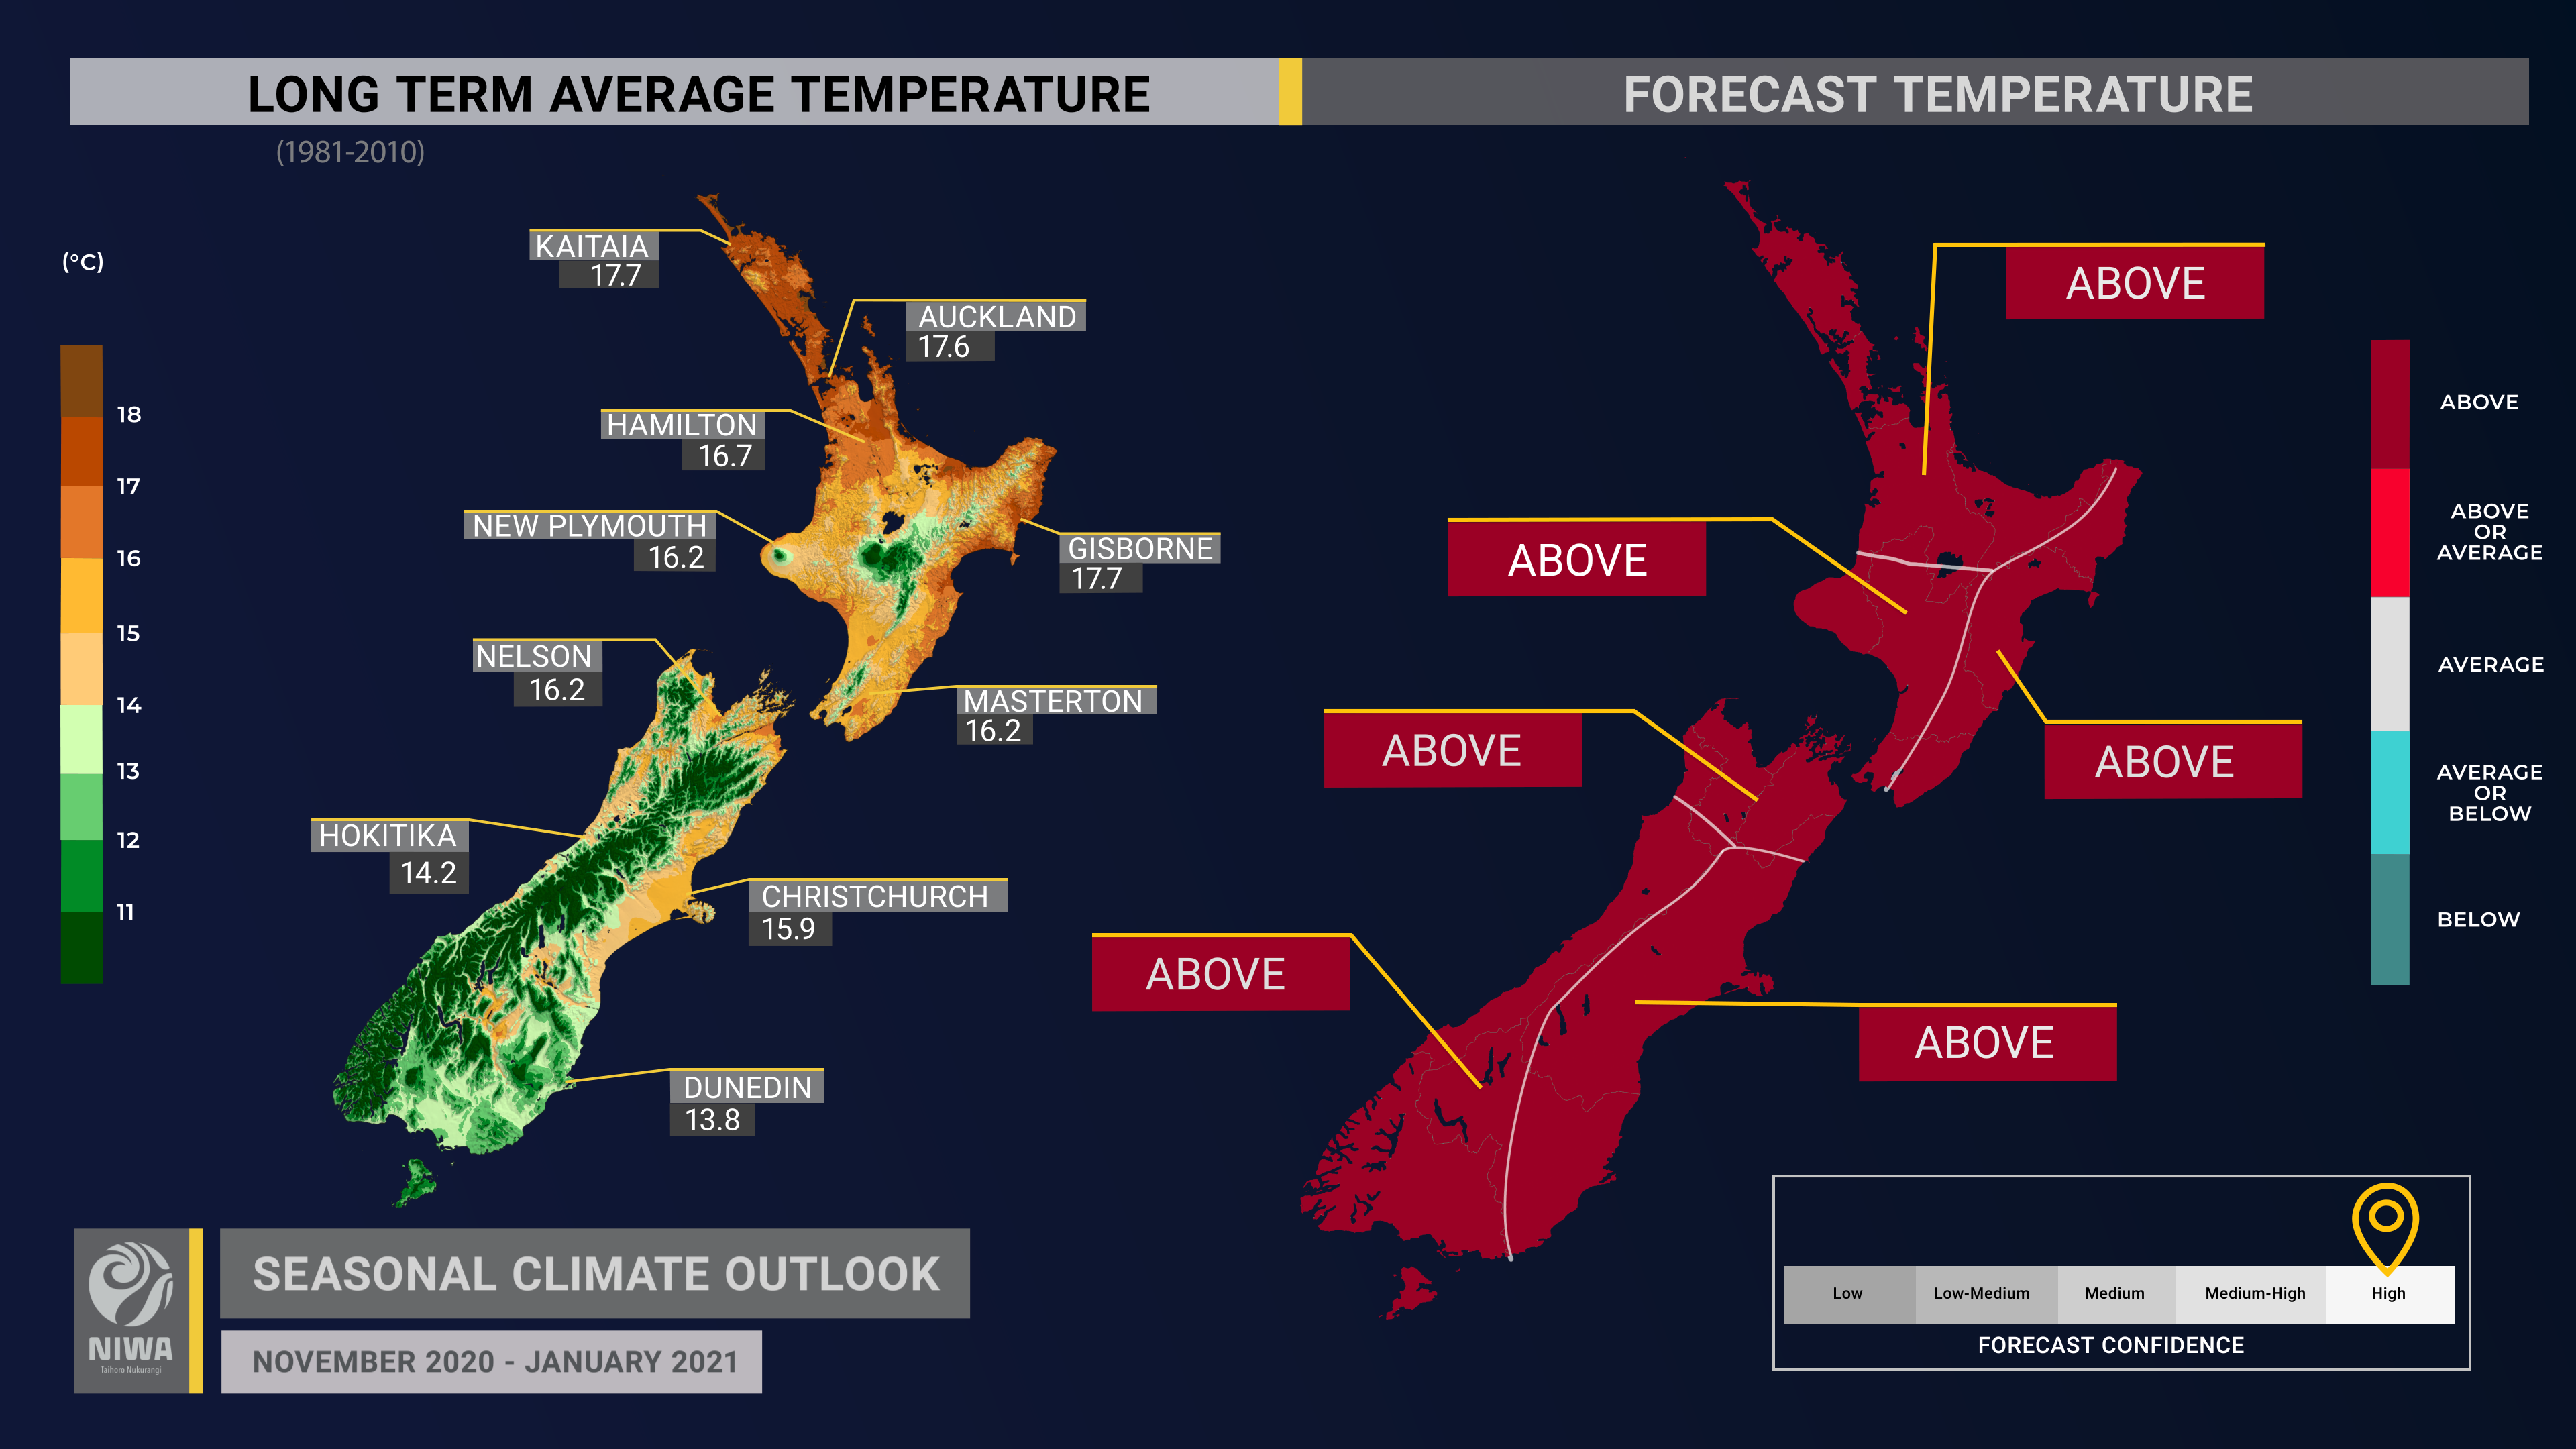
- Marine heatwave conditions may develop in the ocean surrounding New Zealand over the coming three month period, with air temperatures very likely to be above average in all regions of the country.
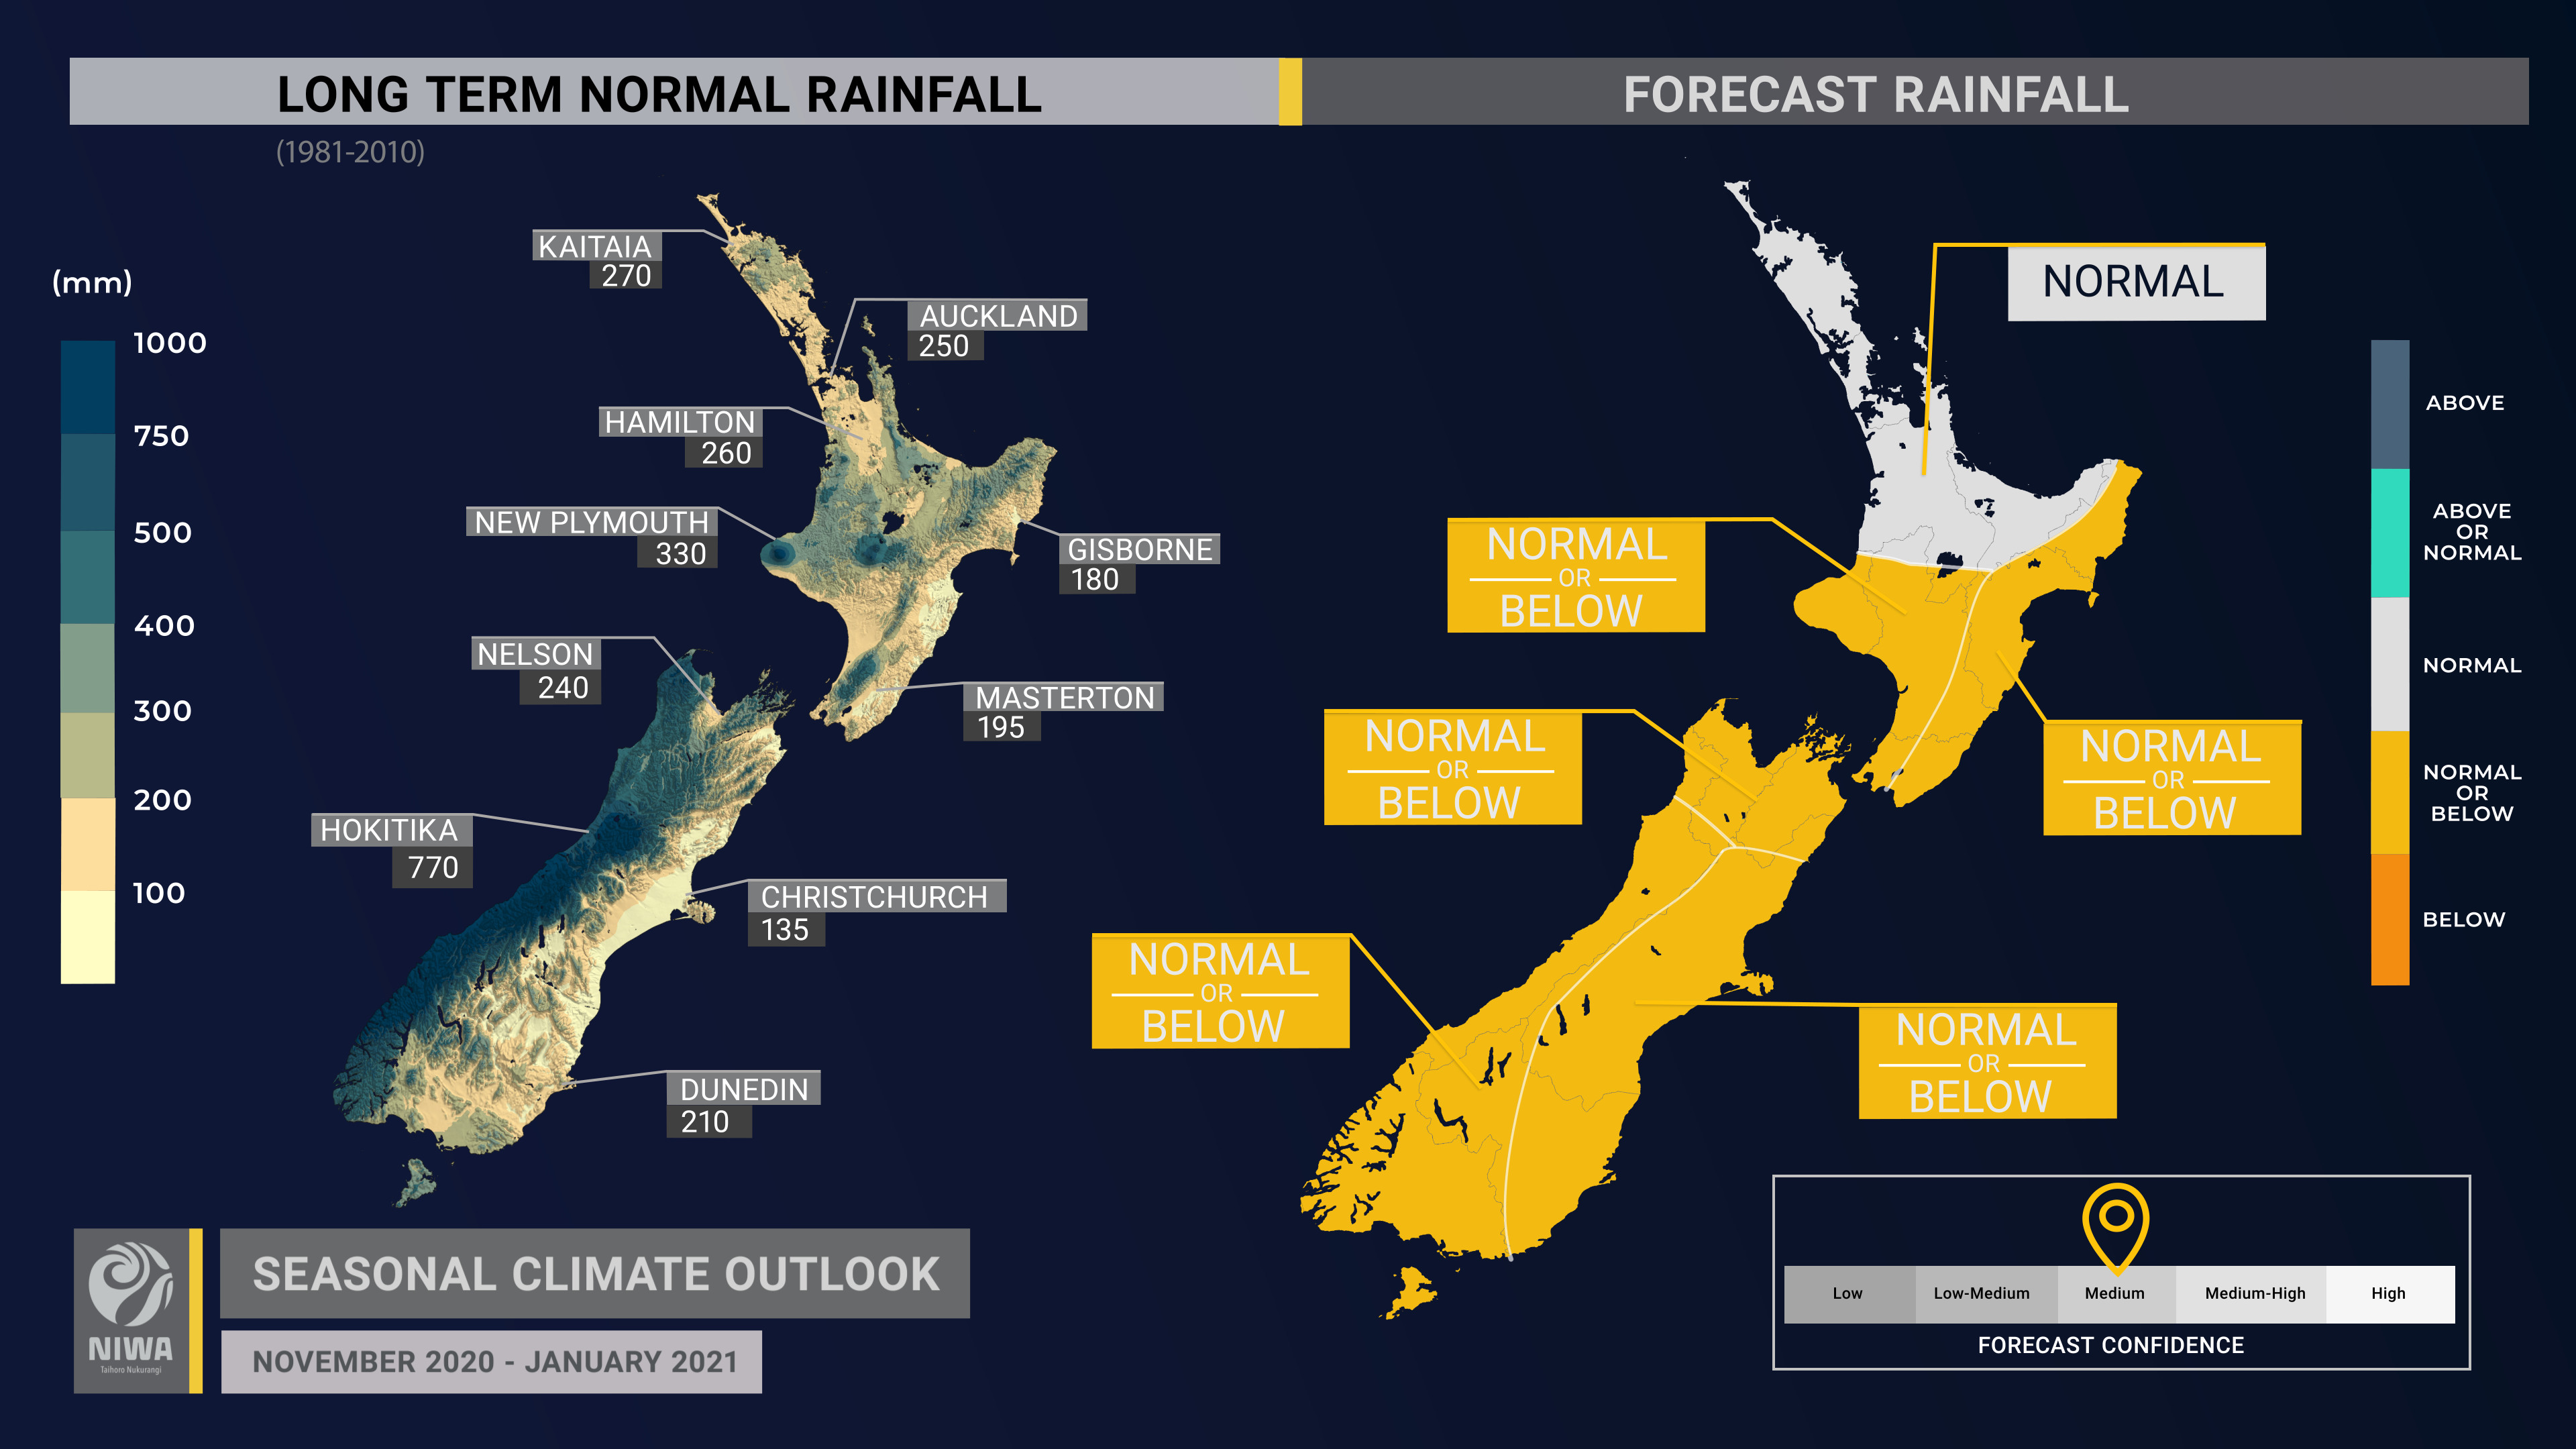
- Rainfall is most likely to be near normal in the north of the North Island and about equally likely to be near normal or below normal for all remaining regions. November could exhibit continued dryness for large parts of the country whereas the chance for sub-tropical or tropical disturbances will increase during December-January, consistent with recent La Niña events.
- For the tropical cyclone season (November 2020-April 2021), NIWA’s Southwest Pacific Tropical Cyclone Outlook indicates that the risk for New Zealand is elevated. On average, one ex-tropical cyclone passes near the country each year. Significant rainfall, damaging winds, and coastal inundation can occur during these events.
- Soil moisture levels and river flows are most likely to be below normal in the north of the North Island and the east of the South Island. Soil moisture levels and river flows are about equally likely to be near normal or below normal in the west and east of the North Island and north of the South Island and about equally likely to be near normal or above normal in the west of the South Island.
Regional predictions for November 2020 – January 2021
Northland, Auckland, Waikato, Bay of Plenty
The table below shows the probabilities (or percent chances) for each of three categories: above average, near average, and below average. In the absence of any forecast guidance there would be an equal likelihood (33% chance) of the outcome being in any one of the three categories. Forecast information from local and global guidance models is used to indicate the deviation from equal chance expected for the coming three-month period, with the following outcomes the most likely (but not certain) for this region:
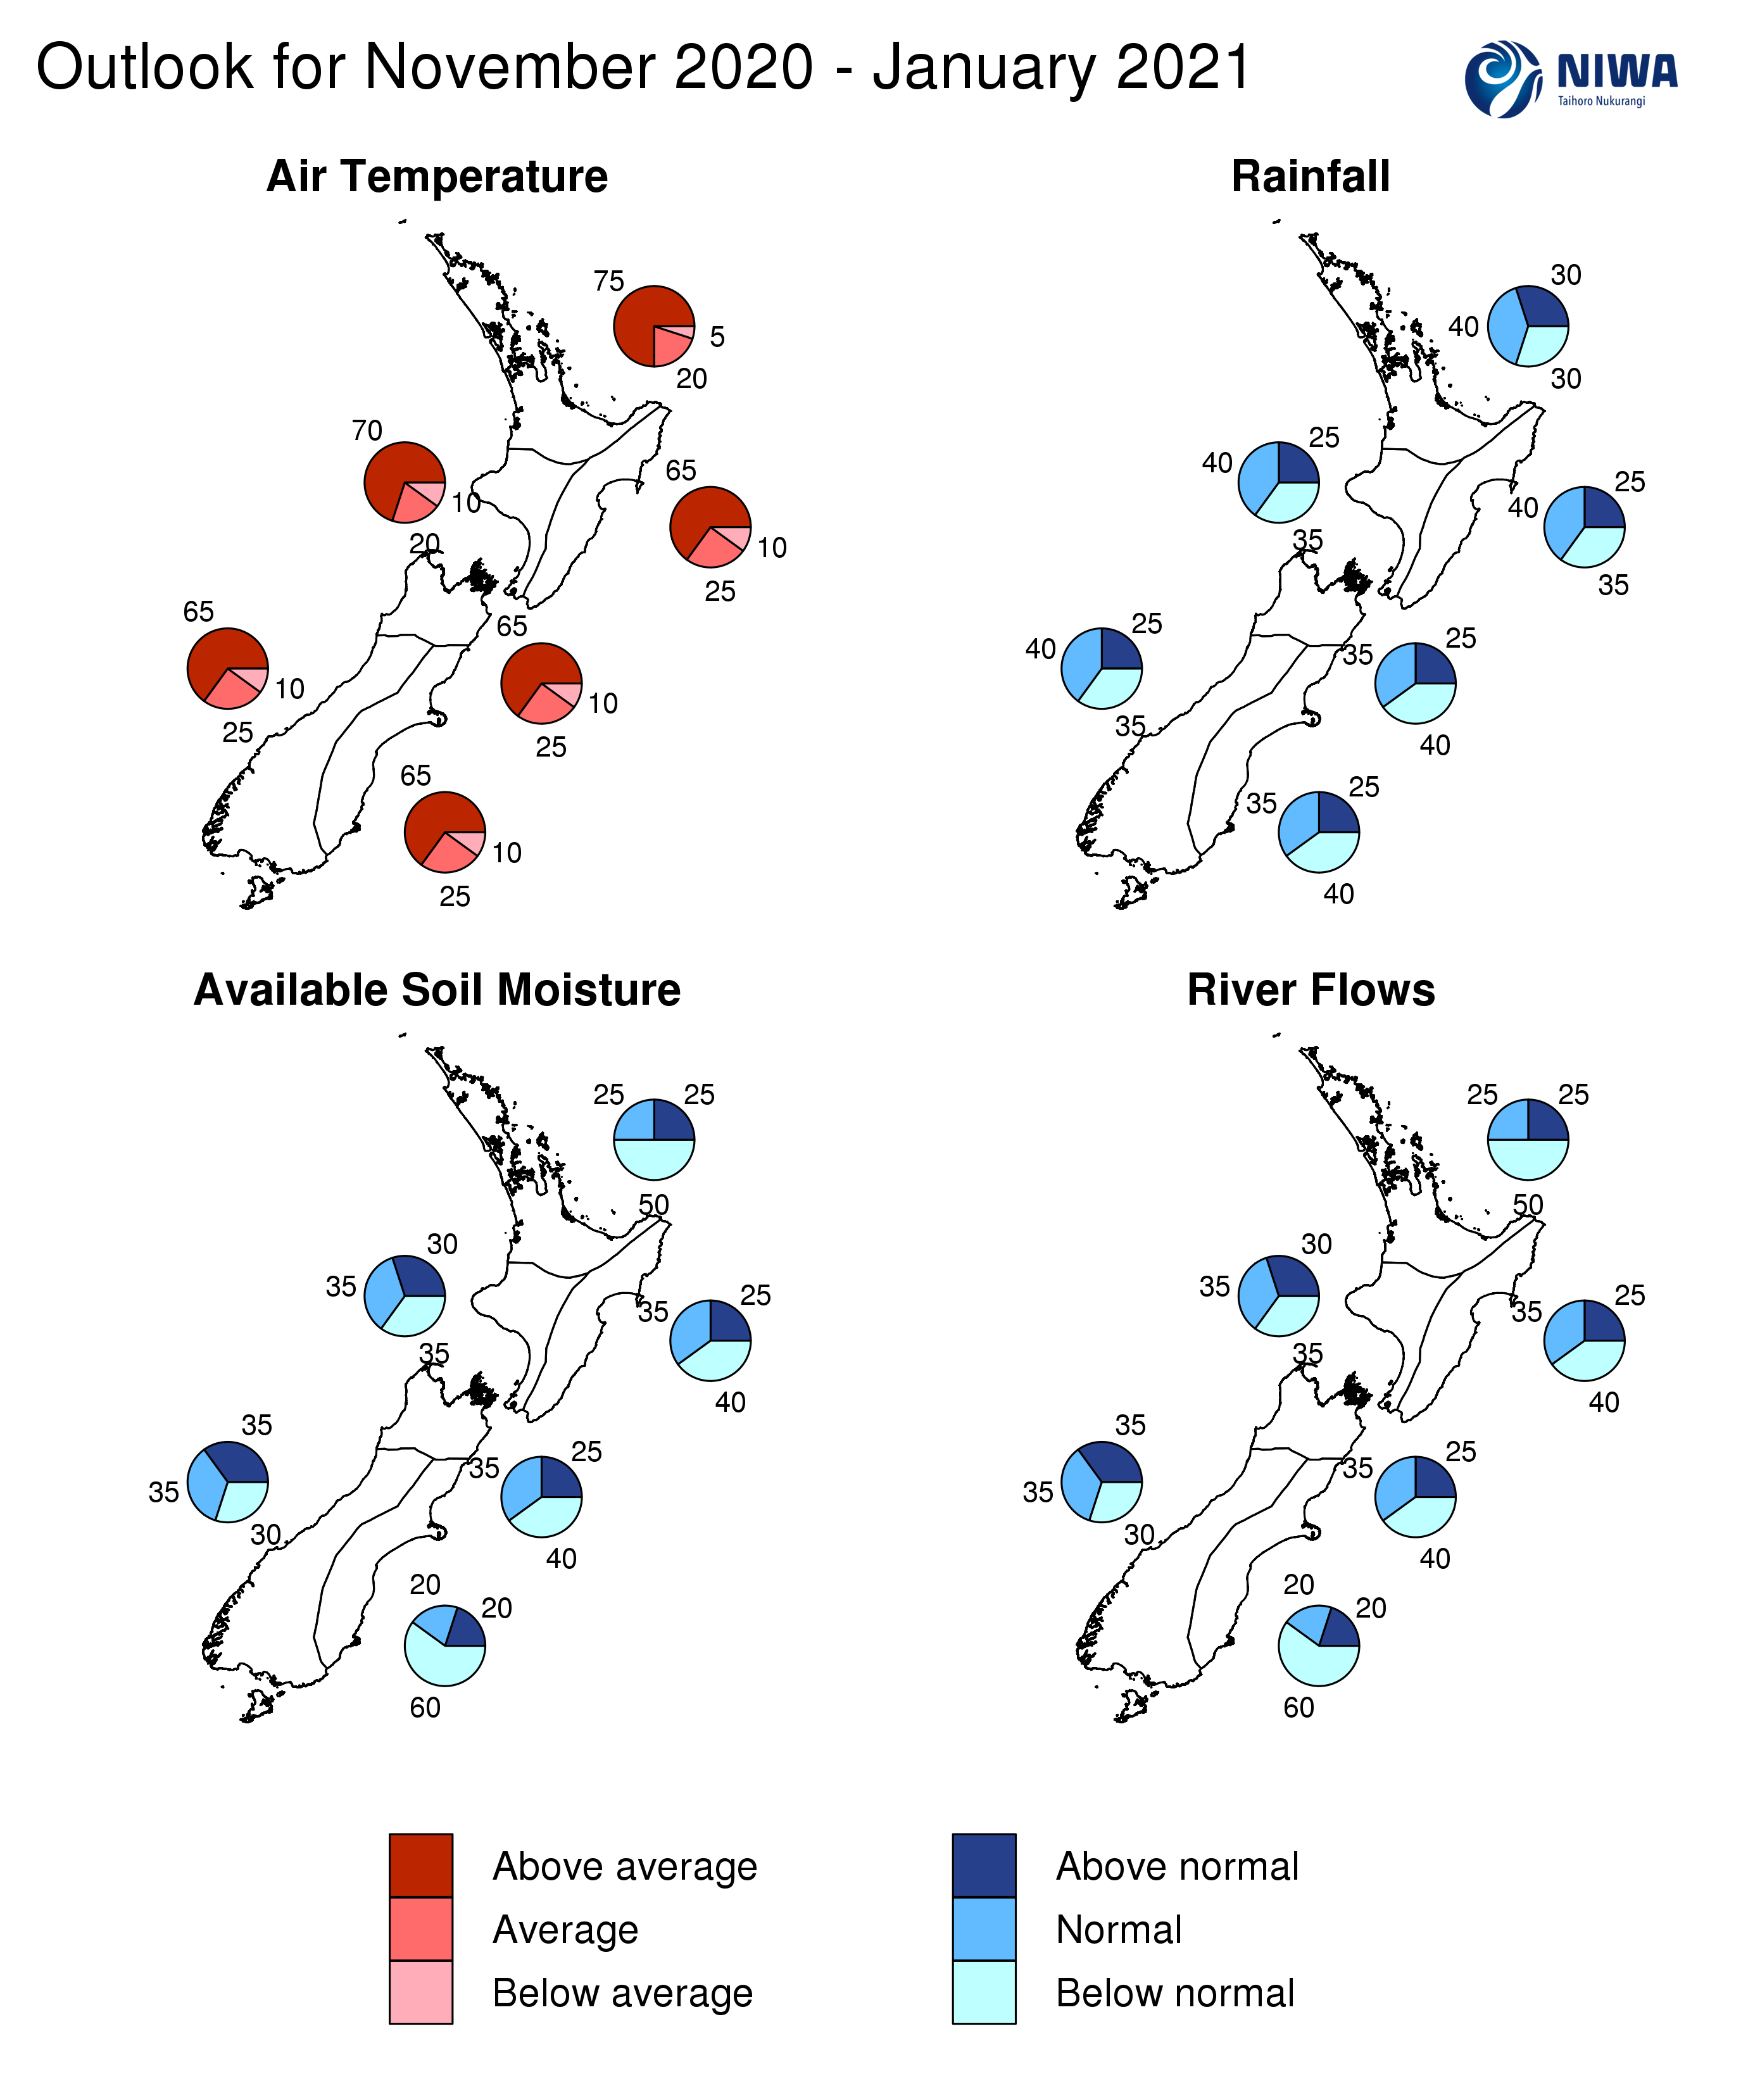
- Temperatures are very likely to be above average (75% chance).
- Rainfall totals are most likely to be near normal (40% chance).
- Soil moisture levels and river flows are likely to be below normal (50% chance).
The full probability breakdown is:
|
Temperature |
Rainfall |
Soil moisture |
River flows |
|
|
Above average |
75 |
30 |
25 |
25 |
|
Near average |
20 |
40 |
25 |
25 |
|
Below average |
05 |
30 |
50 |
50 |
Central North Island, Taranaki, Whanganui, Manawatu, Wellington
Probabilities are assigned in three categories: above average, near average, and below average.
- Temperatures are very likely to be above average (70% chance).
- Rainfall totals are about equally likely to be near normal (40% chance) or below normal (35% chance).
- Soil moisture levels and river flows are most likely to be near their climatological value.
The full probability breakdown is:
|
Temperature |
Rainfall |
Soil moisture |
River flows |
|
|
Above average |
70 |
25 |
30 |
30 |
|
Near average |
20 |
40 |
35 |
35 |
|
Below average |
10 |
35 |
35 |
35 |
Gisborne, Hawke’s Bay, Wairarapa
Probabilities are assigned in three categories: above average, near average, and below average.
- Temperatures are very likely to be above average (65% chance).
- Rainfall totals are about equally likely to be near normal (40% chance) or below normal (35% chance).
- Soil moisture levels and river flows are about equally likely to be below normal (40% chance) or near normal (35% chance).
The full probability breakdown is:
|
Temperature |
Rainfall |
Soil moisture |
River flows |
|
|
Above average |
65 |
25 |
25 |
25 |
|
Near average |
25 |
40 |
35 |
35 |
|
Below average |
10 |
35 |
40 |
40 |
Tasman, Nelson, Marlborough, Buller
Probabilities are assigned in three categories: above average, near average, and below average.
- Temperatures are very likely to be above average (65% chance).
- Rainfall totals are about equally likely to be below normal (40% chance) or near normal (35% chance).
- Soil moisture levels and river flows are about equally likely to be below normal (40% chance) or near normal (35% chance).
The full probability breakdown is:
|
Temperature |
Rainfall |
Soil moisture |
River flows |
|
|
Above average |
65 |
25 |
25 |
25 |
|
Near average |
25 |
35 |
35 |
35 |
|
Below average |
10 |
40 |
40 |
40 |
West Coast, Alps and foothills, inland Otago, Southland
Probabilities are assigned in three categories: above average, near average, and below average.
- Temperatures are very likely to be above average (65% chance).
- Rainfall totals are about equally likely to be near normal (40% chance) or below normal (35% chance).
- Soil moisture levels and river flows are most likely to be near their climatological value.
The full probability breakdown is:
|
Temperature |
Rainfall |
Soil moisture |
River flows |
|
|
Above average |
65 |
25 |
35 |
35 |
|
Near average |
25 |
40 |
35 |
35 |
|
Below average |
10 |
35 |
30 |
30 |
Coastal Canterbury, east Otago
Probabilities are assigned in three categories: above average, near average, and below average.
- Temperatures are very likely to be above average (65% chance).
- Rainfall totals are about equally likely to be below normal (40% chance) or near normal (35% chance).
- Soil moisture levels and river flows are very likely to be below normal (60% chance).
The full probability breakdown is:
|
Temperature |
Rainfall |
Soil moisture |
River flows |
|
|
Above average |
65 |
25 |
20 |
20 |
|
Near average |
25 |
35 |
20 |
20 |
|
Below average |
10 |
40 |
60 |
60 |
Graphical representation of the regional probabilities
Background
The NINO3.4 Index anomaly (in the central Pacific) for October (through the 25th) was -0.86˚C, decreasing from -0.71˚C last month. The SOI (Southern Oscillation Index) value for October (through the 26th) was +0.4 (on the La Niña side of neutral).
As of late October 2020, a majority of NIWA’s La Niña criteria have been met: equatorial SSTs of at least 0.7˚C below average (now for two consecutive months), enhanced equatorial trade winds, a coupling of the ocean-atmosphere system, New Zealand’s patterns becoming more aligned with La Niña, and forecast guidance indicating a continuation of these conditions.
La Niña has had a clear imprint on the upper-oceanic heat content pattern, with lower than normal temperatures in the east-central Pacific and continued above average warmth in the western Pacific.
Subsurface ocean temperatures remained cooler than average in the central and eastern Pacific during October, suggesting that the La Niña event has yet to reach its peak; this is expected to occur in December or January.
Trade winds continued to be stronger than normal across the equatorial Pacific during October, which contributed to upwelling (the process by which cooler seas beneath the surface are churned up). Another surge of trade winds is expected from mid-November.
According to the consensus from international models, the probability for La Niña conditions is 96% for November 2020 – January 2021. For February – April 2021, the probability for La Niña is 59% and 40% for ENSO-neutral conditions.
New Zealand’s coastal SSTs warmed considerably around the North Island over the past month. The northern Tasman Sea also observed significant increases, with monthly anomalies of up to 2.0˚C. La Niña is typically associated with unusually warm Tasman Sea temperatures during late spring and summer. If current ocean and atmosphere trends continue, marine heatwave conditions will be possible in November and/or December. Abnormally warm ocean temperatures can have a profound impact on air temperatures over land and provide fuel to cyclones approaching from the north. The marine and fisheries sectors should keep an eye on this evolving situation, as it could be similar to what occurred in late 2017-early 2018.
New Zealand Coastal Sea Surface Temperatures during October 2020 (to the 27th):
|
North NI |
+1.03˚C |
|
West NI |
+0.80˚C |
|
East NI |
+0.82˚C |
|
North SI |
+0.70˚C |
|
West SI |
+0.48˚C |
|
East SI |
+0.69˚C |
|
Southern Annular Mode (SAM)
The Southern Annular Mode (SAM) became positive during early October and remained that way for much of the month. Research has shown that a positive SAM is weakly correlated with La Niña. Higher than normal air pressure is likely to continue in the New Zealand region through November, supportive of a continuation of a positive SAM.
The Madden-Julian Oscillation (MJO) was active over the Maritime Continent (Indonesia) and the western Pacific during October, superimposed on the La Niña base state (sinking air over the east-central Pacific and rising air over the western Pacific and Maritime Continent).
During November, the convectively active phase of the MJO is expected to be over the Pacific to start the month before moving into the Western Hemisphere, Africa, and the Indian Ocean.
The expected activity over Africa and the Indian Ocean is atypical of La Niña and may continue at times over the upcoming three month period. This could support impacts in New Zealand that are a bit unusual for La Niña. Air flows may periodically favour a northwesterly direction instead of a more typical (for La Niña) northeasterly direction, which could influence rainfall distribution.
During recent historical La Niña events, November has been drier than normal for many parts of the country aside from the far northern North Island. December and January have exhibited a progression toward more wet weather, particularly in the North Island.
Forecast Confidence
Temperature
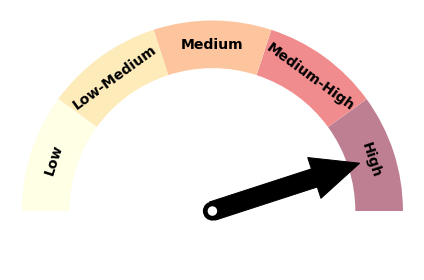
|
Forecast confidence for temperatures is high. Warmer than local sea temperatures, sub-tropical winds, the persistence of high pressure, and strong climate model agreement support this outlook. |
Rainfall
|
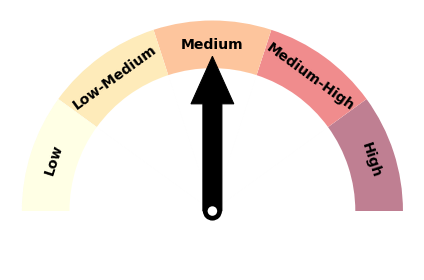
|
Some non-traditional impacts of La Niña through spring put a cap on rainfall confidence. The models have generally been too wet and the persistence of high pressure weigh into an outlook that leans drier. |
