Outlook Summary
- ENSO neutral conditions continued during October 2019, although the Southern Oscillation Index (SOI) and sea surface temperatures (SSTs) were on the El Niño side of neutral.
- The SOI was -0.5 and SSTs in the central Pacific were warmer than average during October.
- Oceanic ENSO neutral will most likely continue (70% chance) over the next three months, although the atmosphere may have an El Niño-like response at times.
- During October, New Zealand’s coastal sea temperatures were near average.
- A near-record positive Indian Ocean Dipole event is expected to influence New Zealand’s climate over the next three months. More details in the Background section.
- For November to January, air pressure is forecast to be lower than normal to the southwest of New Zealand and higher than normal to the north. This is expected to be associated with a westerly quarter air flow anomaly.
- Heavy rainfall events are possible in the South Island and western North Island during November, which may elevate the risk for flooding.
- Below average seasonal temperatures are unlikely, with all regions expected to have near average or above average temperatures.
- For the current tropical cyclone season (November 2019 to April 2020), NIWA’s Southwest Pacific Tropical Cyclone Outlook indicates that the risk for New Zealand is near normal. On average, one ex-tropical cyclone passes near the country each year. Significant rainfall, damaging winds, and coastal damage can occur during these events.
NIWA's Chris Brandolino and Ben Noll talk about the end of spring and start to summer:
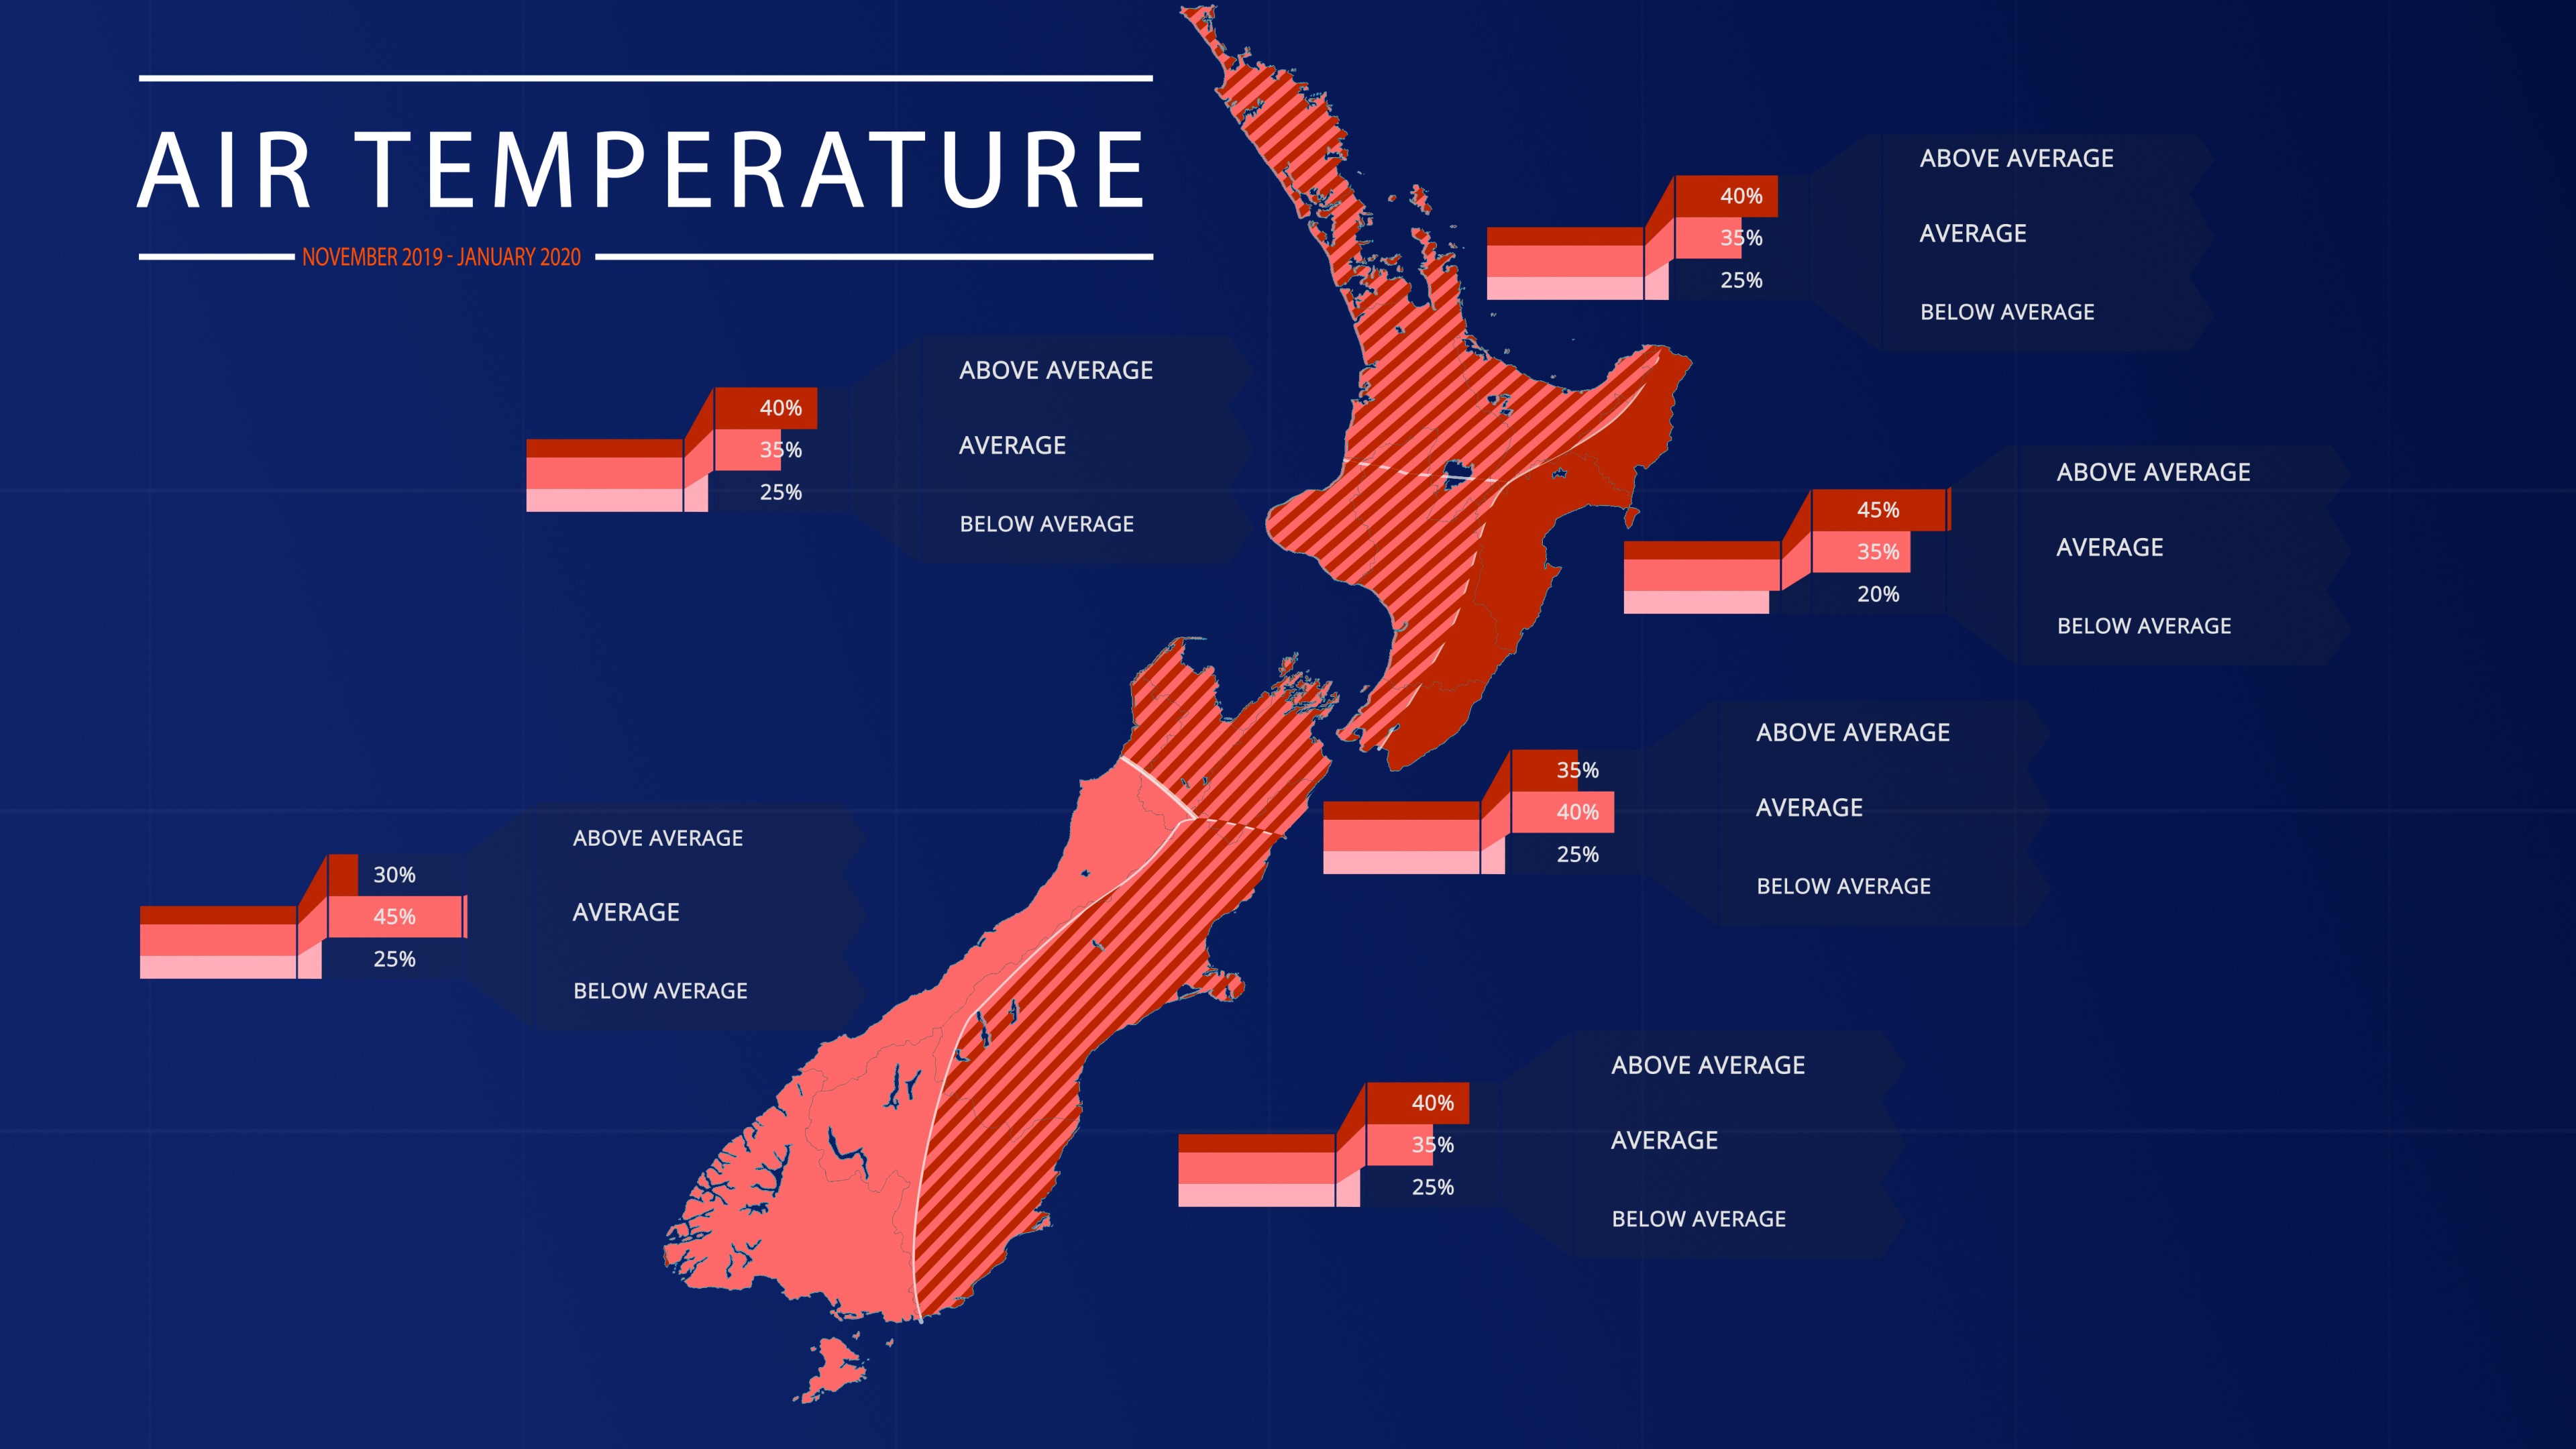
November 2019 – January 2020 temperatures have about equal chances of being near average (35-40% chance) or above average (35-40% chance) for much of New Zealand, except the east of the North Island where above average temperatures are most likely (45% chance) and the west of the South Island where near average temperatures are most likely (45% chance). Increased westerly air flows during the season are likely to transport warm, dry air from Australia, which is experiencing drought conditions. This may contribute to warming SSTs in the Tasman Sea and New Zealand coastal waters during November, which may influence air temperatures during the upcoming three-month period.
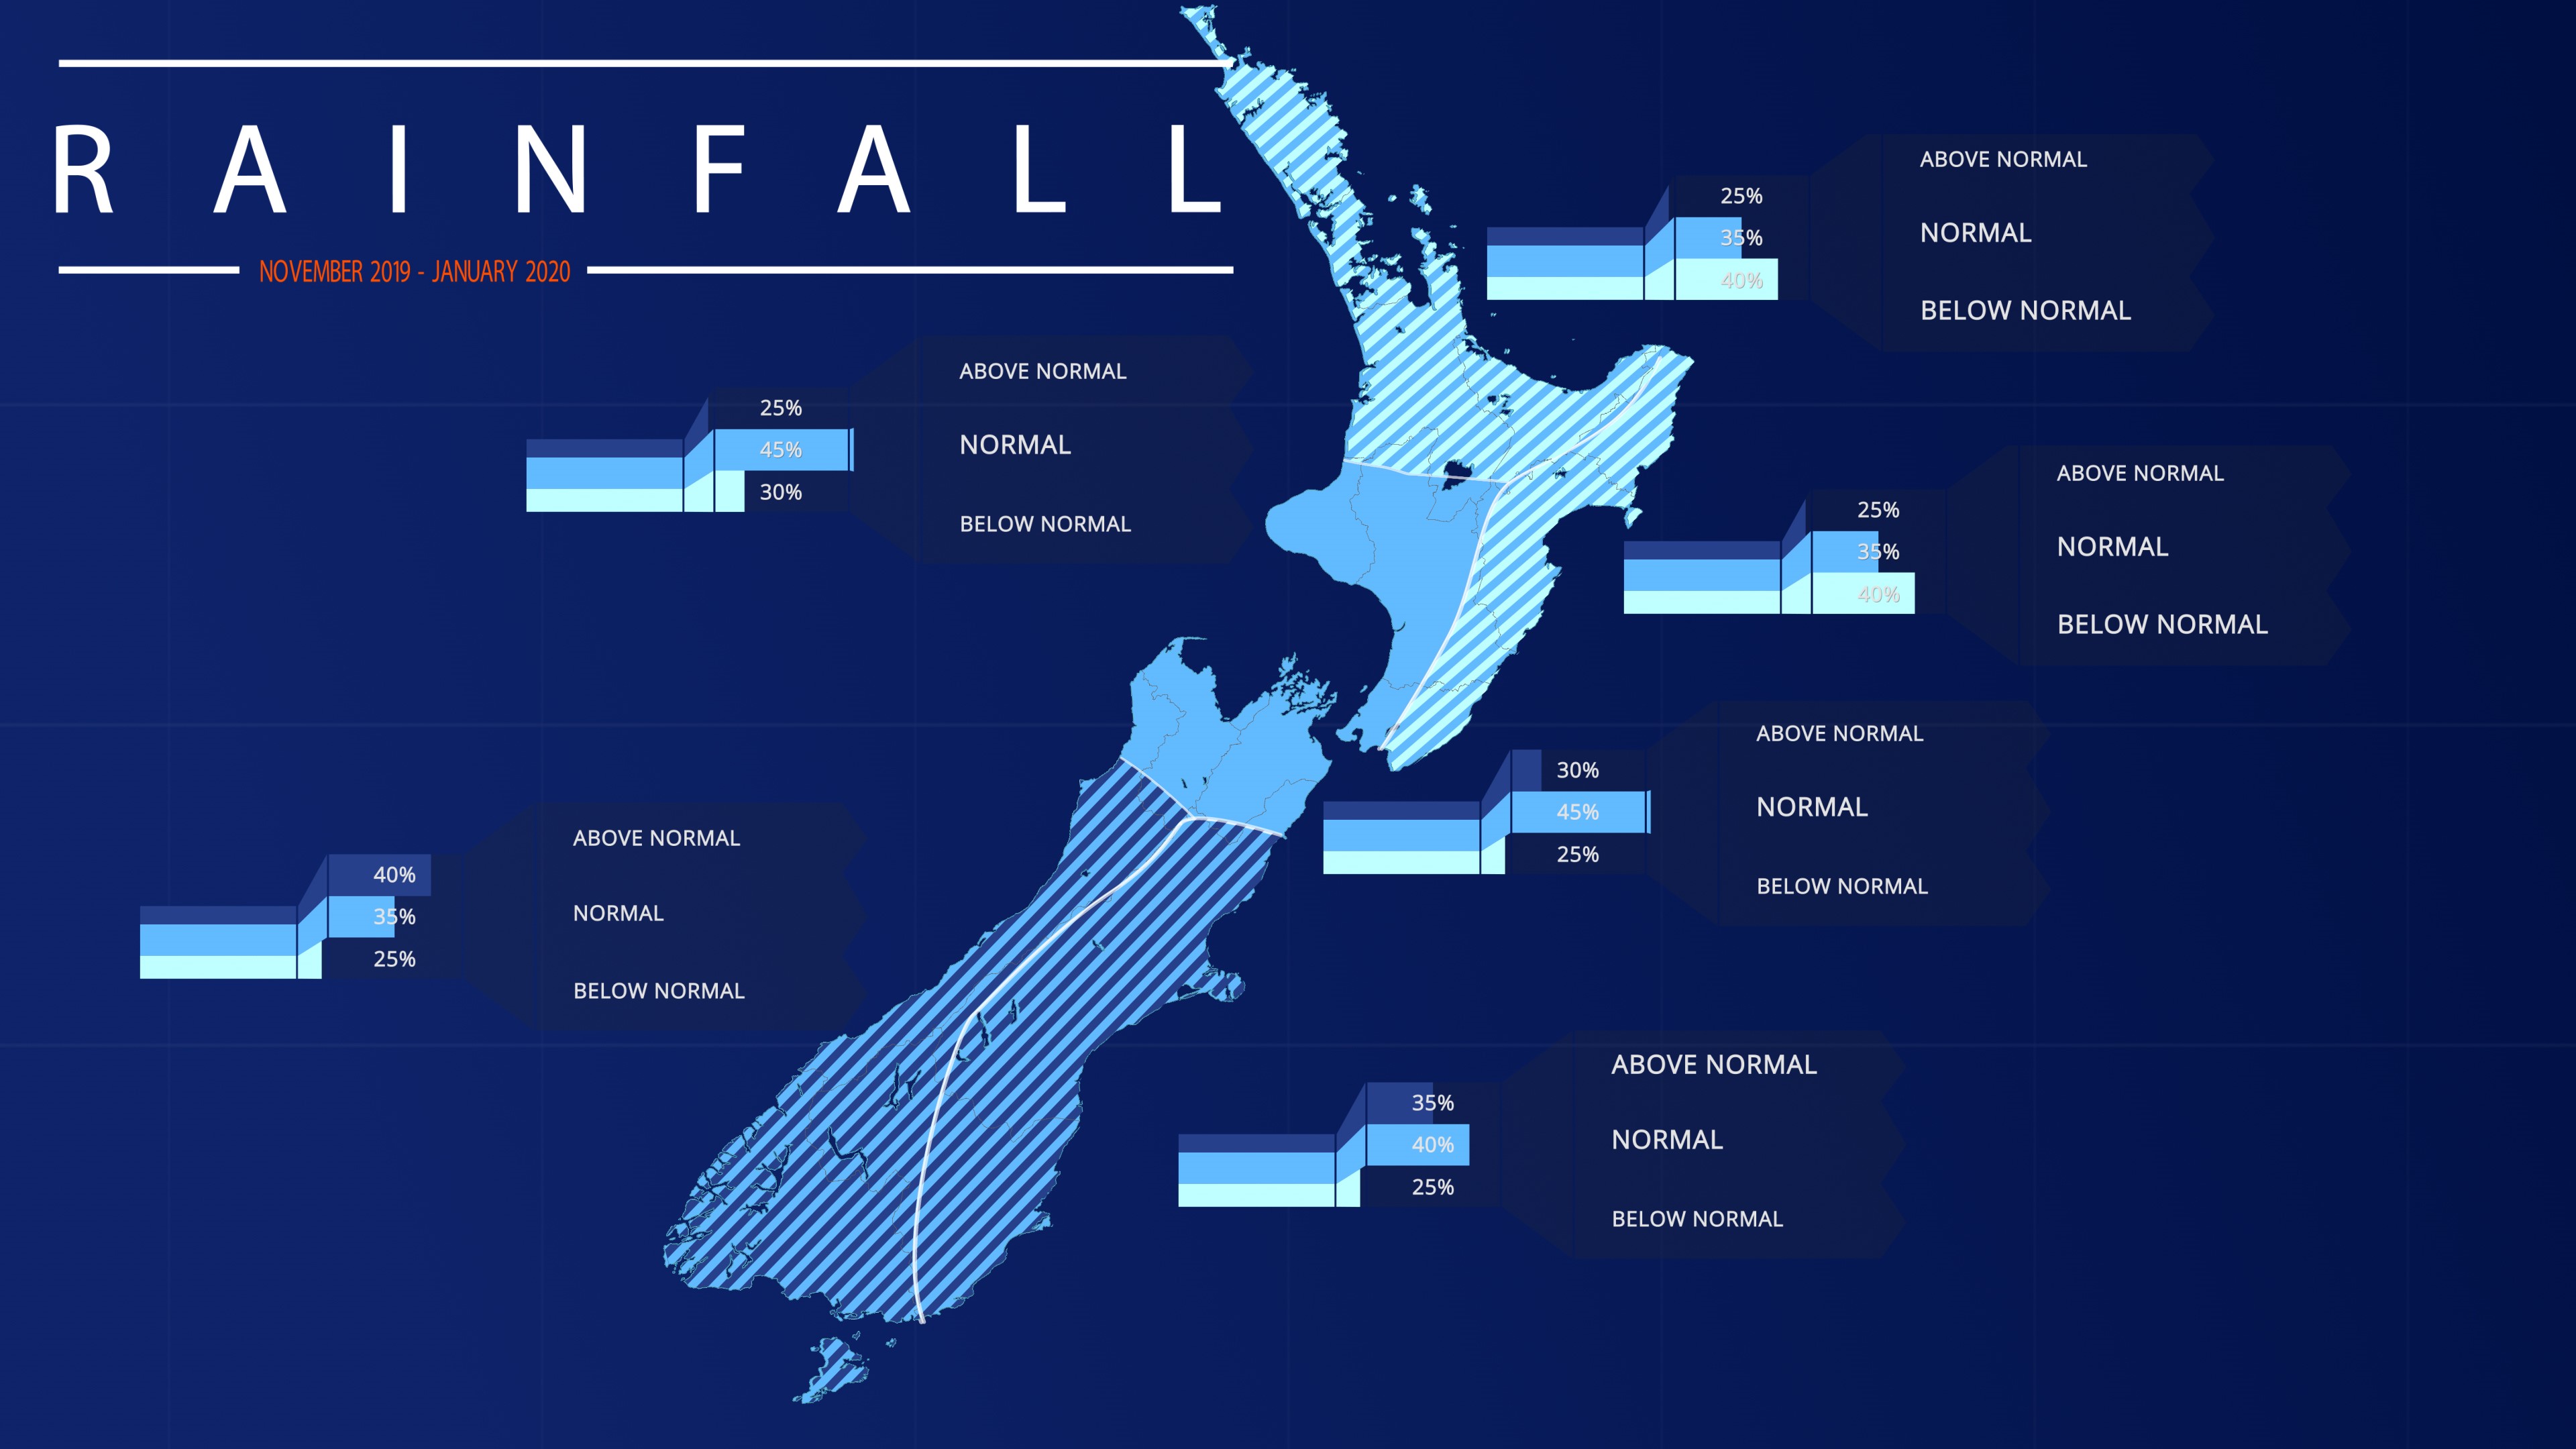
November 2019 – January 2020 rainfall is about equally likely to be near normal (35% chance) or below normal (40% chance) for the north and east of the North Island, near normal (35-40% chance) or above normal (35-40% chance) in the west and east of the South Island, and most likely to be near normal in the remaining regions of New Zealand (45% chance). Heavy rain events in the South Island and western North Island during the first half of the upcoming three-month period. There may be a higher than normal risk for flooding events.
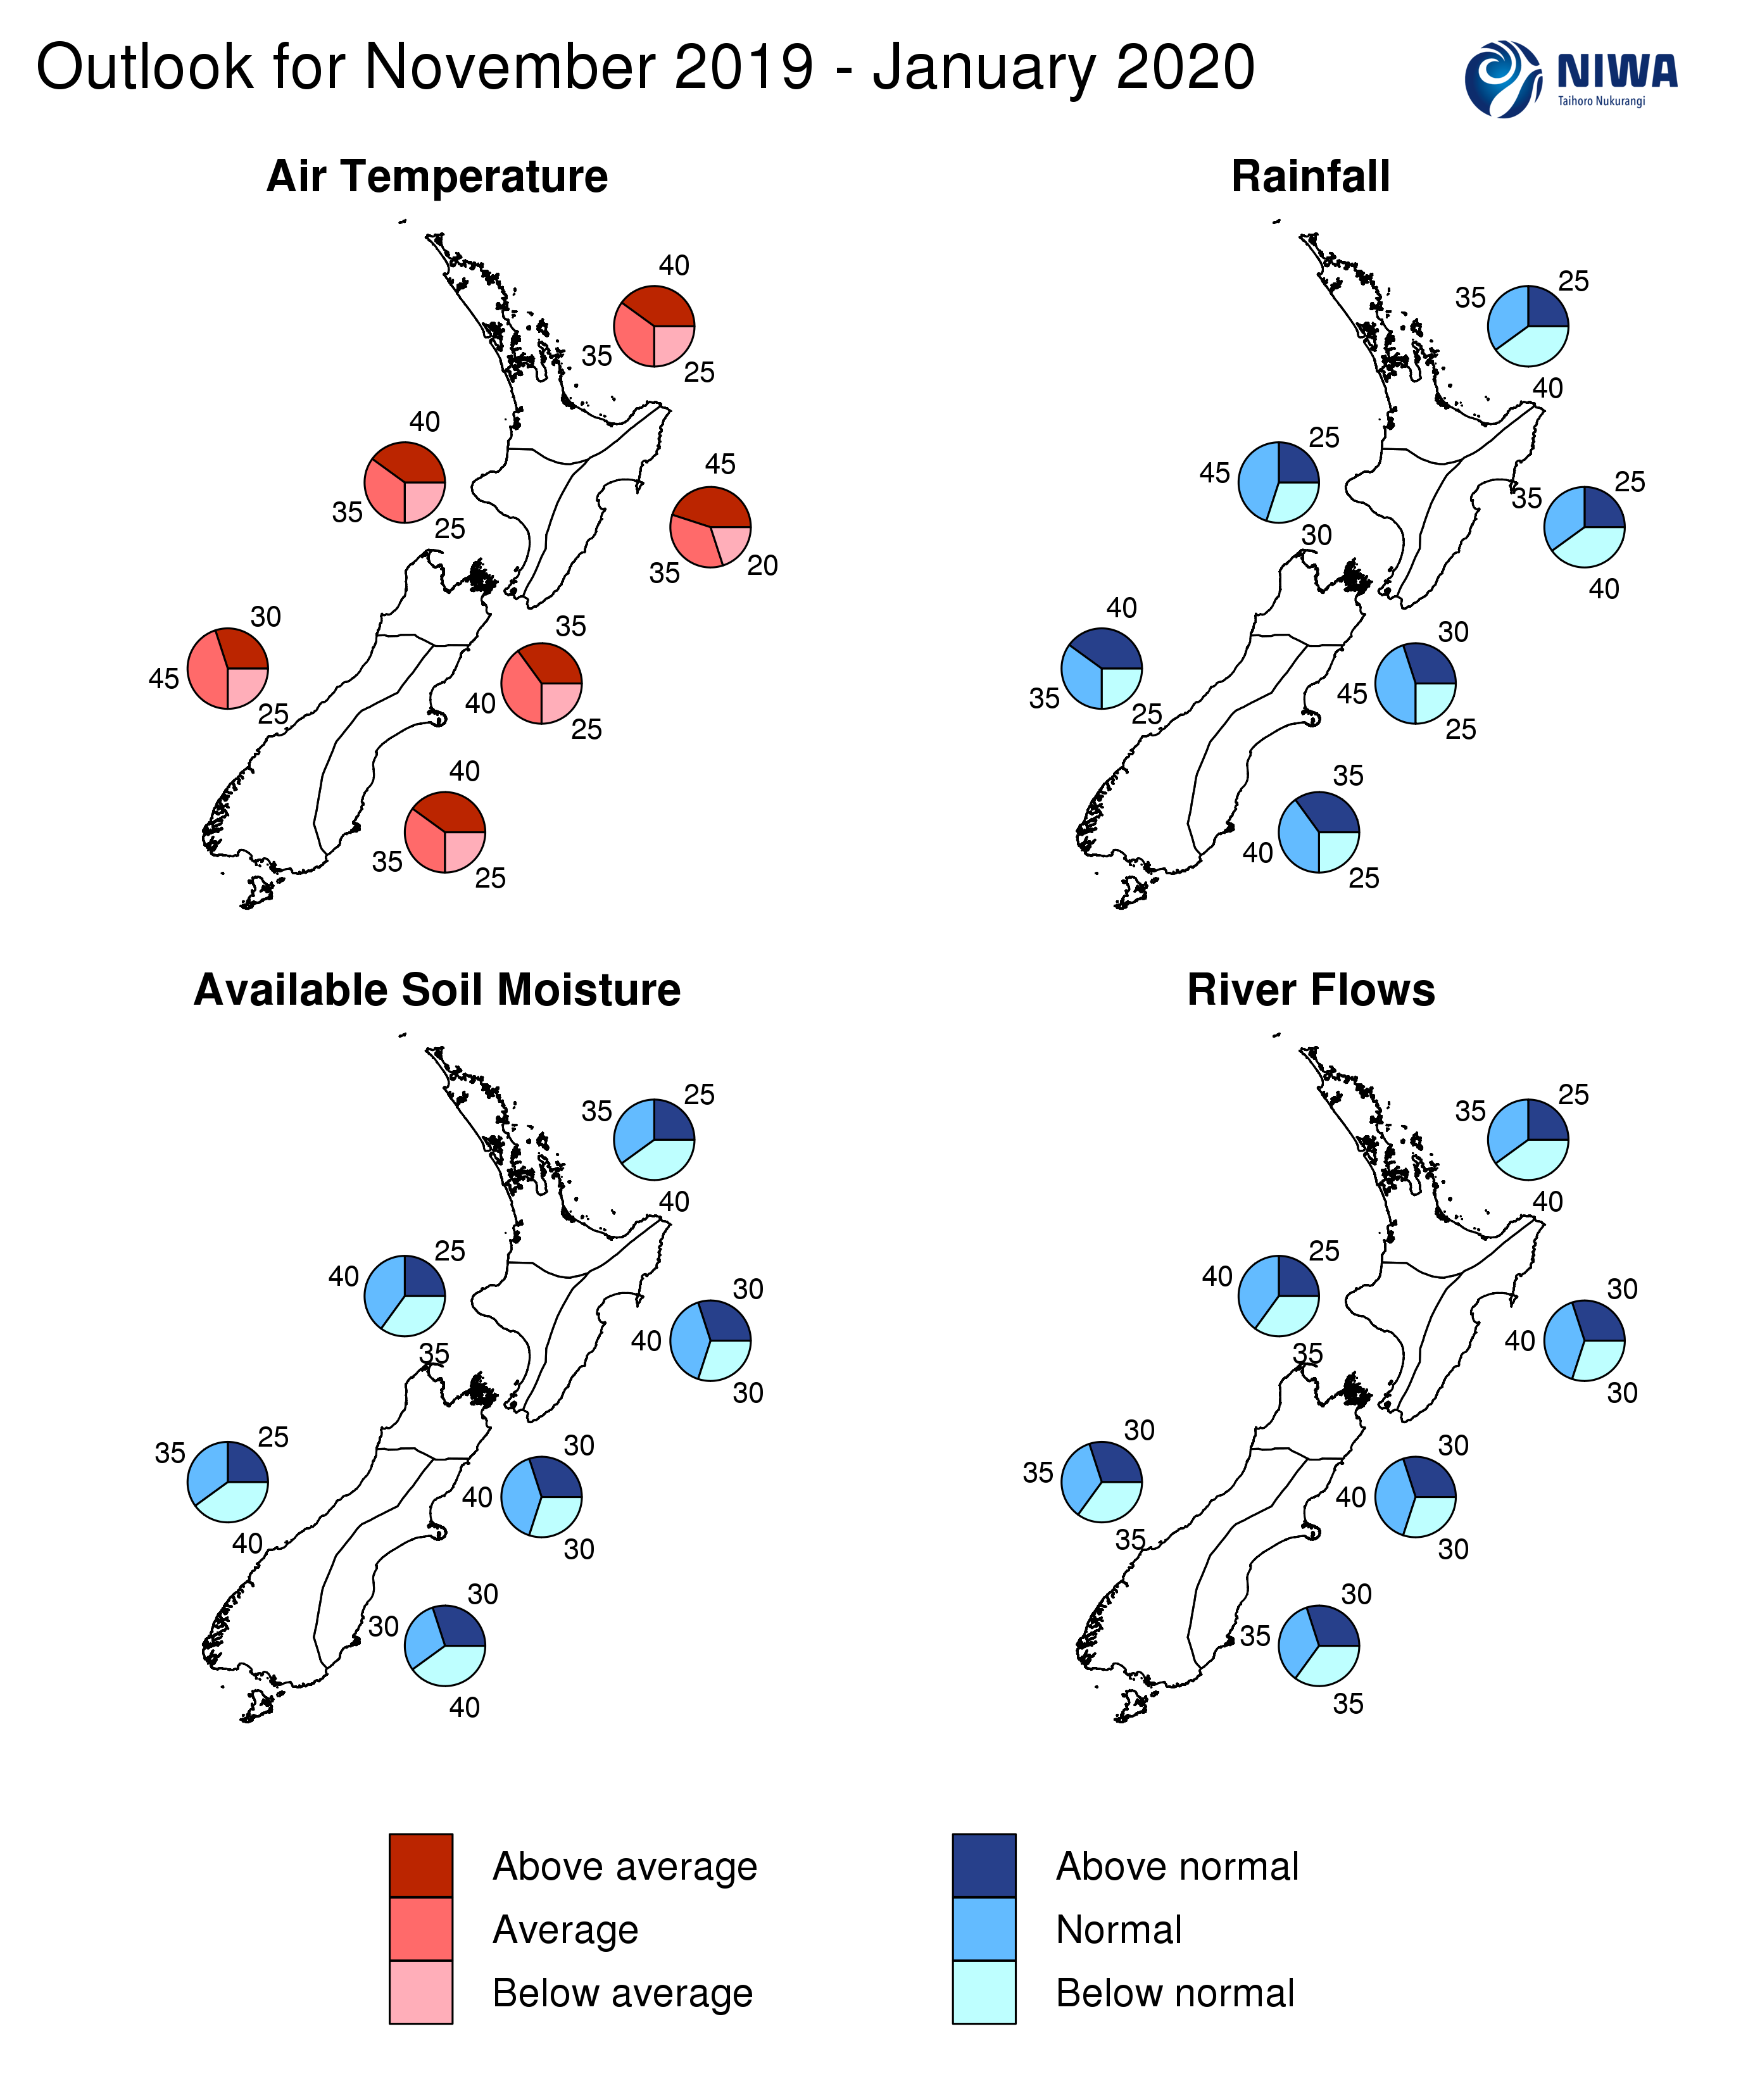
November 2019 – January 2020 soil moisture levels and river flows are most likely to be near normal (35-40% chance) or below normal (35-40% chance) in the north and west of the North Island and west of the South Island. In the east of the South Island, below normal soil moisture levels are most likely (40% chance) while river flows are equally likely to be normal (35% chance) or below normal (35% chance). Near normal soil moisture levels and river flows are most likely for the remaining regions of New Zealand.
Regional predictions for the November 2019 – January 2020 season
Northland, Auckland, Waikato, Bay of Plenty
The table below shows the probabilities (or percent chances) for each of three categories: above average, near average, and below average. In the absence of any forecast guidance there would be an equal likelihood (33% chance) of the outcome being in any one of the three categories. Forecast information from local and global guidance models is used to indicate the deviation from equal chance expected for the coming three-month period, with the following outcomes the most likely (but not certain) for this region:
- Temperatures are about equally likely to be near average (35% chance) or above average (40% chance).
- Rainfall totals are about equally likely to be near normal (35% chance) or below normal (40% chance).
- Soil moisture levels and river flows are about equally likely to be below normal (40% chance) or near normal (35% chance).
The full probability breakdown is:
|
Temperature |
Rainfall |
Soil moisture |
River flows |
|
|
Above average |
40 |
25 |
25 |
25 |
|
Near average |
35 |
35 |
35 |
35 |
|
Below average |
25 |
40 |
40 |
40 |
Central North Island, Taranaki, Whanganui, Manawatu, Wellington
Probabilities are assigned in three categories: above average, near average, and below average.
- Temperatures are about equally likely to be near average (35% chance) or above average (40% chance).
- Rainfall totals are most likely to be in the near normal range (45% chance).
- Soil moisture levels and river flows are about equally likely to be near normal (40% chance) or below normal (35% chance).
The full probability breakdown is:
|
Temperature |
Rainfall |
Soil moisture |
River flows |
|
|
Above average |
40 |
25 |
25 |
25 |
|
Near average |
35 |
45 |
40 |
40 |
|
Below average |
25 |
30 |
35 |
35 |
Gisborne, Hawke’s Bay, Wairarapa
Probabilities are assigned in three categories: above average, near average, and below average.
- Temperatures are most likely to be above average (45% chance).
- Rainfall totals are about equally likely to be near normal (35% chance) or below normal (40% chance).
- Soil moisture levels and river flows are most likely to be near normal (40% chance).
The full probability breakdown is:
|
Temperature |
Rainfall |
Soil moisture |
River flows |
|
|
Above average |
45 |
25 |
30 |
30 |
|
Near average |
35 |
35 |
40 |
40 |
|
Below average |
20 |
40 |
30 |
30 |
Tasman, Nelson, Marlborough, Buller
Probabilities are assigned in three categories: above average, near average, and below average.
- Temperatures are about equally likely to be near average (40% chance) or above average (35% chance).
- Rainfall totals are most likely to be in the near normal range (45% chance).
- Soil moisture levels and river flows are most likely to be near normal (40% chance).
The full probability breakdown is:
|
Temperature |
Rainfall |
Soil moisture |
River flows |
|
|
Above average |
35 |
30 |
30 |
30 |
|
Near average |
40 |
45 |
40 |
40 |
|
Below average |
25 |
25 |
30 |
30 |
West Coast, Alps and foothills, inland Otago, Southland
Probabilities are assigned in three categories: above average, near average, and below average.
- Temperatures are most likely to be near average (45% chance).
- Rainfall totals are about equally likely to be near normal (35% chance) or above normal (40% chance).
- Soil moisture levels and river flows are equally likely to be near normal (35-40% chance) or below normal (35-40% chance).
The full probability breakdown is:
|
Temperature |
Rainfall |
Soil moisture |
River flows |
|
|
Above average |
30 |
40 |
25 |
30 |
|
Near average |
45 |
35 |
35 |
35 |
|
Below average |
25 |
25 |
40 |
35 |
Coastal Canterbury, east Otago
Probabilities are assigned in three categories: above average, near average, and below average.
- Temperatures are about equally likely to be near average (35% chance) or above average (40% chance).
- Rainfall totals are about equally likely to be near normal (40% chance) or above normal (35% chance).
- Soil moisture levels are most likely to be below normal (40% chance).
- River flows are equally likely to be near normal (35% chance) or below normal (35% chance).
The full probability breakdown is:
|
Temperature |
Rainfall |
Soil moisture |
River flows |
|
|
Above average |
40 |
35 |
30 |
30 |
|
Near average |
35 |
40 |
30 |
35 |
|
Below average |
25 |
25 |
40 |
35 |
Graphical representation of the regional probabilities
Background
The NINO3.4 Index (in the central Pacific) for the month of October (to the 27th) was +0.54˚C, a substantial increase compared to September. Above average warmth continued in the NINO4 region (west-central Pacific) with a monthly anomaly of +0.95˚C. The NINO 1+2 Index was cooler than average, with a monthly anomaly of -0.48˚C.
Upper-oceanic heat content anomalies increased across the tropical Pacific during October, in response to weaker than normal winds throughout the month as well as a strongly positive Pacific Meridional Mode (well above average SSTs in the sub-tropical northeast Pacific).
While the ENSO status will most likely remain “neutral” over the next season, the atmosphere may respond in an El Niño Modoki-like (i.e. central Pacific) fashion at times.
Across the global tropics, rainfall was well below normal about the eastern Indian Ocean, Indonesia, and Australia. This was consistent with a near-record positive Indian Ocean Dipole (IOD) pattern, where sea-surface temperatures are above average in the western Indian Ocean and correspondingly below average in the east near Sumatra (hence the term “dipole”). A positive IOD is associated with drought in Indonesia and southeast Australia. In the tropical Pacific, rainfall was above normal west of the International Dateline, broadly reflective of central Pacific El Niño-like conditions.
When the IOD (in the ocean) couples, or communicates with, the atmosphere, it can have flow-on impacts for areas outside the tropics, including New Zealand. During November, impacts from the IOD are expected in New Zealand. A transition to wetter than normal conditions is forecast, especially in the west of both islands. There may be an increased risk for heavy rainfall and the potential for flooding.
According to the consensus from international models, oceanic ENSO-neutral conditions are most likely at 68% chance for the November – January period. For the February – April 2020 period, the probability for neutral conditions is 71%. For May – July 2020, the probability for neutral conditions and El Niño is 57% and 33%, respectively.
New Zealand’s coastal water temperatures warmed slightly during October. SSTs are above average in the western Tasman Sea. A warm start to November could result in warming SSTs in the Tasman Sea and to the north of New Zealand. Above average seasonal SSTs are possible in parts of the New Zealand region.
New Zealand Coastal Sea Surface Temperatures during October 2019
|
North NI |
West NI |
East NI |
North SI |
West SI |
East SI |
|
0.07˚C |
0.08˚C |
-0.07˚C |
0.03˚C |
-0.03˚C |
0.33˚C |
The Southern Annular Mode (SAM) was variable through the first half of October, before turning sharply negative late. The SAM is forecast to be strongly negative during the first half of November, which, after the first week, is expected to be associated with an active Tasman Sea and the potential for heavy rainfall events (especially in western parts of the country).
The Madden-Julian Oscillation (MJO) was convectively active in phases 8, 1, and 2 during October. This will most likely continue during November. These phases are all associated with above normal rainfall in western New Zealand, particularly in the South Island. These phases are also associated with warmer than average temperatures in eastern parts of the country.
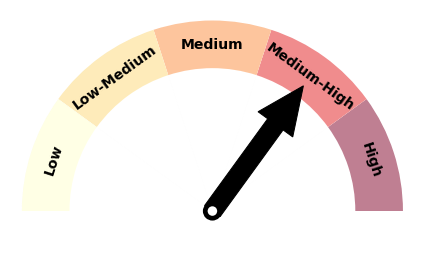
Forecast Confidence
Temperature
|
Forecast confidence for temperature is medium to high due to the expectation for westerly air flows during the season. Warm Australian air masses may regularly cross the Tasman Sea, leading to spells of heat for New Zealand and coastal waters, especially in the east. Thus, below average seasonal air temperatures have a lower chance of occurring. |
Rainfall
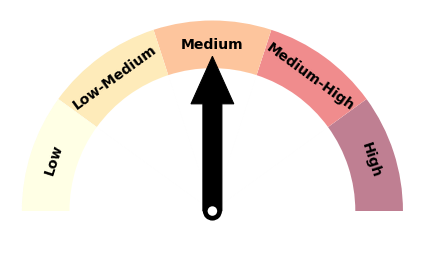
|
Forecast confidence for rainfall is medium, which is higher than last month, because the Indian Ocean Dipole is currently a strong global climate driver. It is expected to be associated with more westerly quarter winds during the upcoming season and the potential for heavy rain events, particularly in the west and south. |
