Outlook Summary
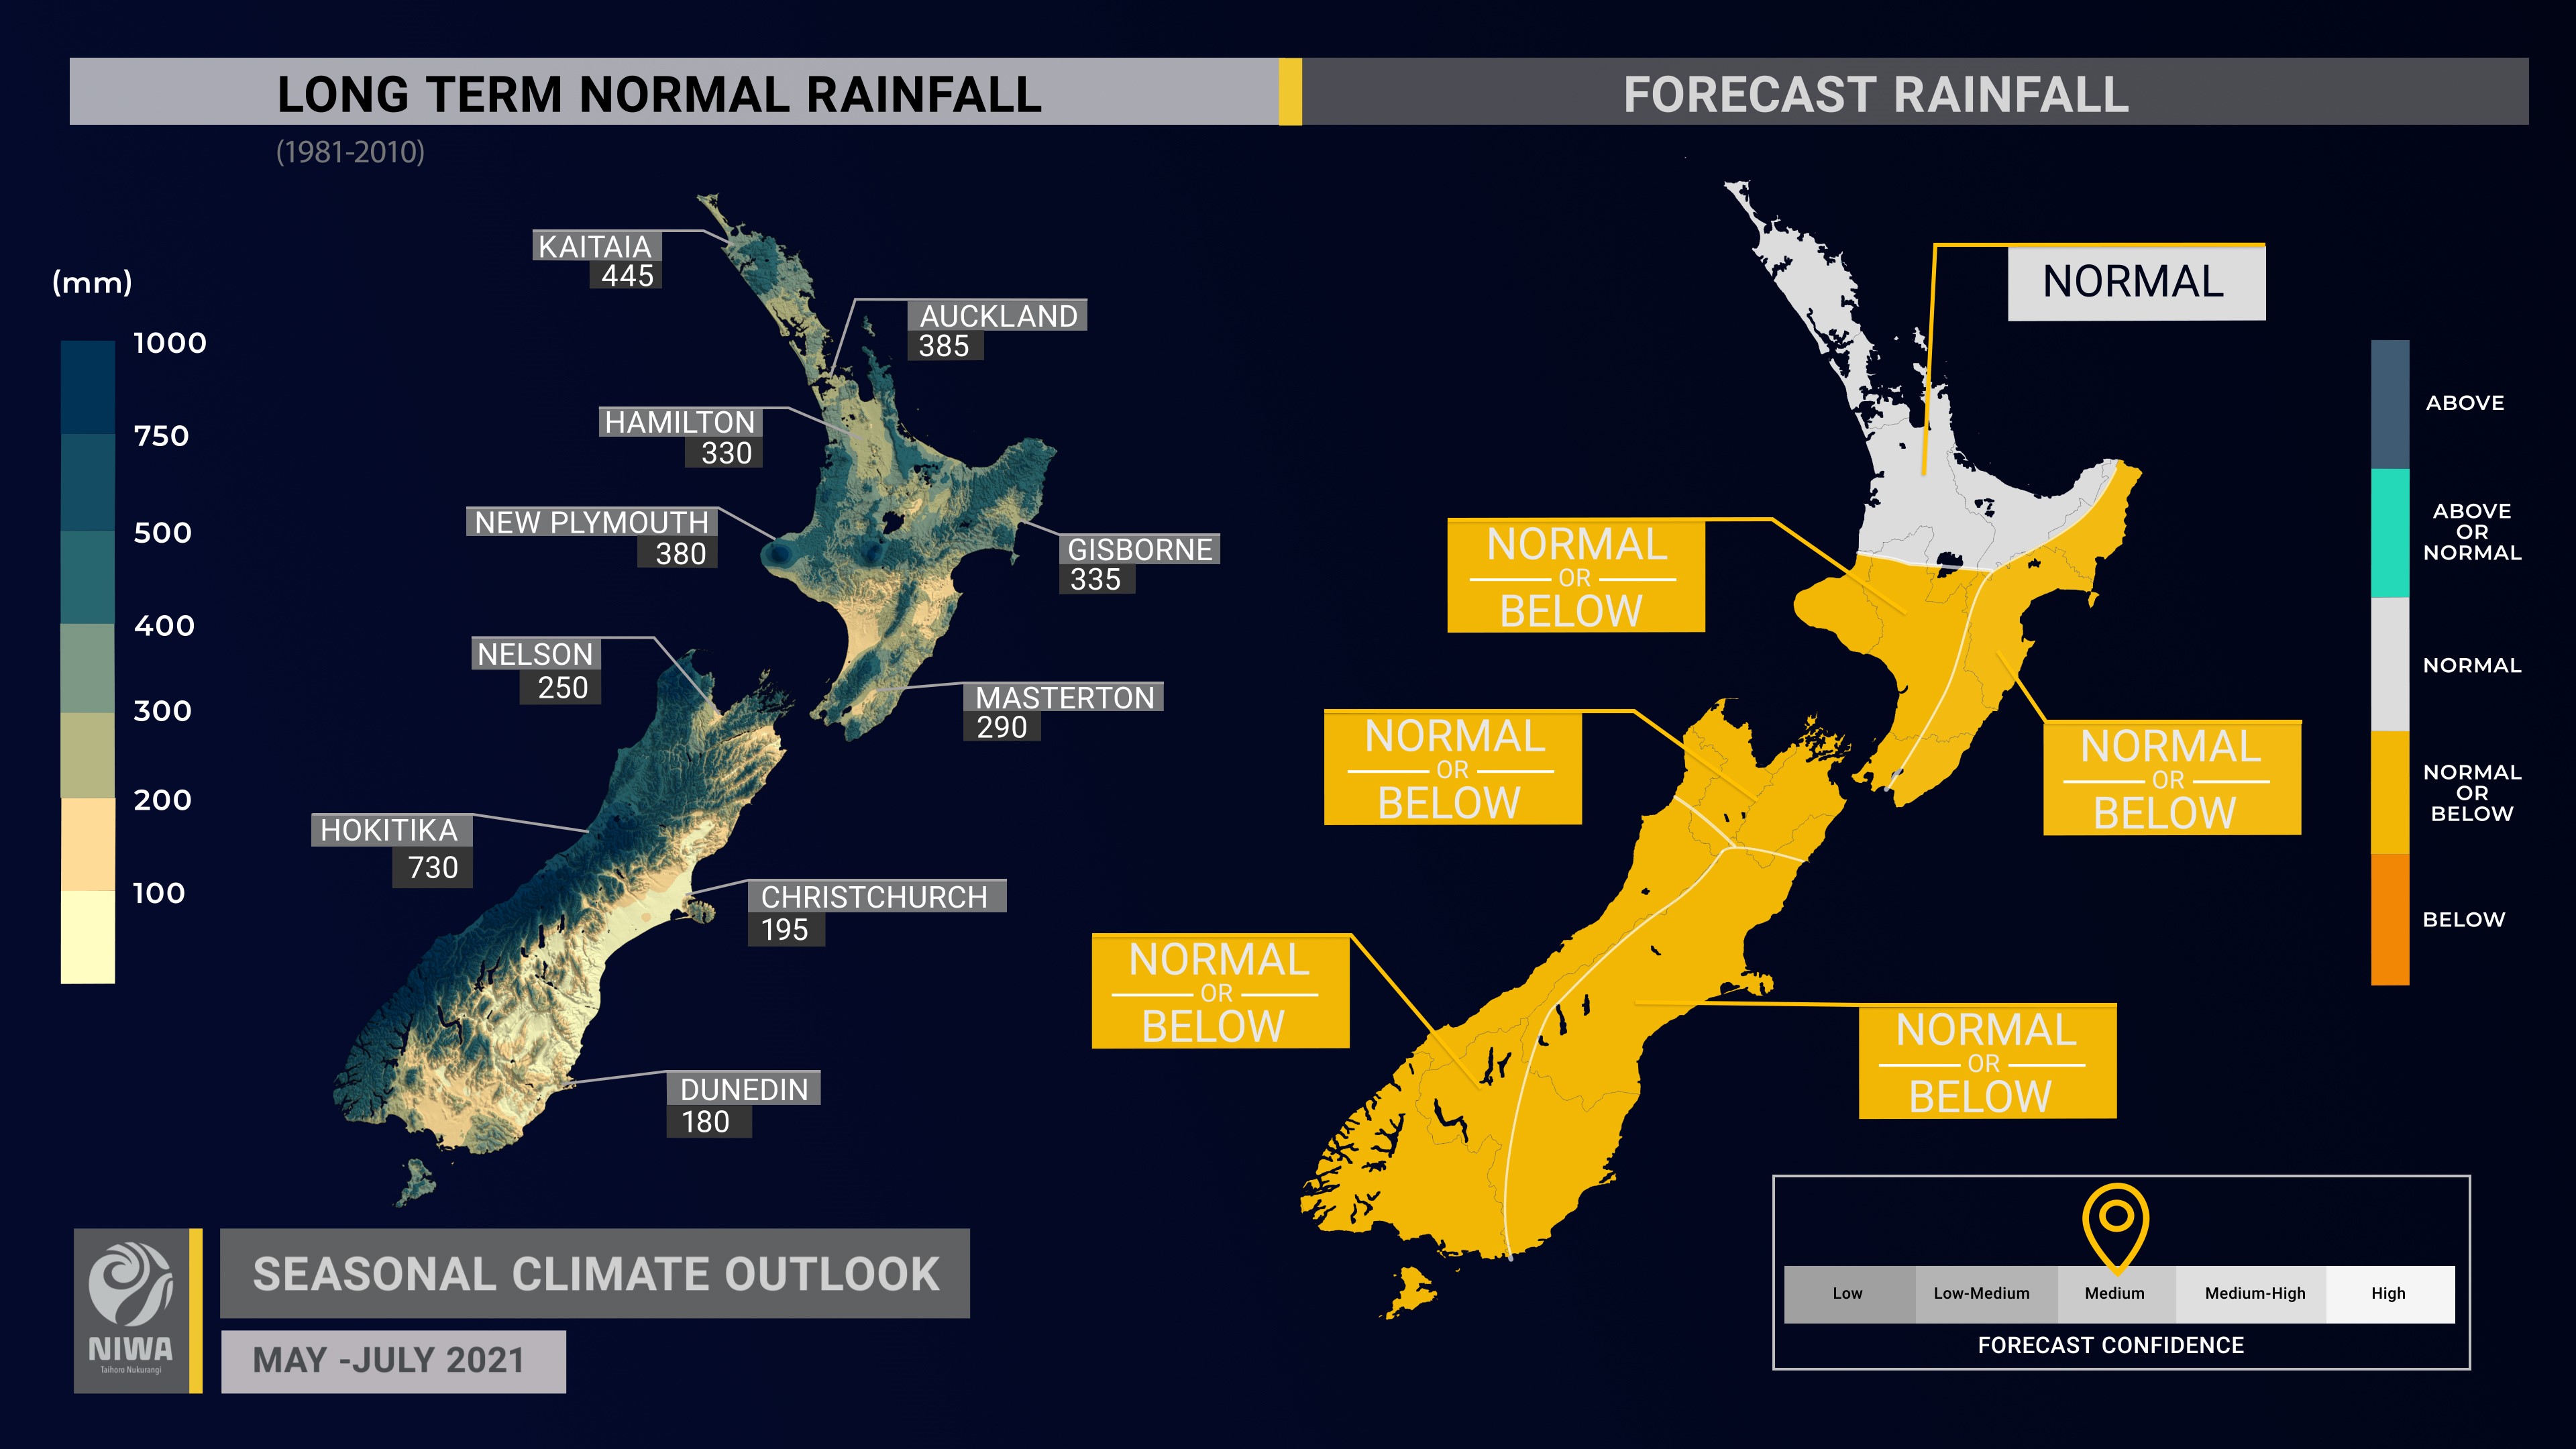
- Rainfall is about equally likely to be below normal or near normal in all regions of Aotearoa New Zealand except the north of the North Island, where near normal rainfall is most likely. It’s possible that long dry spells continue over the next three months.
- While rainfall events will occur over the next three months, their frequency may be reduced compared to normal. Groundwater and dam level recharge and increases in river flow and soil moisture will likely be less pronounced than normal.
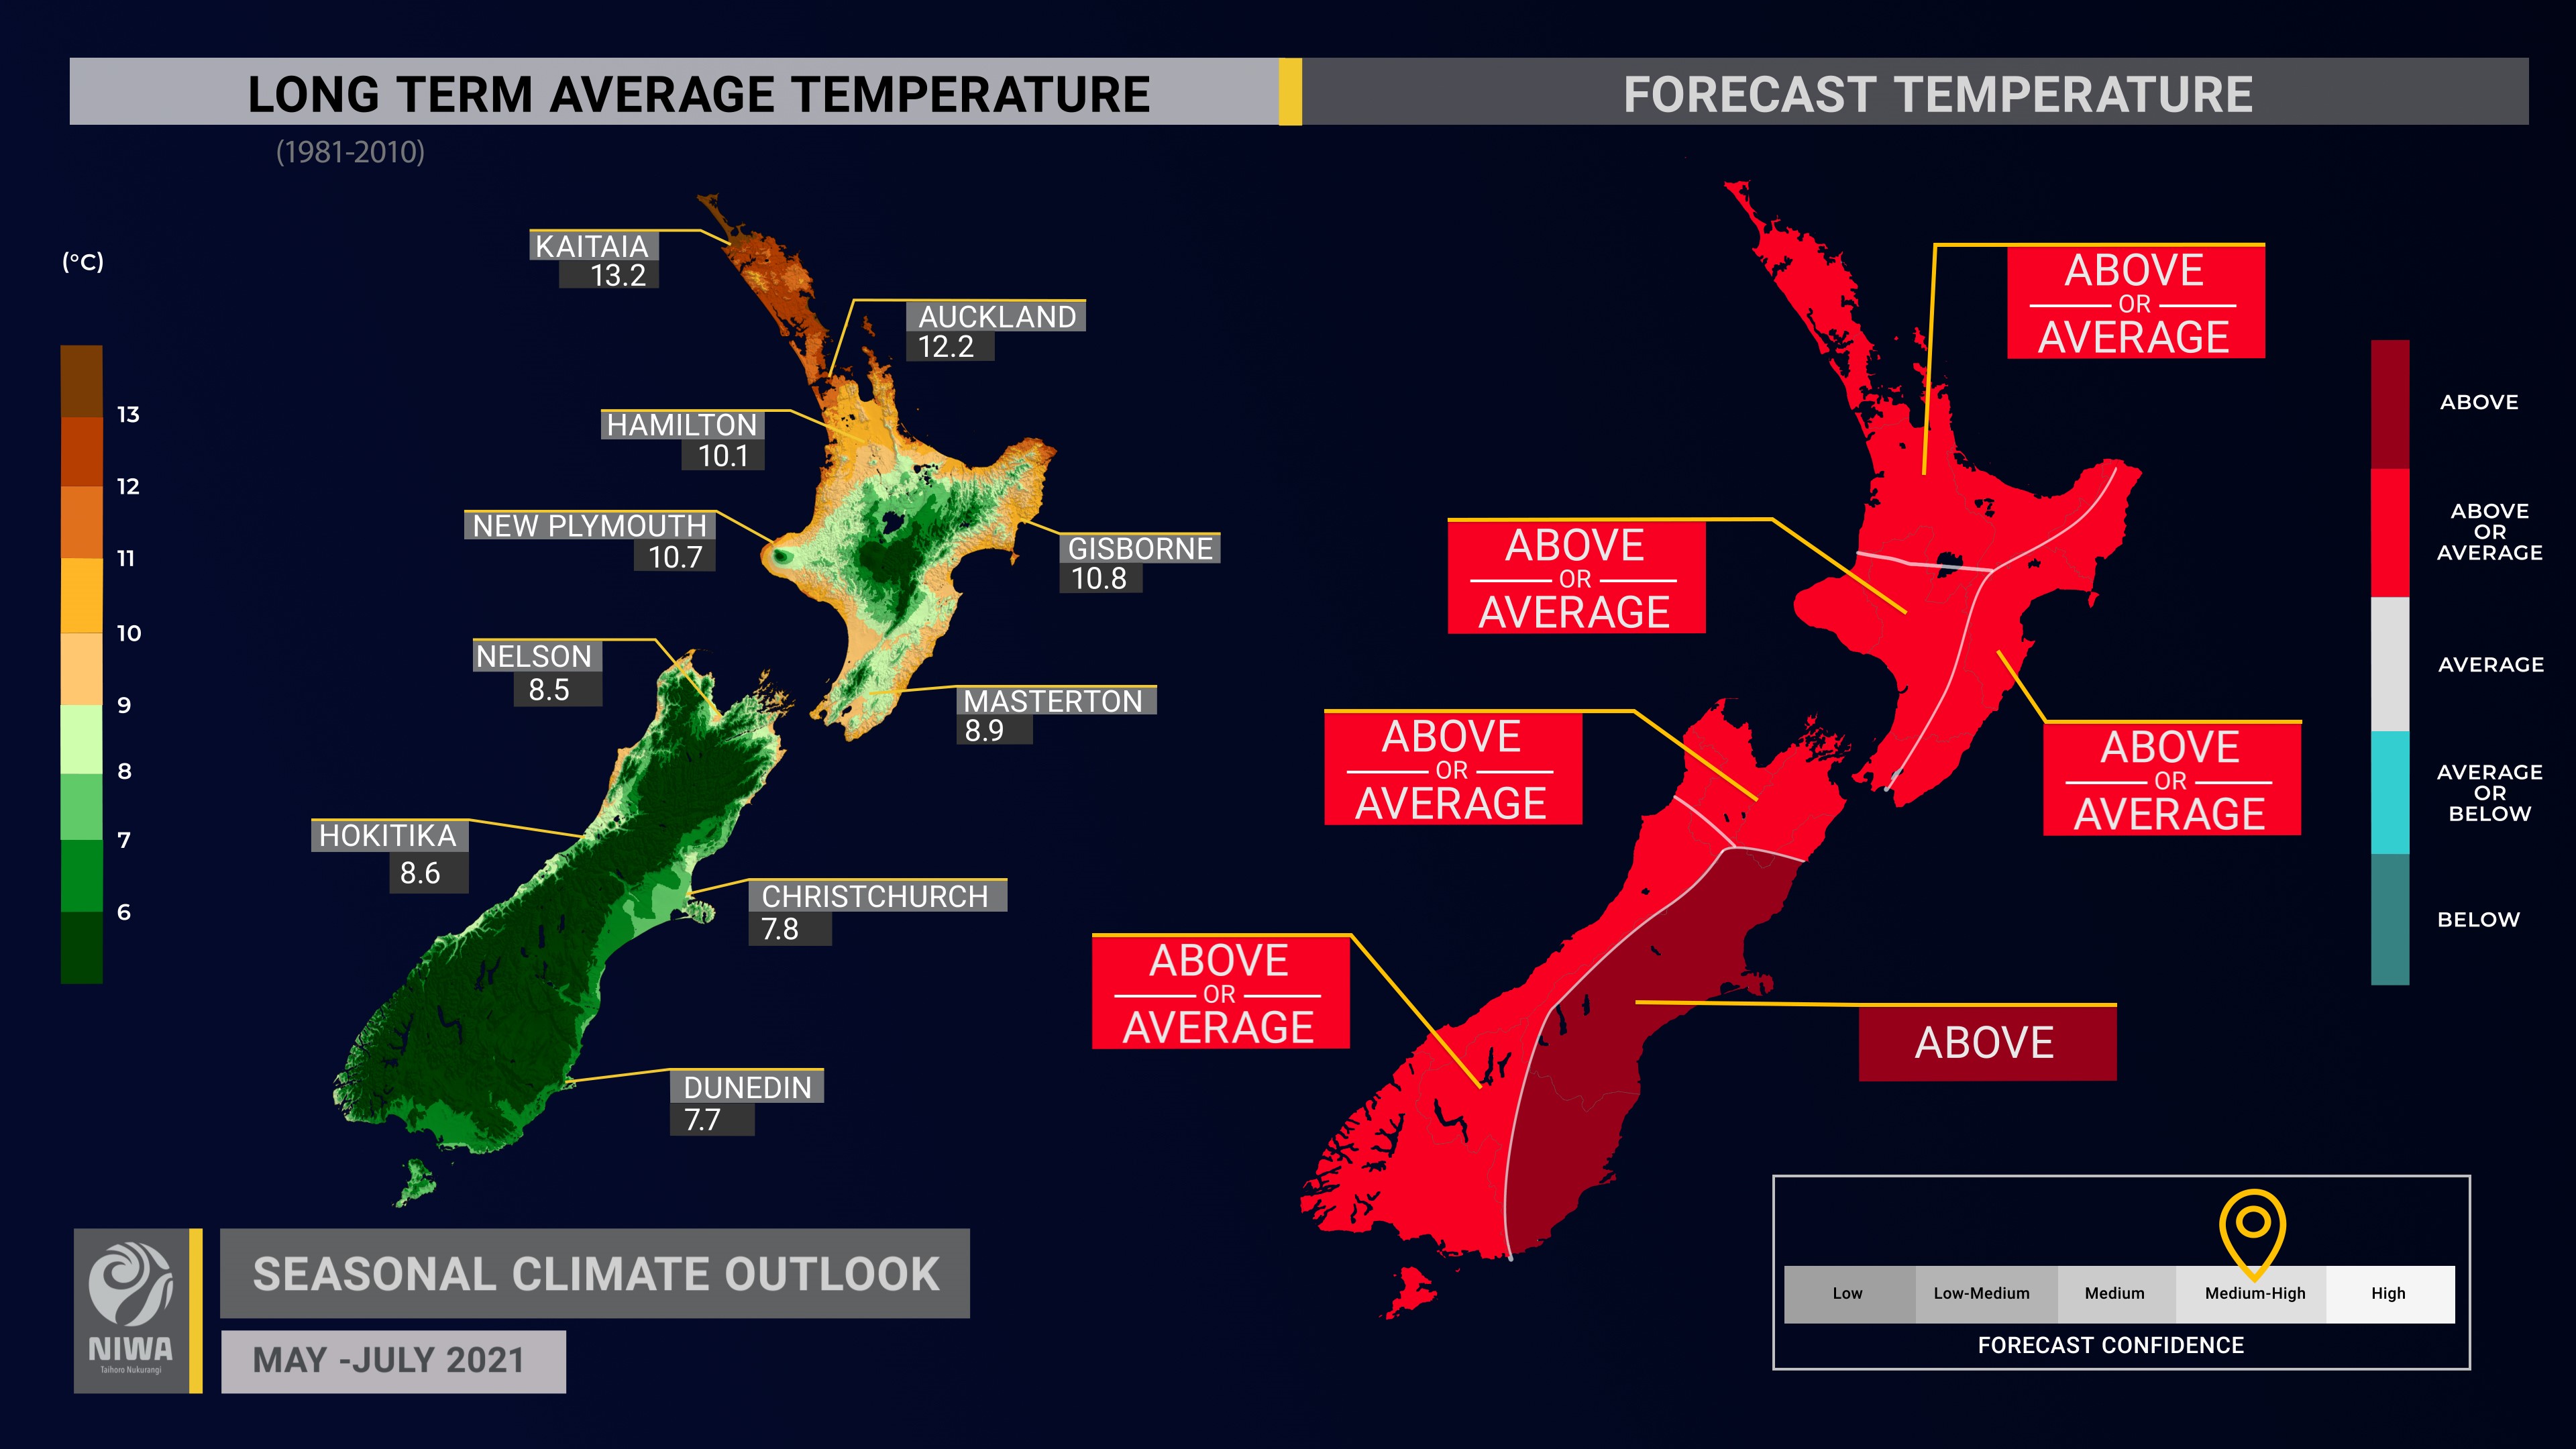
- Temperatures are very unlikely to be colder than average for the three months as a whole. Above average or near average temperatures are favoured for all regions except the east of the South Island, where above average temperatures are most likely.
- While frosts and cold spells will occur occasionally, they are generally expected to be brief.
- Air pressure is predicted to be higher than normal to the east of the country. This is expected to be associated with more westerly and northeasterly quarter winds than normal.
- La Niña transitioned to ENSO neutral conditions in the equatorial Pacific Ocean during April as the sub-surface ocean continued to warm. For more information, see the Background.
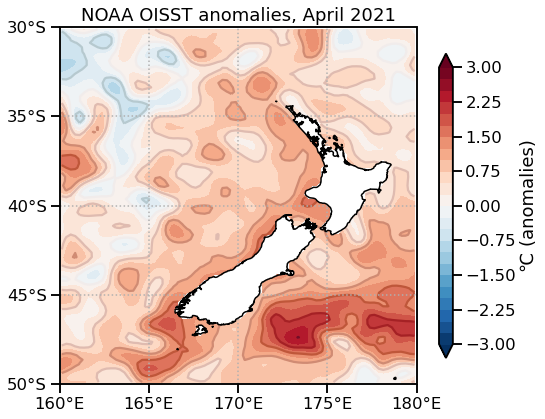
- Coastal sea surface temperatures (SSTs) ranged from 0.6 to 1.3˚C above average during April. Many areas experienced marine heatwave conditions, as described in the Background.
- Soil moisture levels and river flows are most likely to be near normal in the north and west of the North Island, below normal in the east of the South Island, and about equally likely to be near normal or below normal in all other regions.
Regional predictions for May – July 2021
Northland, Auckland, Waikato, Bay of Plenty
The table below shows the probabilities (or percent chances) for each of three categories: above average, near average, and below average. In the absence of any forecast guidance there would be an equal likelihood (33% chance) of the outcome being in any one of the three categories. Forecast information from local and global guidance models is used to indicate the deviation from equal chance expected for the coming three-month period, with the following outcomes the most likely (but not certain) for this region:
- Temperatures are about equally likely to be above average (50% chance) or near average (45% chance).
- Rainfall totals are about most likely to be near normal (45% chance).
- Soil moisture levels and river flows are most likely to be near normal (45% chance).
The full probability breakdown is:
|
Temperature |
Rainfall |
Soil moisture |
River flows |
|
|
Above average |
50 |
30 |
20 |
20 |
|
Near average |
45 |
45 |
45 |
45 |
|
Below average |
05 |
25 |
35 |
35 |
Central North Island, Taranaki, Whanganui, Manawatu, Wellington
Probabilities are assigned in three categories: above average, near average, and below average.
- Temperatures are about equally likely to be above average (50% chance) or near average (45% chance).
- Rainfall totals are about equally likely to be below normal (40% chance) or near normal (35% chance).
- Soil moisture levels and river flows are most likely to be near normal (45-50% chance).
The full probability breakdown is:
|
Temperature |
Rainfall |
Soil moisture |
River flows |
|
|
Above average |
50 |
25 |
25 |
20 |
|
Near average |
45 |
35 |
50 |
45 |
|
Below average |
05 |
40 |
25 |
35 |
Gisborne, Hawke’s Bay, Wairarapa
Probabilities are assigned in three categories: above average, near average, and below average.
- Temperatures are about equally likely to be above average (50% chance) or near average (45% chance).
- Rainfall totals are about equally likely to be near normal (40% chance) or below normal (35% chance).
- Soil moisture levels and river flows are equally likely to be near normal (40% chance) or below normal (40% chance).
- River flows will likely be slow to recover since there is a lag between soil moisture replenishment and an increase in river flows.
- Meteorological drought re-emerged during April in northern Hawke’s Bay and coastal Gisborne according to NIWA’s New Zealand Drought Index.
The full probability breakdown is:
|
Temperature |
Rainfall |
Soil moisture |
River flows |
|
|
Above average |
50 |
25 |
20 |
20 |
|
Near average |
45 |
40 |
40 |
40 |
|
Below average |
05 |
35 |
40 |
40 |
Tasman, Nelson, Marlborough, Buller
Probabilities are assigned in three categories: above average, near average, and below average.
- Temperatures are equally likely to be above average (45% chance) or near average (45% chance).
- Rainfall totals are about equally likely to be below normal (45% chance) or near normal (40% chance).
- Soil moisture levels and river flows are about equally likely to be near normal (40-45% chance) or below normal (40% chance).
The full probability breakdown is:
|
Temperature |
Rainfall |
Soil moisture |
River flows |
|
|
Above average |
45 |
15 |
20 |
15 |
|
Near average |
45 |
40 |
40 |
45 |
|
Below average |
10 |
45 |
40 |
40 |
West Coast, Alps and foothills, inland Otago, Southland
Probabilities are assigned in three categories: above average, near average, and below average.
- Temperatures are equally likely to be above average (45% chance) or near average (45% chance).
- Rainfall totals are about equally likely to be near normal (45% chance) or below normal (40% chance).
- Rainfall deficiencies will continue to be possible in the hydro lake areas.
- Soil moisture levels and river flows are equally likely to be below normal (40% chance) or near normal (40% chance).
The full probability breakdown is:
|
Temperature |
Rainfall |
Soil moisture |
River flows |
|
|
Above average |
45 |
15 |
20 |
20 |
|
Near average |
45 |
45 |
40 |
40 |
|
Below average |
10 |
40 |
40 |
40 |
Coastal Canterbury, east Otago
Probabilities are assigned in three categories: above average, near average, and below average.
- Temperatures are most likely to be above average (50% chance).
- Rainfall totals are about equally likely to be below normal (45% chance) or near normal (40% chance).
- Soil moisture levels and river flows are most likely to be below normal (50-55% chance).
- With the end of growing season, there will be less soil water uptake by plants, meaning that soil moisture can recover during rainfall events.
- River flows will likely be slow to recover since there is a lag between soil moisture replenishment and an increase in river flows.
The full probability breakdown is:
|
Temperature |
Rainfall |
Soil moisture |
River flows |
|
|
Above average |
50 |
15 |
10 |
15 |
|
Near average |
40 |
40 |
35 |
35 |
|
Below average |
10 |
45 |
55 |
50 |
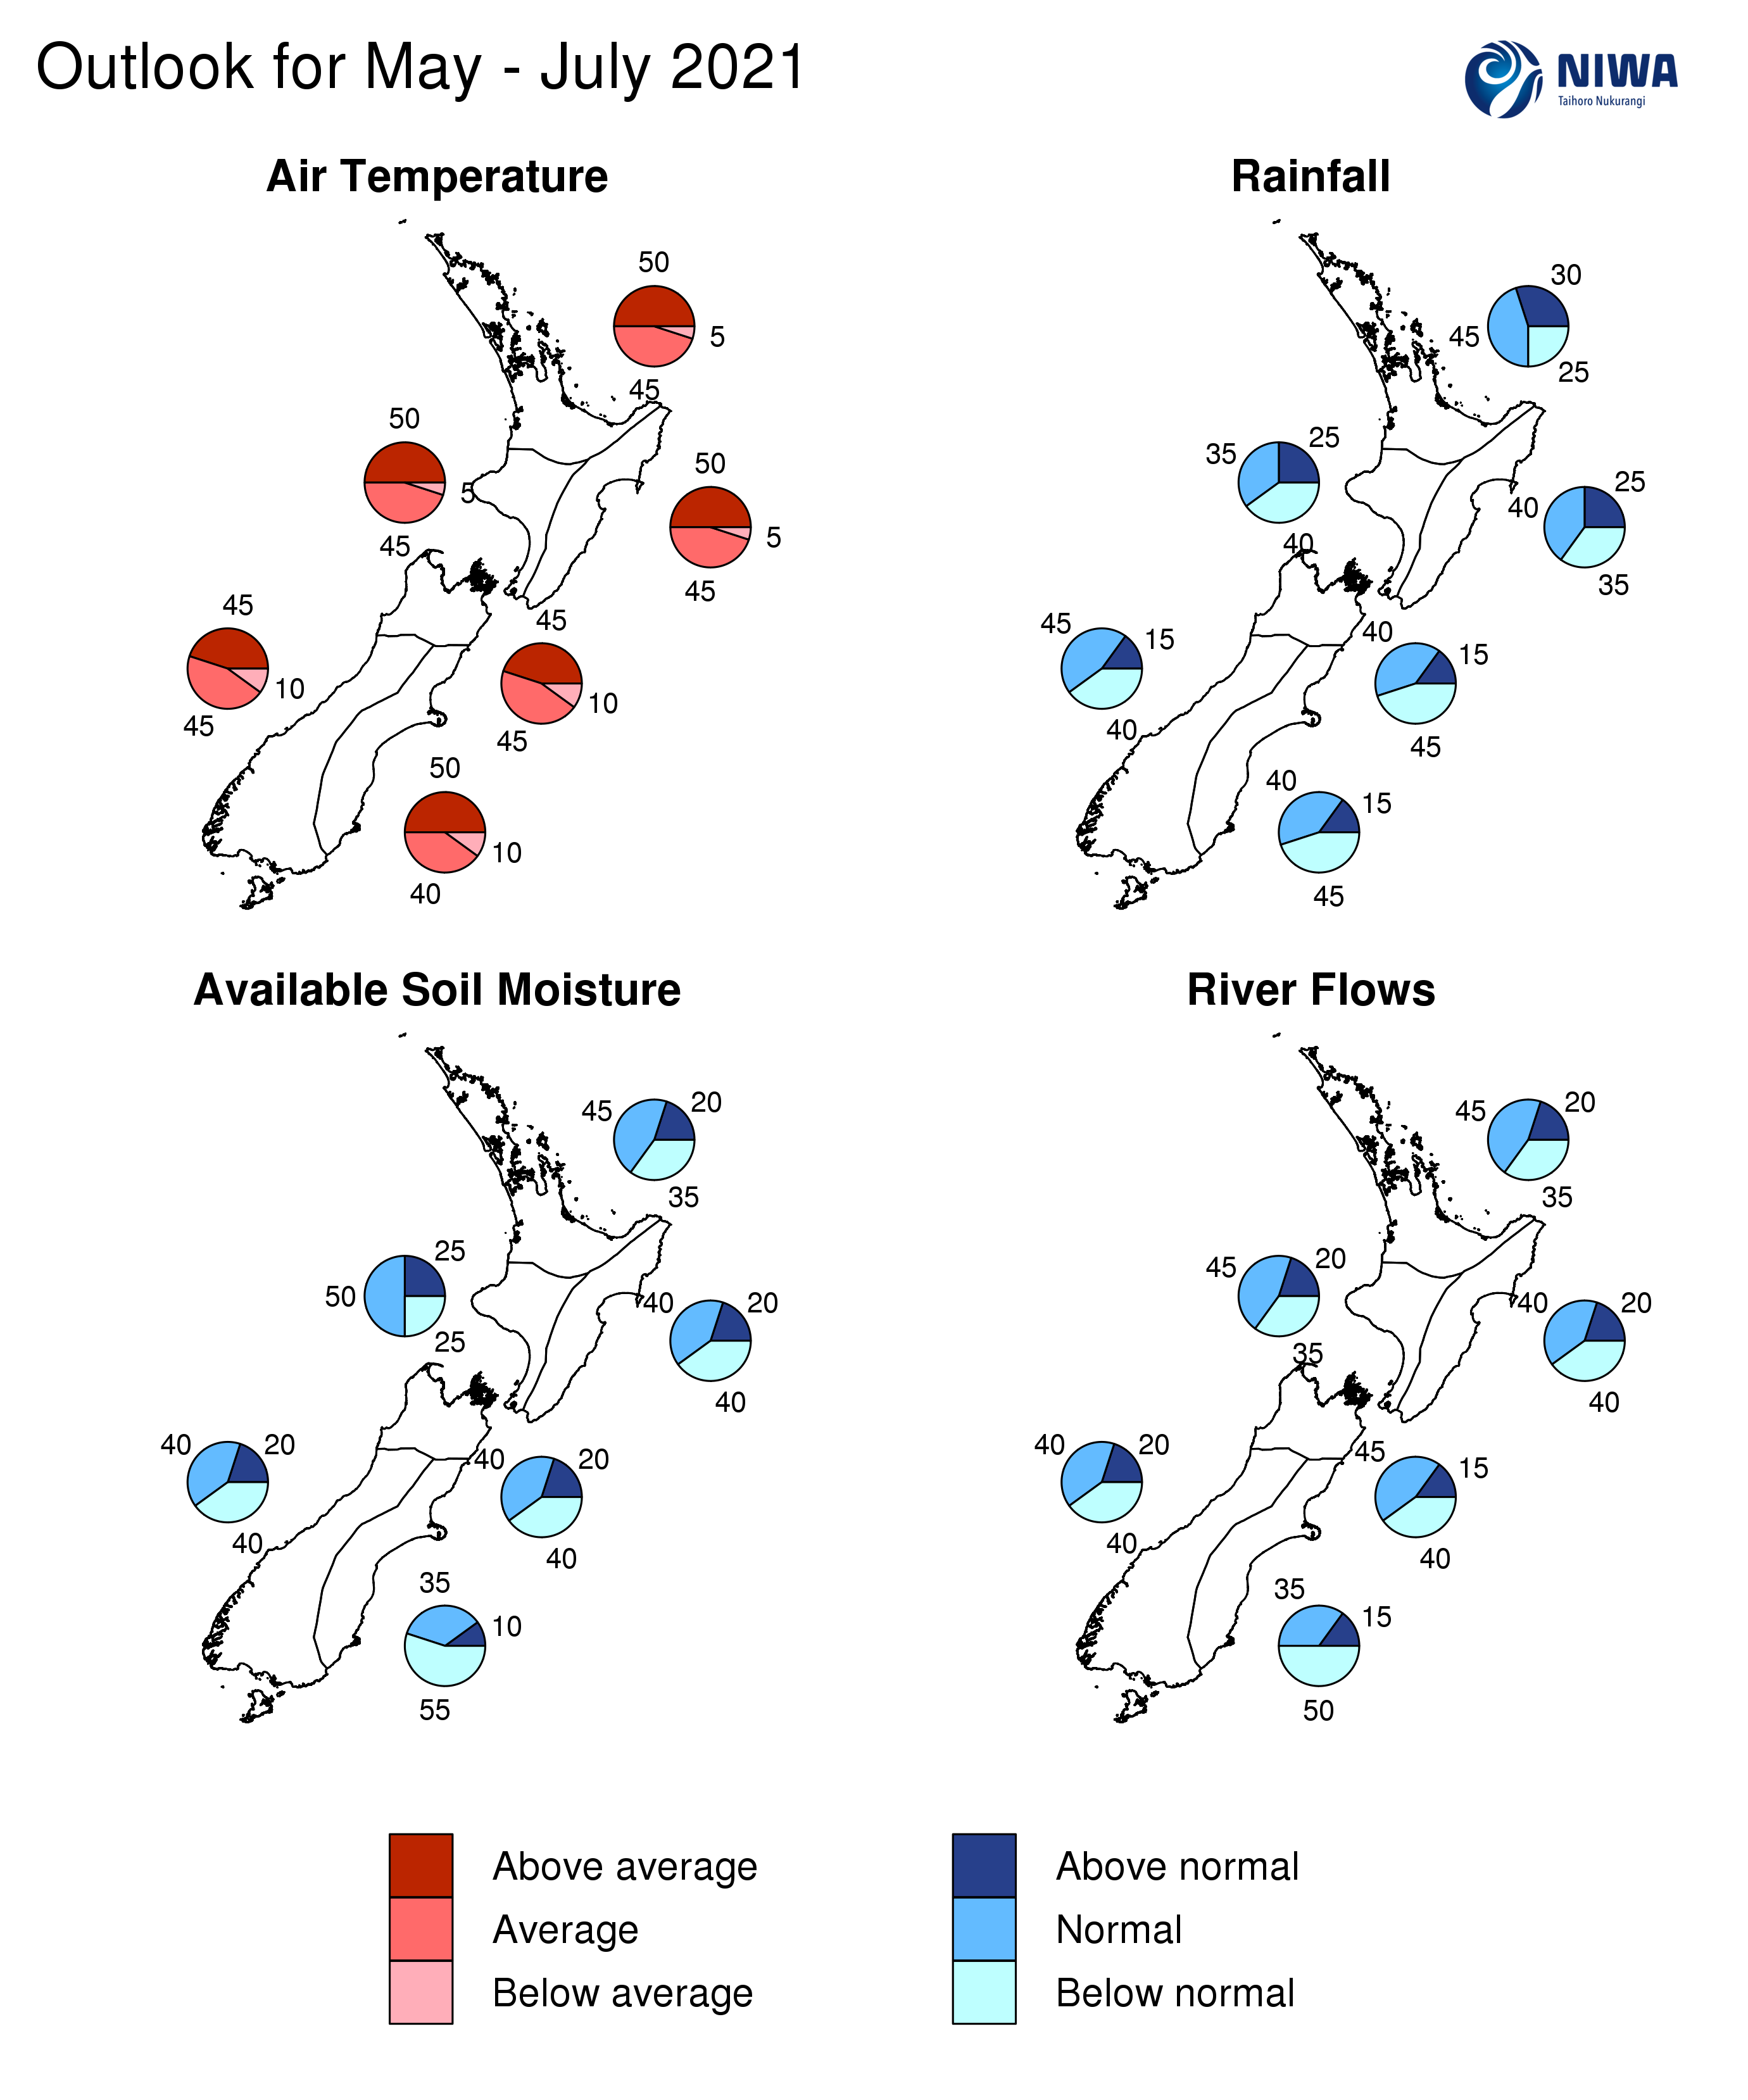
Graphical representation of the regional probabilities
Background
The NINO3.4 Index anomaly (in the central Pacific) during April (through the 25th) was -0.30˚C and the SOI (Southern Oscillation Index) was +0.3, both within the neutral range.
In the subsurface equatorial Pacific, a downwelling Kelvin wave caused substantial warming over the past several months and is now surfacing in the eastern part of the basin. Because of this, the La Niña “base state” has almost entirely faded, with a weak, remnant cool pool still lingering near the surface in the central Pacific. Accordingly, upper-oceanic heat content continued to increase.
The atmosphere may begin to react to these warming equatorial seas during the next three months, signalling the end to the La Niña event that began in October 2020.
According to the consensus from international models, the probability for ENSO neutral conditions is 78% for May – July. For August – October and November – January, the probability for ENSO neutral is 53% and 43%, respectively.
During April, convective forcing was influenced primarily by the active phase of the Madden-Julian Oscillation (MJO) over the western Pacific, which helped fuel several disturbances in the Tasman Sea that brought pockets of above normal rainfall to northern and western New Zealand.
The MJO is expected to move out of the Pacific and into the Americas, Africa, and the western Indian Ocean during early May, resulting in a large area of high pressure for New Zealand.
During mid and late May, convective forcing is expected to reach the western Pacific with an increasing chance for unsettled weather around New Zealand.
During June and July, convective forcing may focus over the eastern Pacific, the Americas, and Africa. The lack of MJO activity in the western Pacific may result in the continuation of dry spells for New Zealand.
New Zealand’s coastal water temperature anomalies increased substantially during April, ranging from 0.6˚C to 1.4˚C above average. Marine heatwave conditions were present in the coastal waters of many regions.
NZ coastal SSTs during April 2021 (through the 28th)
|
North NI |
0.79˚C |
|
West NI |
1.26˚C |
|
East NI |
0.55˚C |
|
North SI |
1.07˚C |
|
West SI |
1.33˚C |
|
East SI |
0.92˚C |
The Southern Annular Mode
The Southern Annular Mode (SAM) was positive during April despite lower than normal air pressure in the New Zealand region. The SAM is expected to be in its positive phase during early May, associated with a large ridge of high pressure over New Zealand.
Forecast Confidence
Temperature
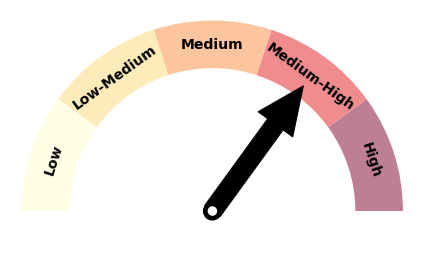
|
Forecast confidence for temperatures is medium to high. Air flow patterns over the coming three months are not expected to frequently favour cold southerlies. Sea temperatures around NZ also continue to run warmer than average, which can influence air temperatures. |
Rainfall
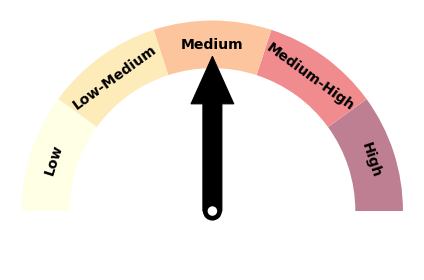
|
Forecast confidence for rainfall is medium. Changing conditions in the tropical Pacific can contribute some level of uncertainty to the outlook, although there is likely to be a lag effect, with La Niña’s drier patterns persisting for some time to come. |
