Outlook Summary
- ENSO-neutral conditions continued in April. The Southern Oscillation Index (SOI) was neutral and central Pacific sea surface temperatures (SSTs) were on the El Niño side of neutral.
- Oceanic ENSO-neutral conditions will very likely persist (76% chance) over the next three months.
- Rainfall and thunderstorm patterns in the global tropics are expected to be associated with more westerly-quarter winds than normal (from southwest to northwest) around New Zealand.
- Sharp cold snaps are possible during the month of May as fronts move onto the country from the Tasman Sea and Southern Ocean.
- May – July 2020 air pressure is forecast to be higher than normal north and lower than normal south of New Zealand. This is expected to be associated with a westerly quarter air flow anomaly.
- Air temperatures are about equally likely to be near average or above average in north and east of both islands. Near average temperatures are most likely in the west of both islands. Cold snaps and frosts can be expected in typically colder locations through the three-month period.
- Rainfall is about equally likely to be near normal or below normal in the north and east of both islands. Near normal rainfall is most likely in the west of both islands.
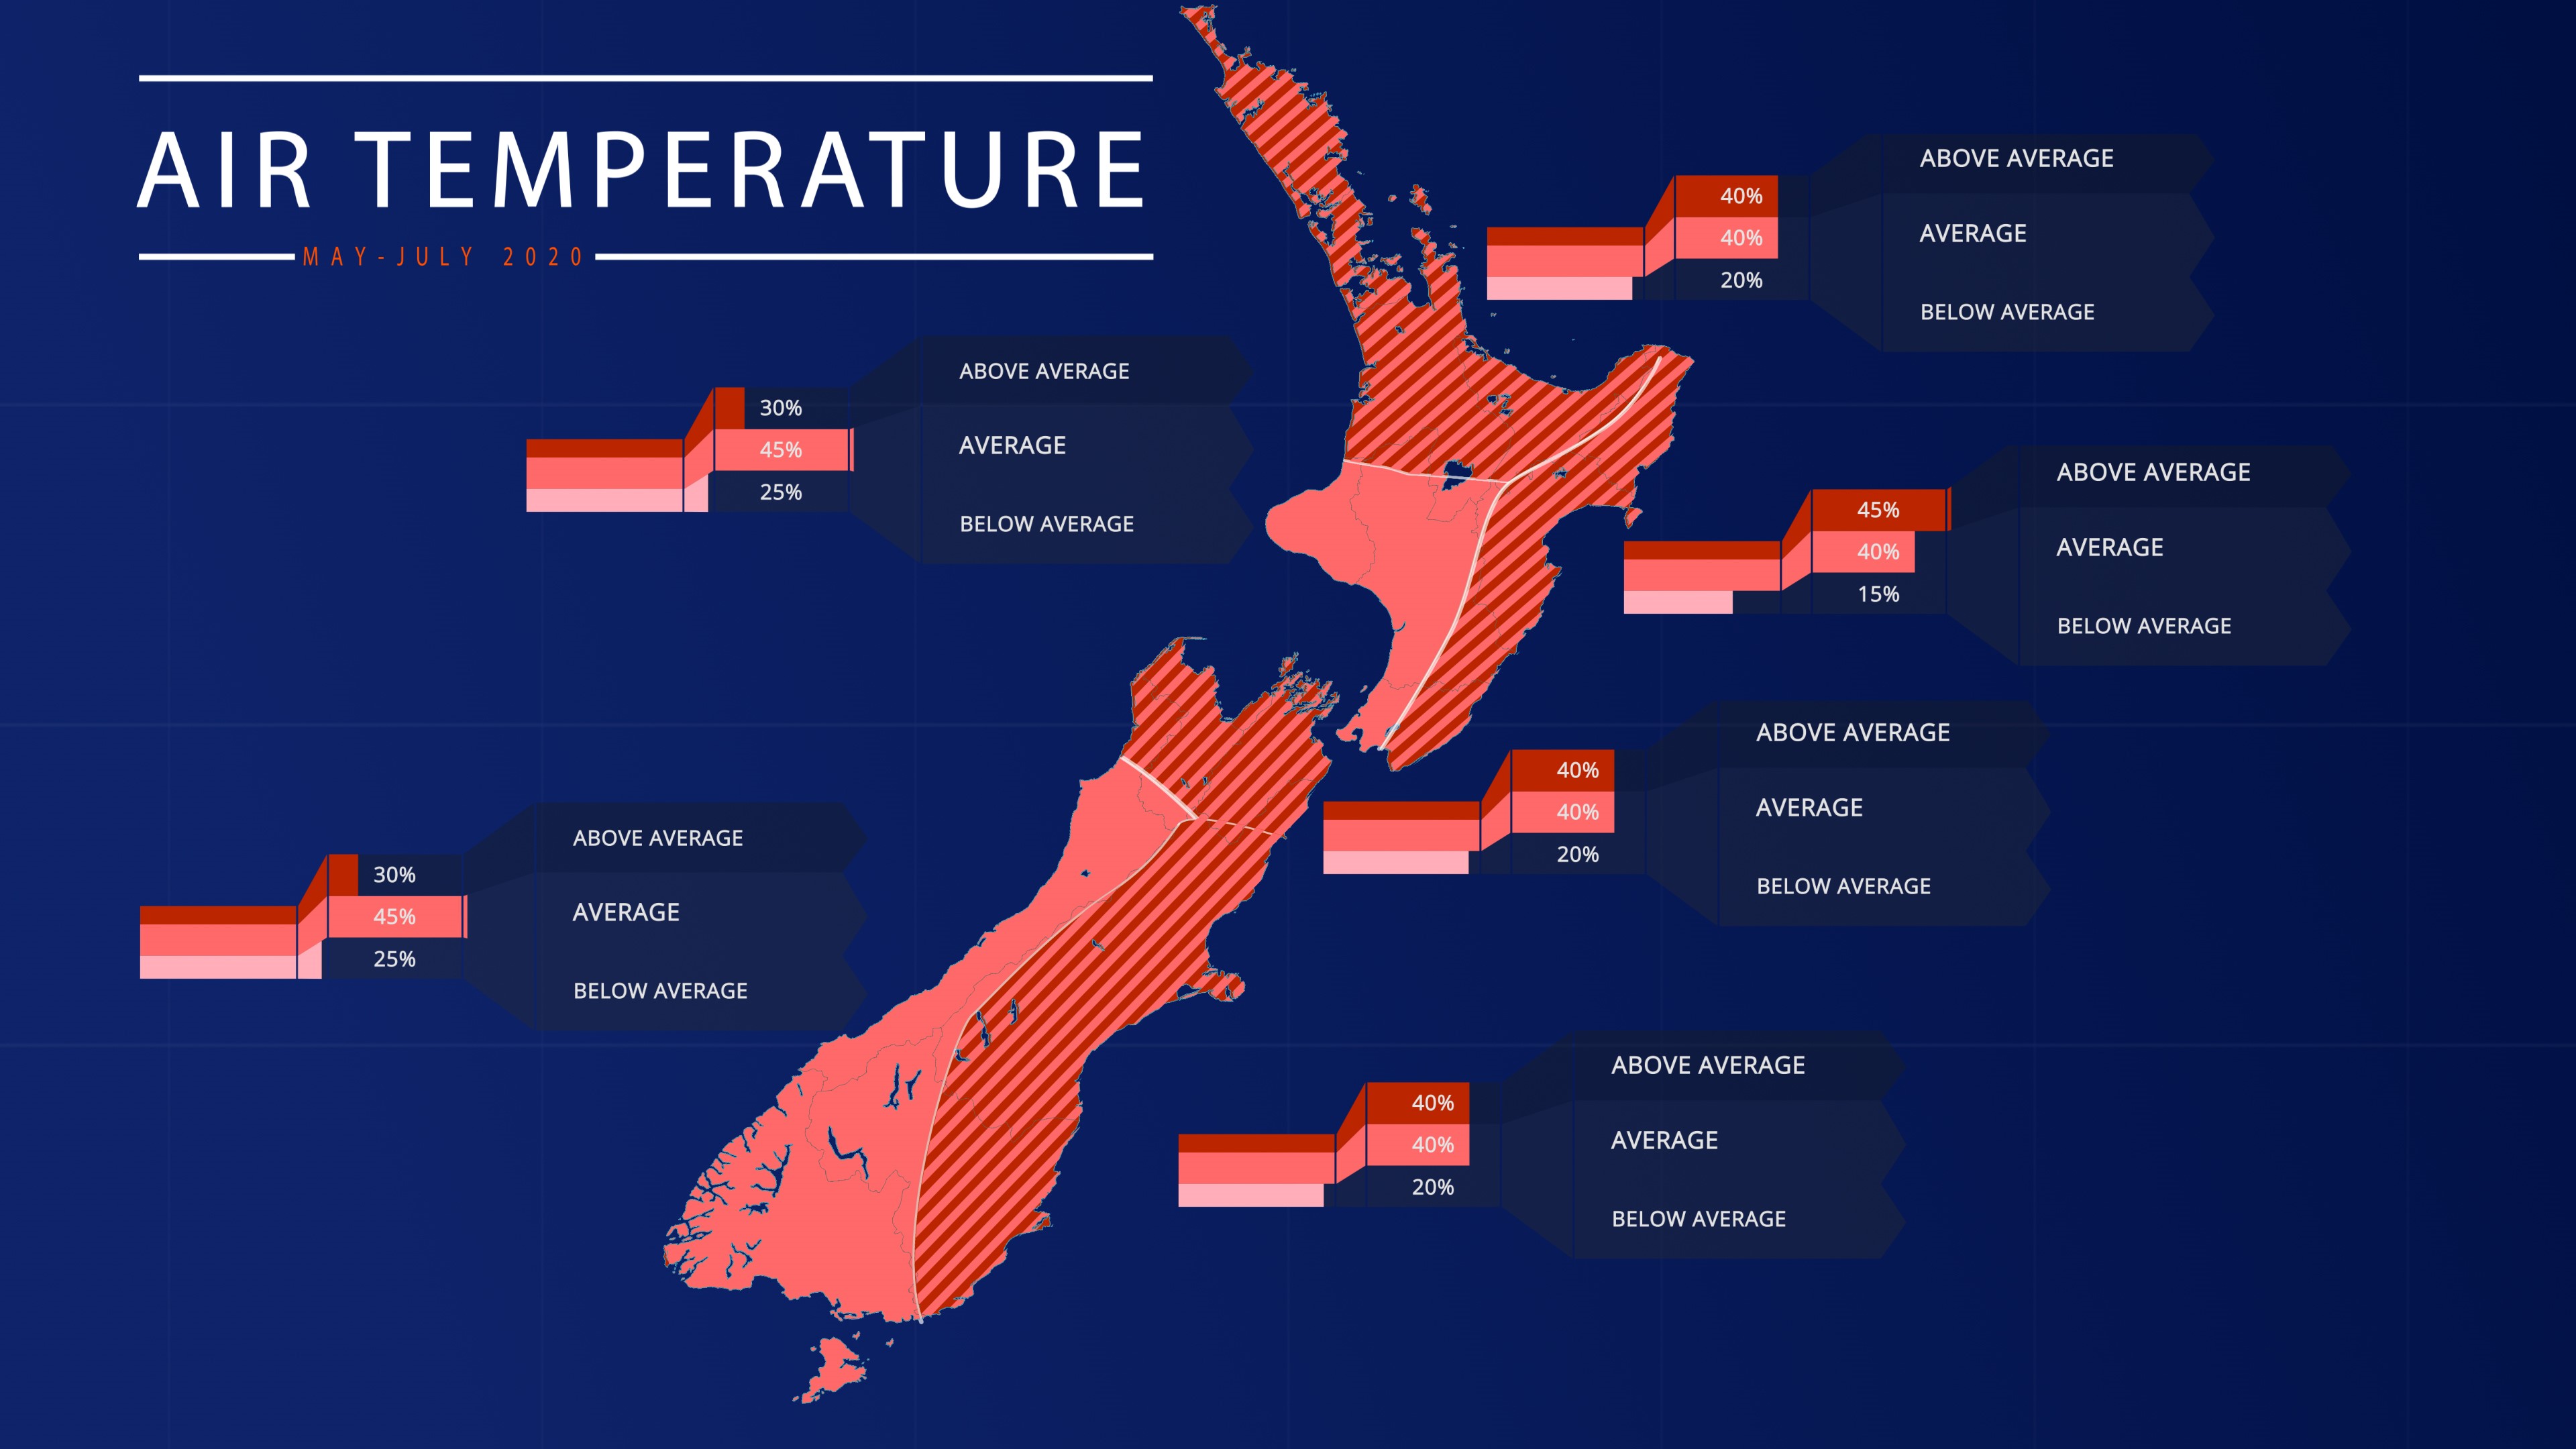
Air Temperature
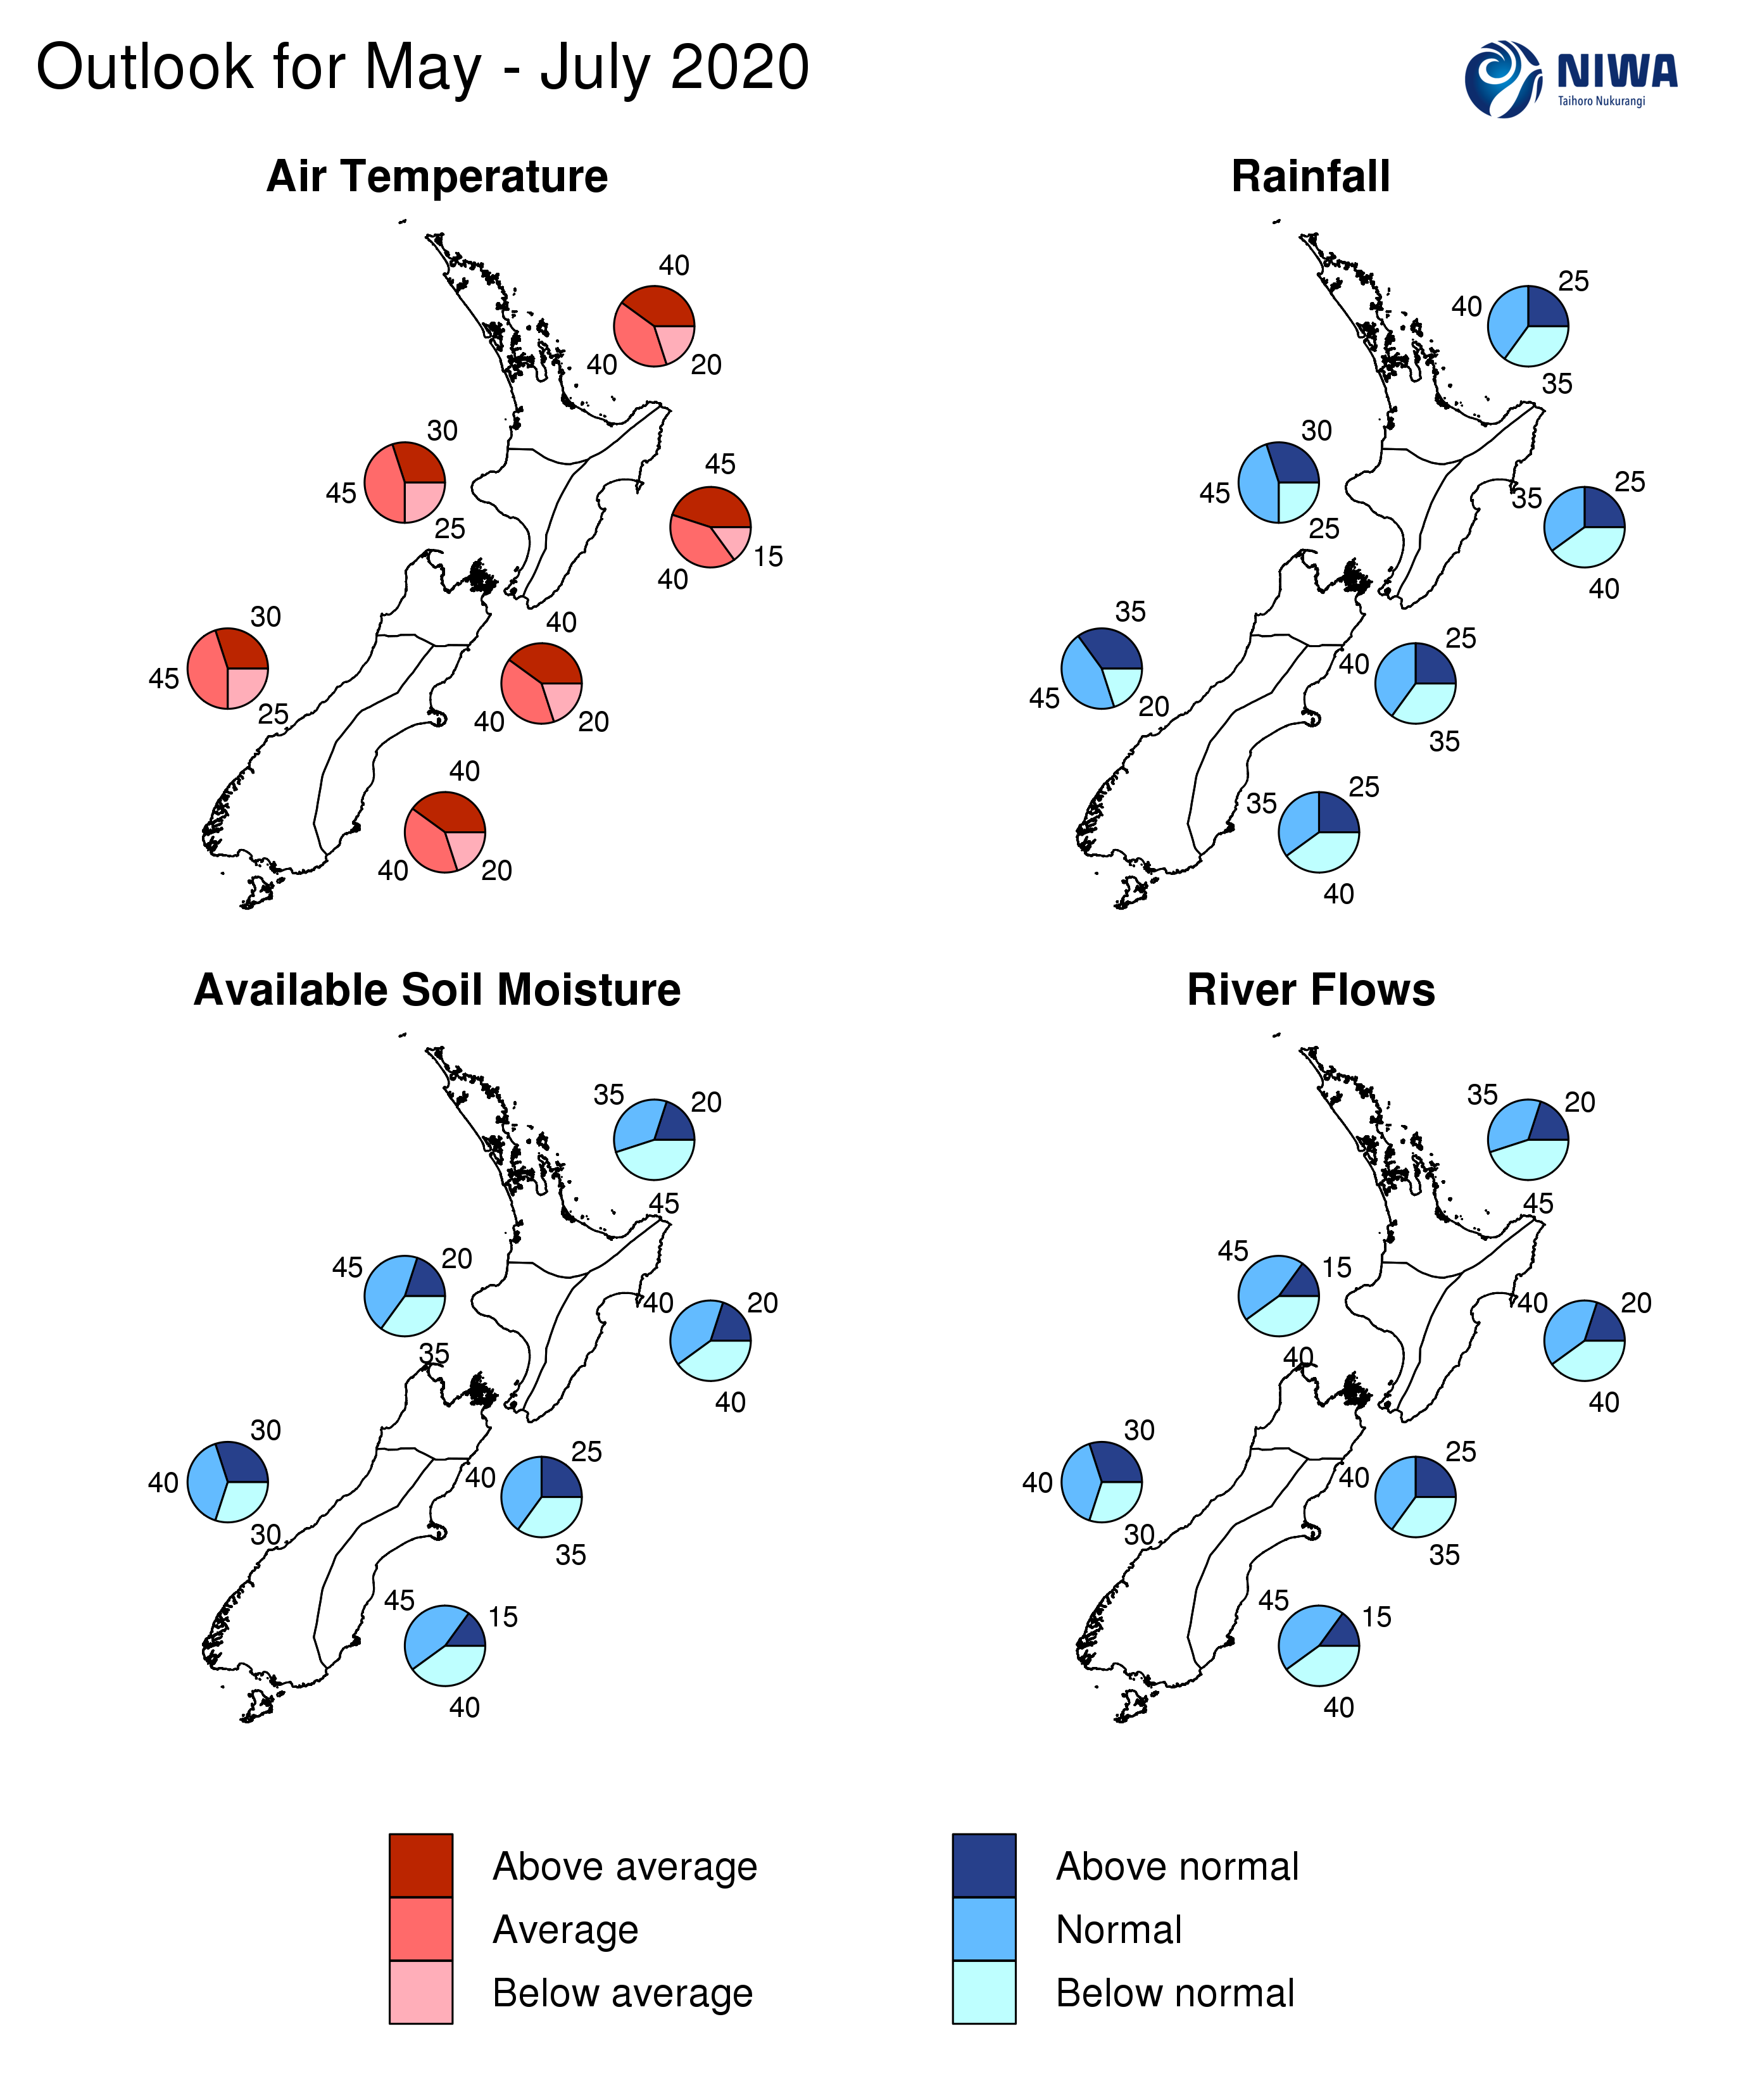
May – July 2020 air temperatures are about equally likely to be near average (40% chance) or above average (40-45% chance) in the north and east of both islands. Near average temperatures are most likely (45% chance) in the west of both islands.
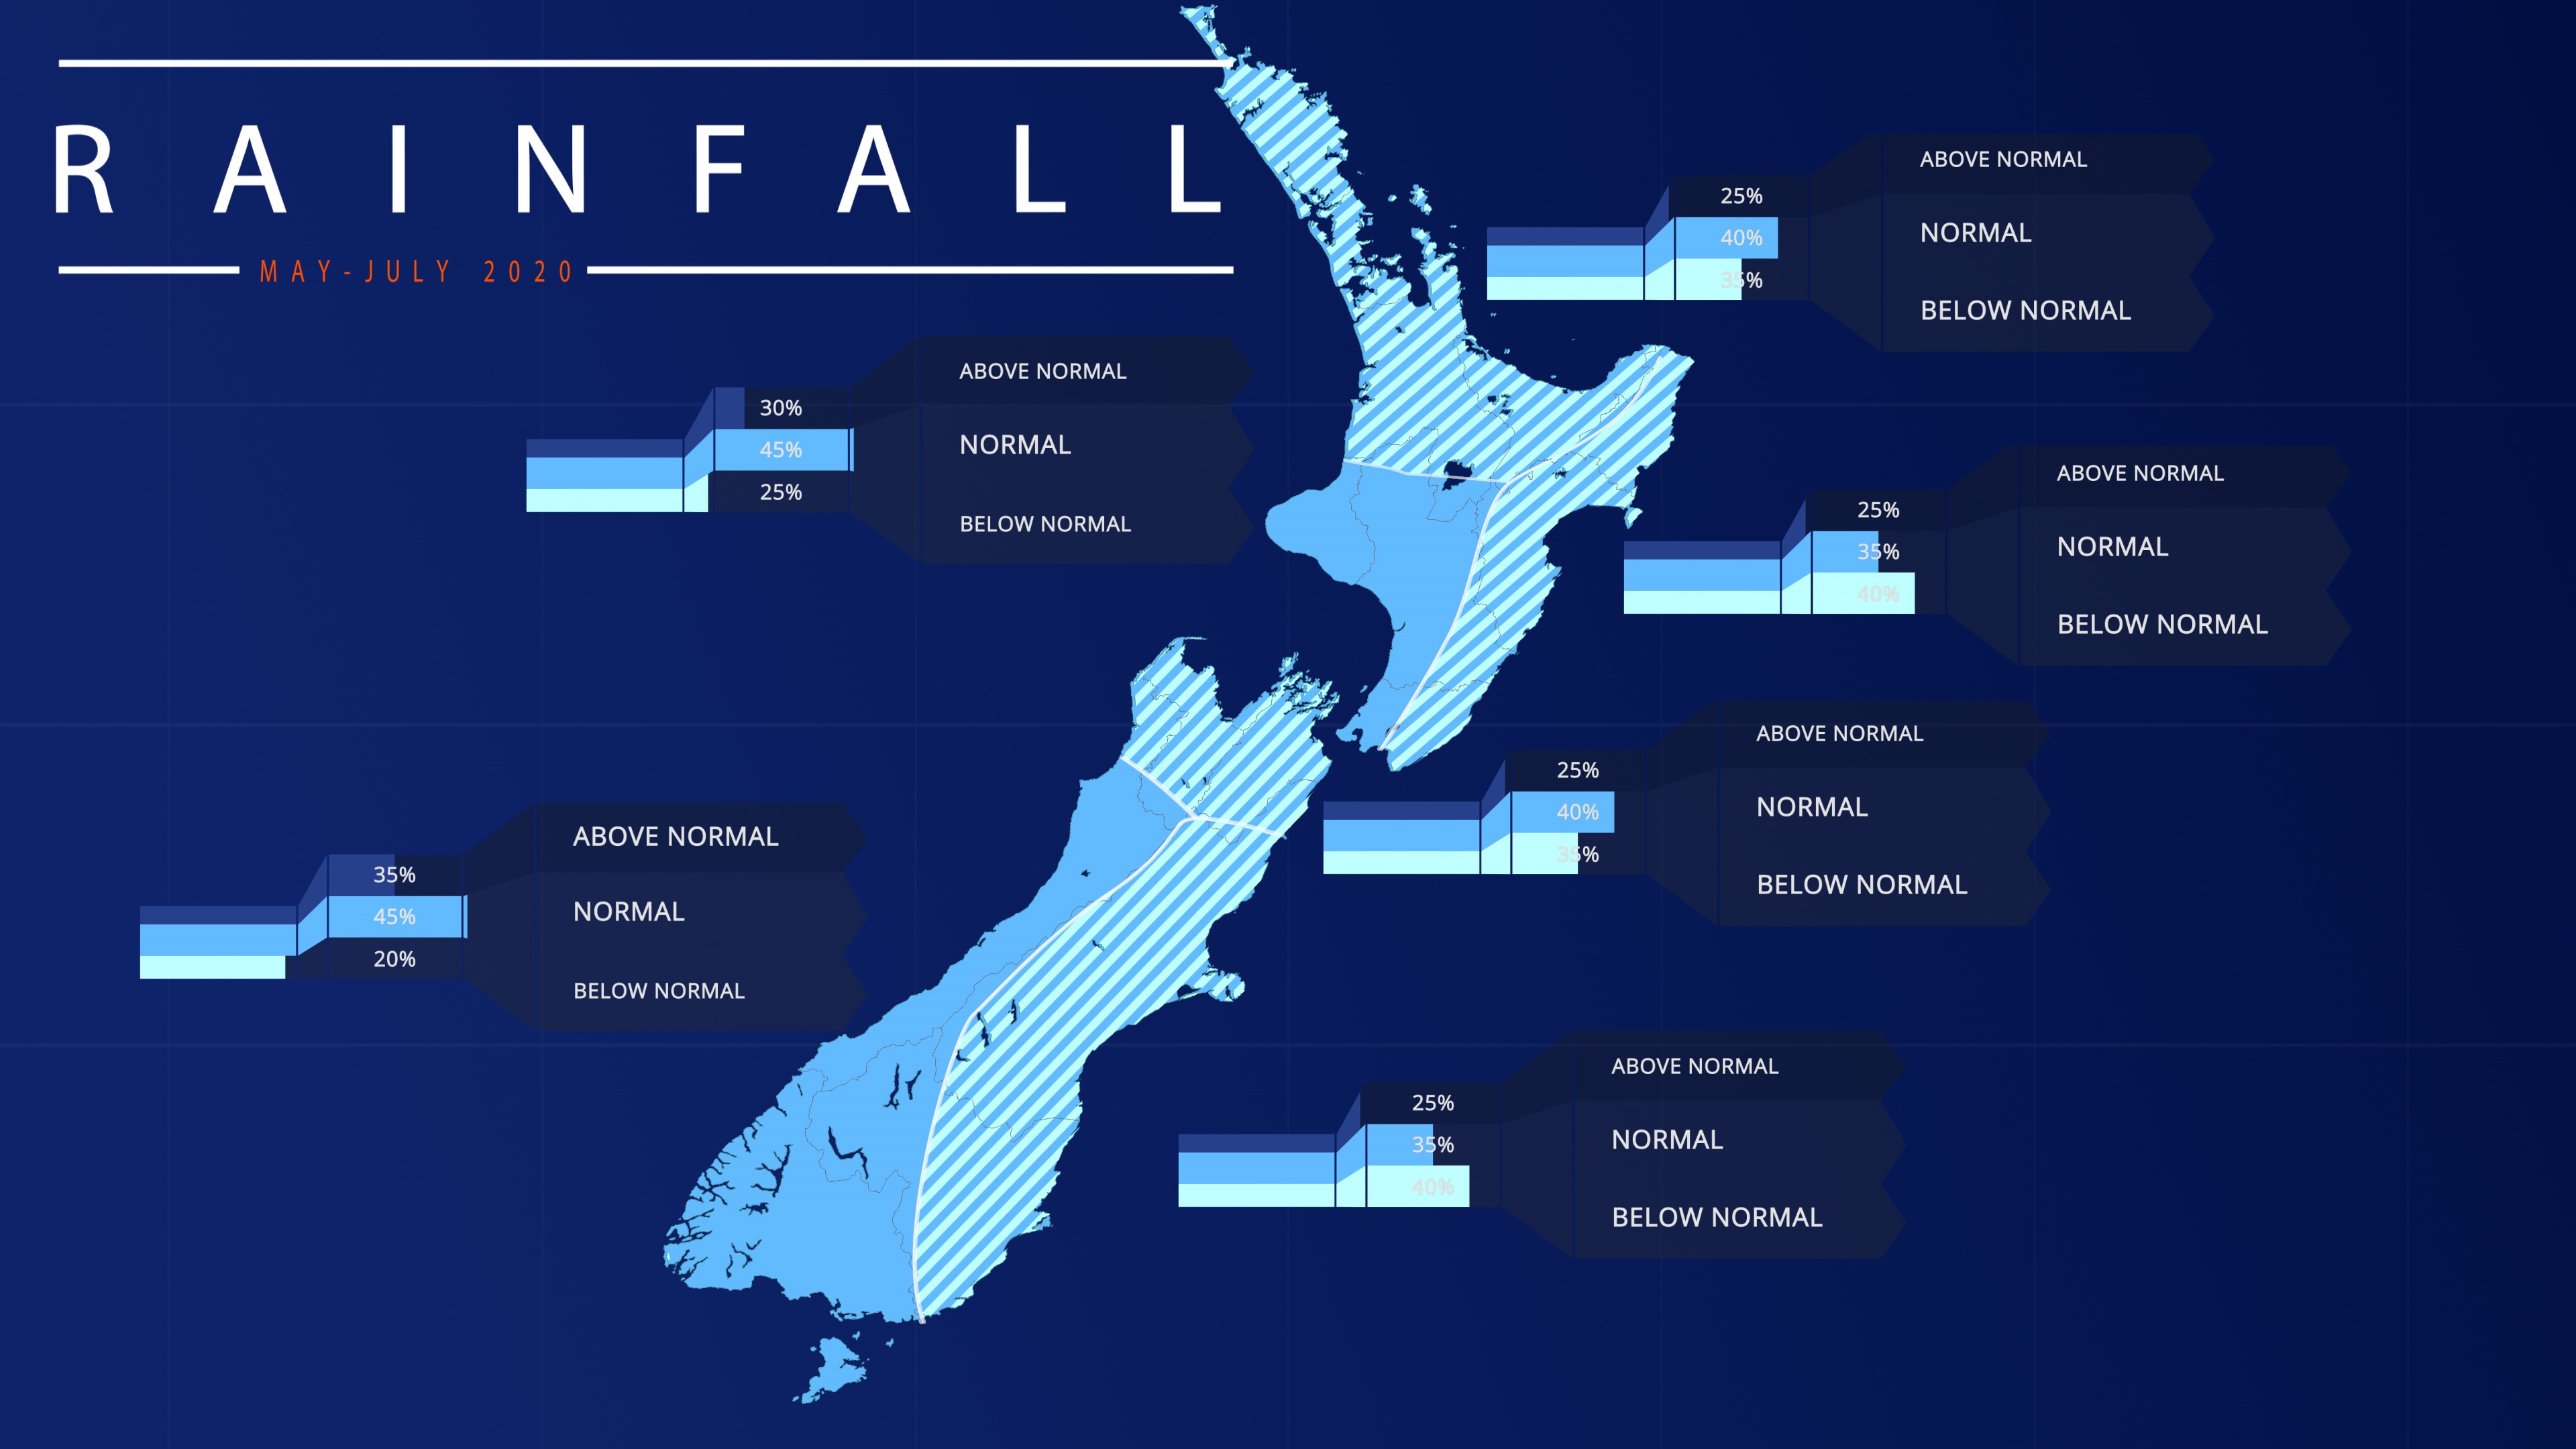
Rainfall
May – July 2020 rainfall is about equally likely to be near normal (35-40% chance) or below normal (35-40% chance) in the north and east of both islands. Near normal rainfall is most likely in the west of both islands (45% chance).
Soil Moisture
May – July 2020 soil moisture and river flows are most likely to be below normal (45% chance) in the north of the North Island and most likely to be near normal in the west of the South Island (40% chance). For the east of the North Island and north and east of the South Island, soil moisture levels and river flows are about equally likely to be near normal (40-45% chance) or below normal (35-40% chance). For the west of the North Island, soil moisture is most likely to be near normal (45% chance) while river flows are about equally likely to be normal (45% chance) or below normal (40% chance).
Regional predictions for May – July 2020
Northland, Auckland, Waikato, Bay of Plenty
The table below shows the probabilities (or percent chances) for each of three categories: above average, near average, and below average. In the absence of any forecast guidance there would be an equal likelihood (33% chance) of the outcome being in any one of the three categories. Forecast information from local and global guidance models is used to indicate the deviation from equal chance expected for the coming three-month period, with the following outcomes the most likely (but not certain) for this region:
- Temperatures are equally likely to be near average (40% chance) or above average (40% chance).
- Rainfall totals are about equally likely to be near normal (40% chance) or below normal (35% chance).
- Soil moisture levels and river flows are most likely to be below normal (45% chance).
The full probability breakdown is:
|
Temperature |
Rainfall |
Soil moisture |
River flows |
|
|
Above average |
40 |
25 |
20 |
20 |
|
Near average |
40 |
40 |
35 |
35 |
|
Below average |
20 |
35 |
45 |
45 |
Central North Island, Taranaki, Whanganui, Manawatu, Wellington
Probabilities are assigned in three categories: above average, near average, and below average.
- Temperatures are most likely to be near average (45% chance).
- Rainfall totals are most likely to be near normal (45% chance).
- Soil moisture levels are most likely to be near normal (45% chance).
- River flows are about equally likely to be near normal (45% chance) or below normal (40% chance).
The full probability breakdown is:
|
Temperature |
Rainfall |
Soil moisture |
River flows |
|
|
Above average |
30 |
30 |
20 |
15 |
|
Near average |
45 |
45 |
45 |
45 |
|
Below average |
25 |
25 |
35 |
40 |
Gisborne, Hawke’s Bay, Wairarapa
Probabilities are assigned in three categories: above average, near average, and below average.
- Temperatures are about equally likely to be near average (40% chance) or above average (45% chance).
- Rainfall totals are about equally likely to be near normal (35% chance) or below normal (40% chance).
- Soil moisture levels and river flows are equally likely to be near normal (40% chance) or below normal (40% chance).
The full probability breakdown is:
|
Temperature |
Rainfall |
Soil moisture |
River flows |
|
|
Above average |
45 |
25 |
20 |
20 |
|
Near average |
40 |
35 |
40 |
40 |
|
Below average |
15 |
40 |
40 |
40 |
Tasman, Nelson, Marlborough, Buller
Probabilities are assigned in three categories: above average, near average, and below average.
- Temperatures are equally likely to be near average (40% chance) or above average (40% chance).
- Rainfall totals are about equally likely to be near normal (40% chance) or below normal (35% chance).
- Soil moisture levels and river flows are about equally likely to be near normal (40% chance) or below normal (35% chance).
The full probability breakdown is:
|
Temperature |
Rainfall |
Soil moisture |
River flows |
|
|
Above average |
40 |
25 |
25 |
25 |
|
Near average |
40 |
40 |
40 |
40 |
|
Below average |
20 |
35 |
35 |
35 |
West Coast, Alps and foothills, inland Otago, Southland
Probabilities are assigned in three categories: above average, near average, and below average.
- Temperatures are most likely to be near average (45% chance).
- Rainfall totals are most likely to be near normal (45% chance).
- Soil moisture levels and river flows are most likely to be near normal (40% chance).
The full probability breakdown is:
|
Temperature |
Rainfall |
Soil moisture |
River flows |
|
|
Above average |
30 |
35 |
30 |
30 |
|
Near average |
45 |
45 |
40 |
40 |
|
Below average |
25 |
20 |
30 |
30 |
Coastal Canterbury, east Otago
Probabilities are assigned in three categories: above average, near average, and below average.
- Temperatures are equally likely to be near average (40% chance) or above average (40% chance).
- Rainfall totals are about equally likely to be near normal (35% chance) or below normal (40% chance).
- Soil moisture levels and river flows are equally likely to be near normal (45% chance) or below normal (40% chance).
The full probability breakdown is:
|
Temperature |
Rainfall |
Soil moisture |
River flows |
|
|
Above average |
40 |
25 |
15 |
15 |
|
Near average |
40 |
35 |
45 |
45 |
|
Below average |
20 |
40 |
40 |
40 |
Graphical representation of the regional probabilities
Background
The NINO3.4 Index anomaly (in the central Pacific) for April 2020 (to the 26th) was +0.54˚C (on the El Niño side of neutral). The NINO4 region also continued on the El Niño side of neutral with an anomaly of +0.50˚C. The NINO1+2 Index anomaly was +0.33˚C.
During April, upper-oceanic heat content continued to decrease across the equatorial Pacific. This is the first time in at least a year that heat content was below average in the vicinity of the International Dateline. Heat content was slightly above average in the eastern part of the basin, closer to South America.
Trade winds during April were slightly stronger than normal along the equator. This pattern is expected to continue over the next 1-2 months, most likely leading to continued cooling in the west-central Pacific (NINO4 in particular).
In the subsurface ocean, cooler than average temperatures extended across the Pacific below 50 m depth and were buffered by a slightly warmer layer above. While there is no immediate indication that these cooler seas will surface, it lends credence to the idea that oceanic La Niña conditions might arrive later in the year as some models suggest.
According to the consensus from international models, ENSO-neutral conditions are very likely (76% chance) for the May–July period.
For the August–October and November–January periods respectively, the probability for ENSO-neutral conditions is 50% and 40% with the probability for La Niña increasing to 30% by late 2020.
During March, New Zealand’s coastal water temperatures were near average for the time of year. Coastal SSTs are not expected to be a significant driver over New Zealand’s climate over the next three months.
New Zealand Coastal Sea Surface Temperatures during April 2020 (to the 26th):
|
North NI |
West NI |
East NI |
North SI |
West SI |
East SI |
|
-0.09˚C |
-0.23˚C |
-0.03˚C |
-0.13˚C |
+0.22˚C |
-0.07˚C |
The Southern Annular Mode (SAM) was negative for most of April. Indications are that the SAM will largely remain negative during May and be associated with several troughs of low pressure in the Tasman Sea and Southern Ocean, particularly during the first and third week of the month. These features will cause rain and wind across New Zealand and will be followed by below average temperatures.
The Madden Julian Oscillation (MJO) was weakly active across many parts of the global tropics during April. The quick-moving and relatively weak signature of the MJO was due in-part to ENSO neutral conditions.
Over the next three months, the tropical north Pacific, Atlantic Ocean, Africa, and western Indian Ocean look to be convectively active (phases 8-1-2) while the western Pacific Ocean looks convectively suppressed, with the latter potentially influencing a lack of moist northerly flows for NZ.
During June and July in particular, phases 8-1-2 are associated with below normal rainfall for large swaths of the country. June temperatures were above average during these phases, while phase 8 during May historically featured below average temperatures (this is expected in early May 2020). July temperatures were historically nearer to average during the same phases.
Warmer than average ocean temperatures continue to build in the eastern Indian Ocean and several models are keen on the development of a negative Indian Ocean Dipole during the winter season. While this is not expected to have an immediate influence on New Zealand’s weather patterns, some influence is possible later in the year.
Forecast Confidence
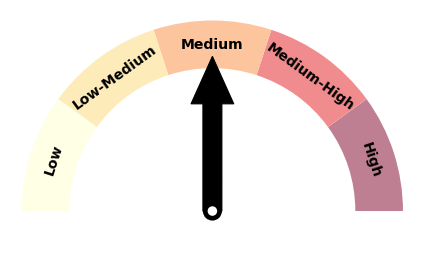
Temperature
|
Forecast confidence for temperature is medium. Although a colder than average three month period is the least likely outcome, cold snaps from the southwest will occur from time to time. Model guidance is largely split between average and above average temperatures for the period as a whole. |
Rainfall
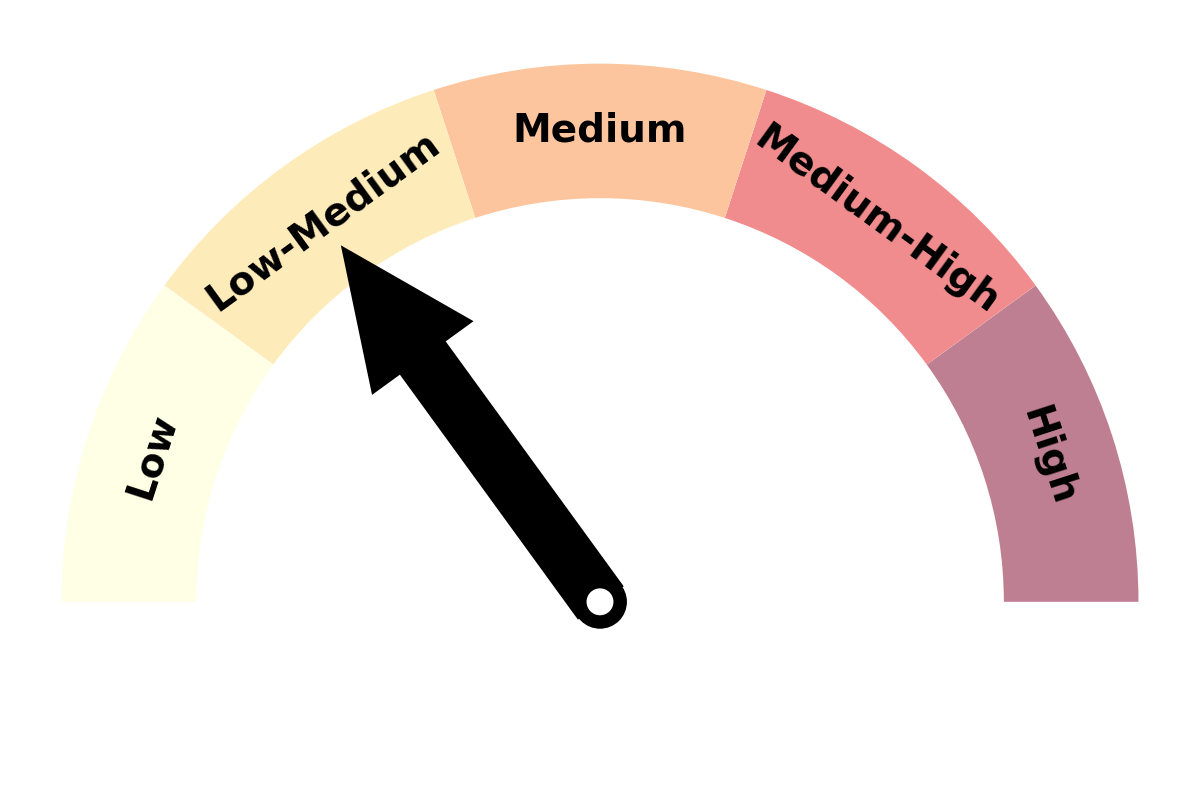
|
Forecast confidence for rainfall is low to medium. The lack of strong climate drivers (e.g. ENSO-neutral) continues to limit predictability. There is also a large amount of model spread. Based on atmospheric patterns, however, there is relatively high confidence in a westerly quarter air flow anomaly, which means that western areas of the country will be more exposed to fronts (and rainfall) through the three month period. |
