Outlook Summary
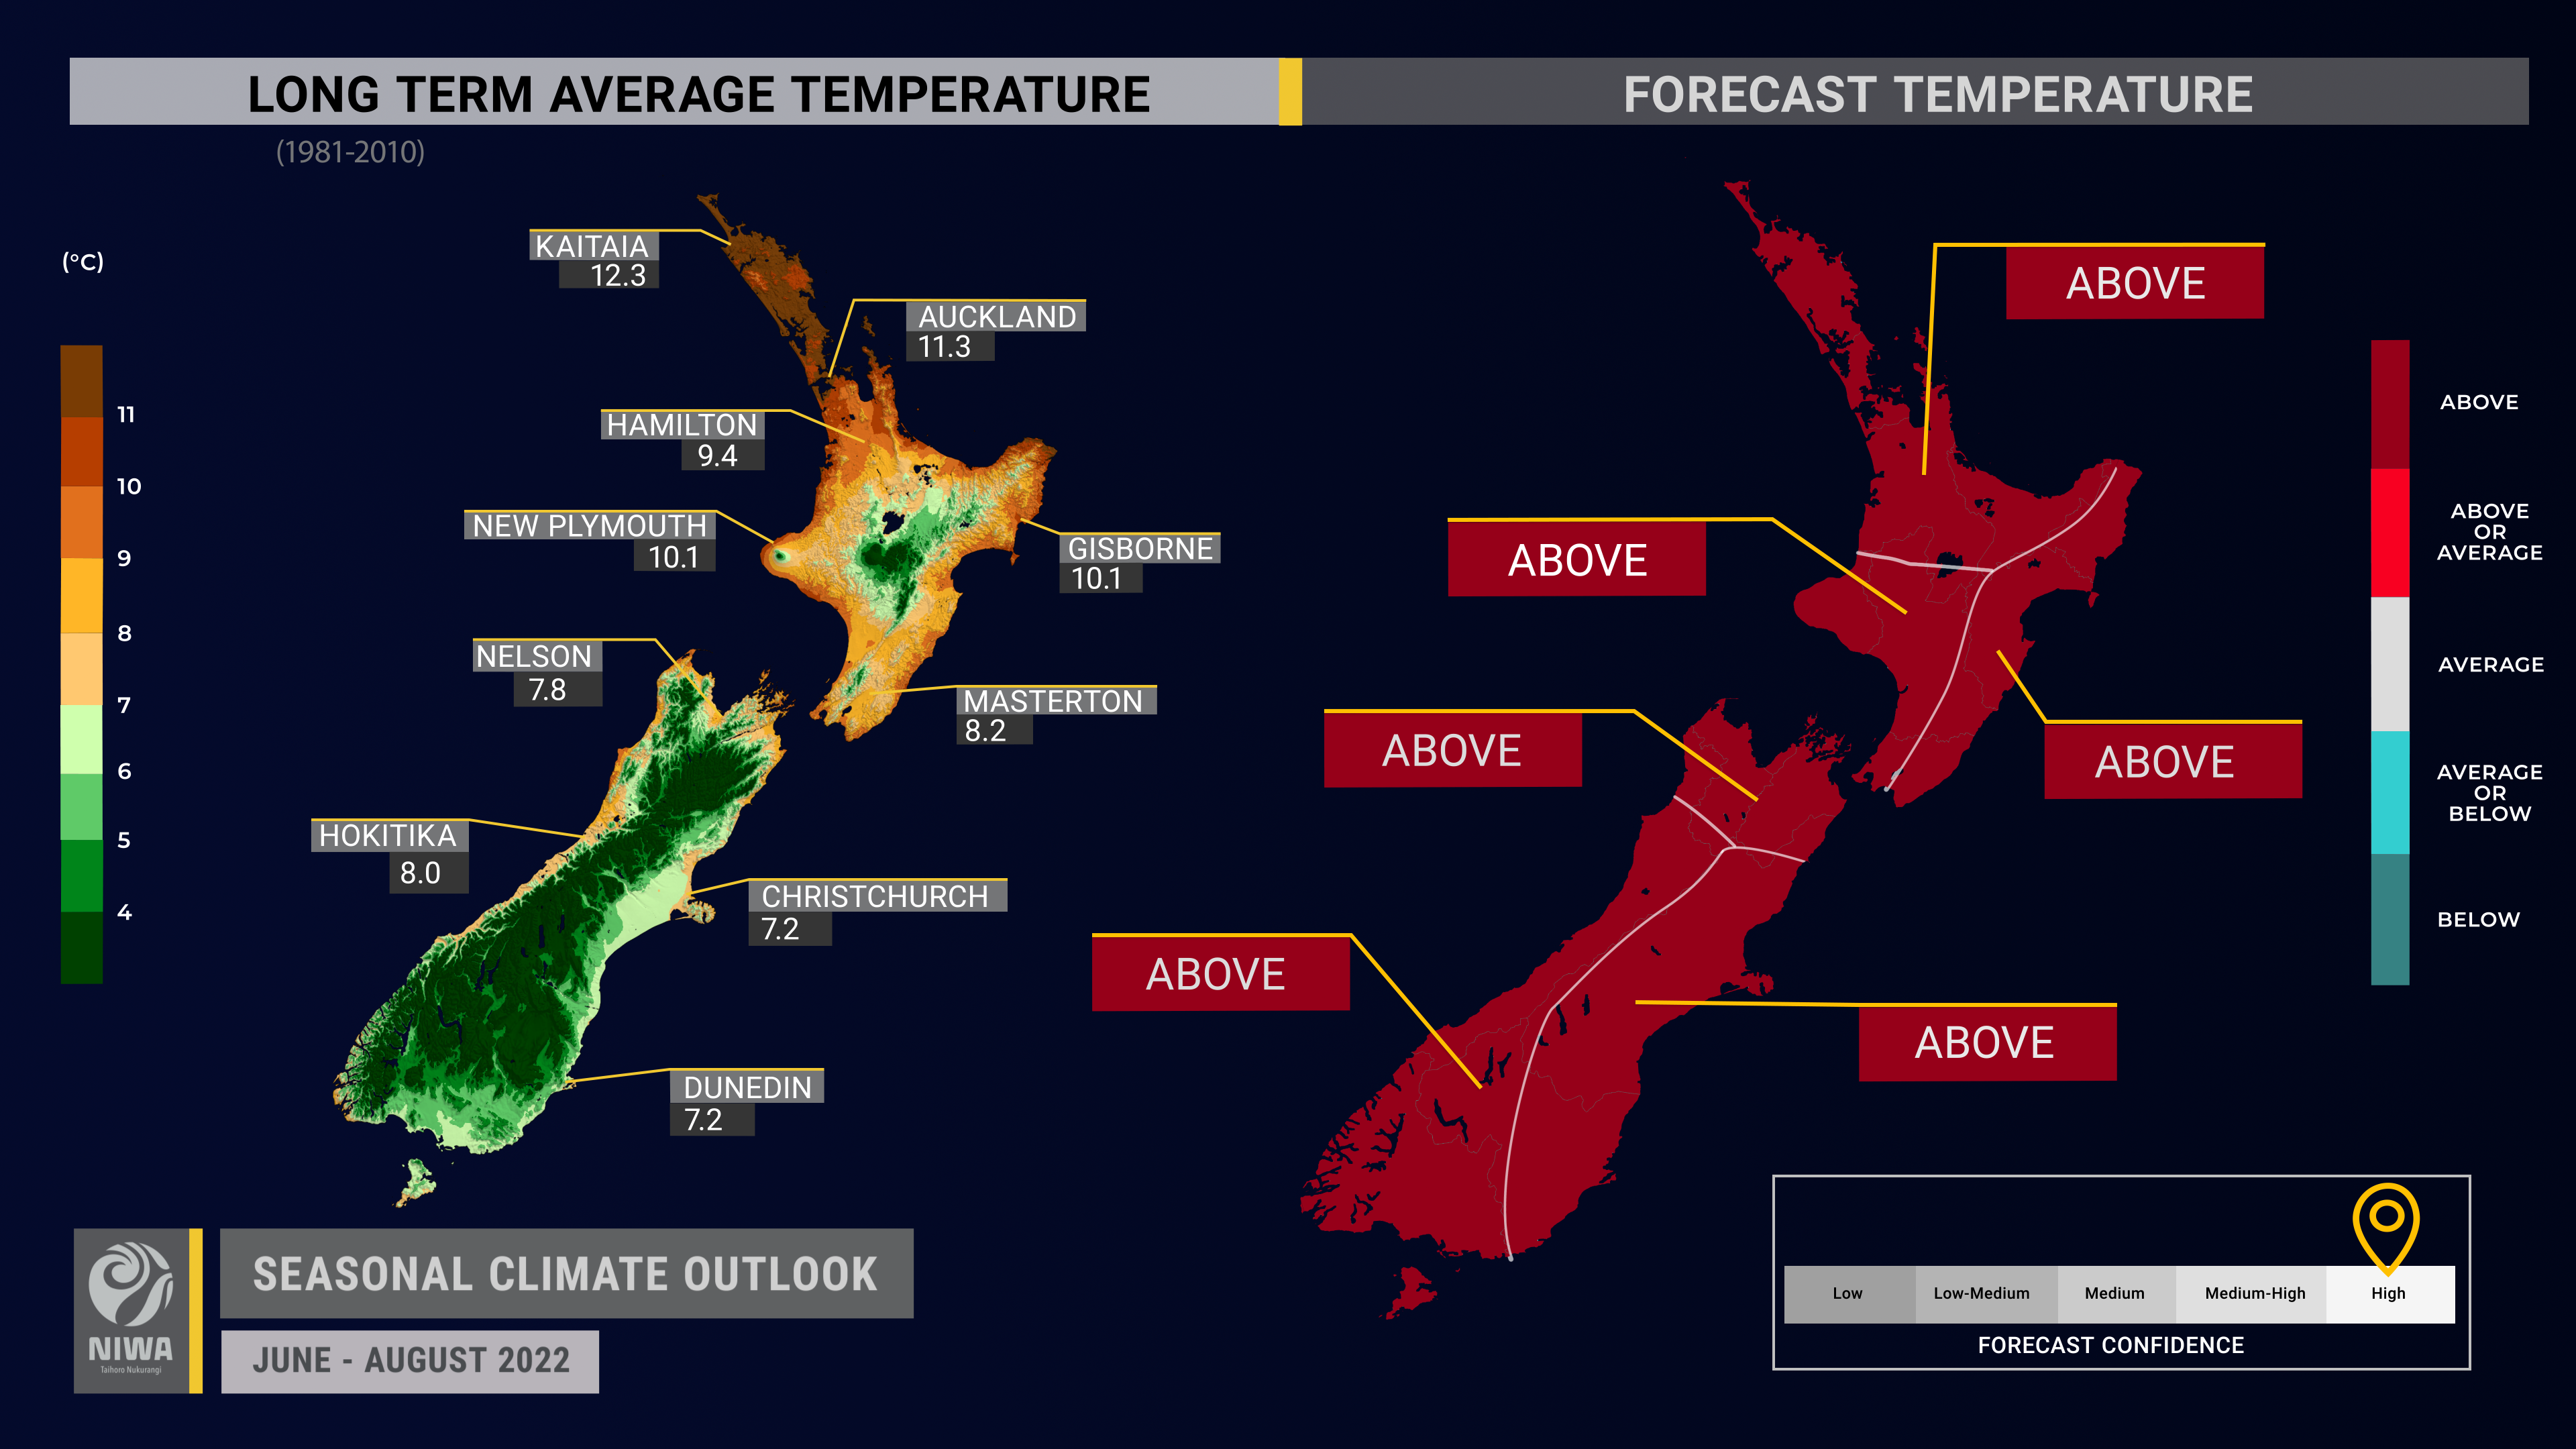
- Winter temperatures are likely to be warmer than average across Aotearoa New Zealand. This owes to an expected lack of southerly quarter winds, warmer than average sea surface temperatures, and a continuation of La Niña for at least part of the season. Cold snaps and frosts will occur, such as during mid-June, but their duration and/or frequency may be less than normal.
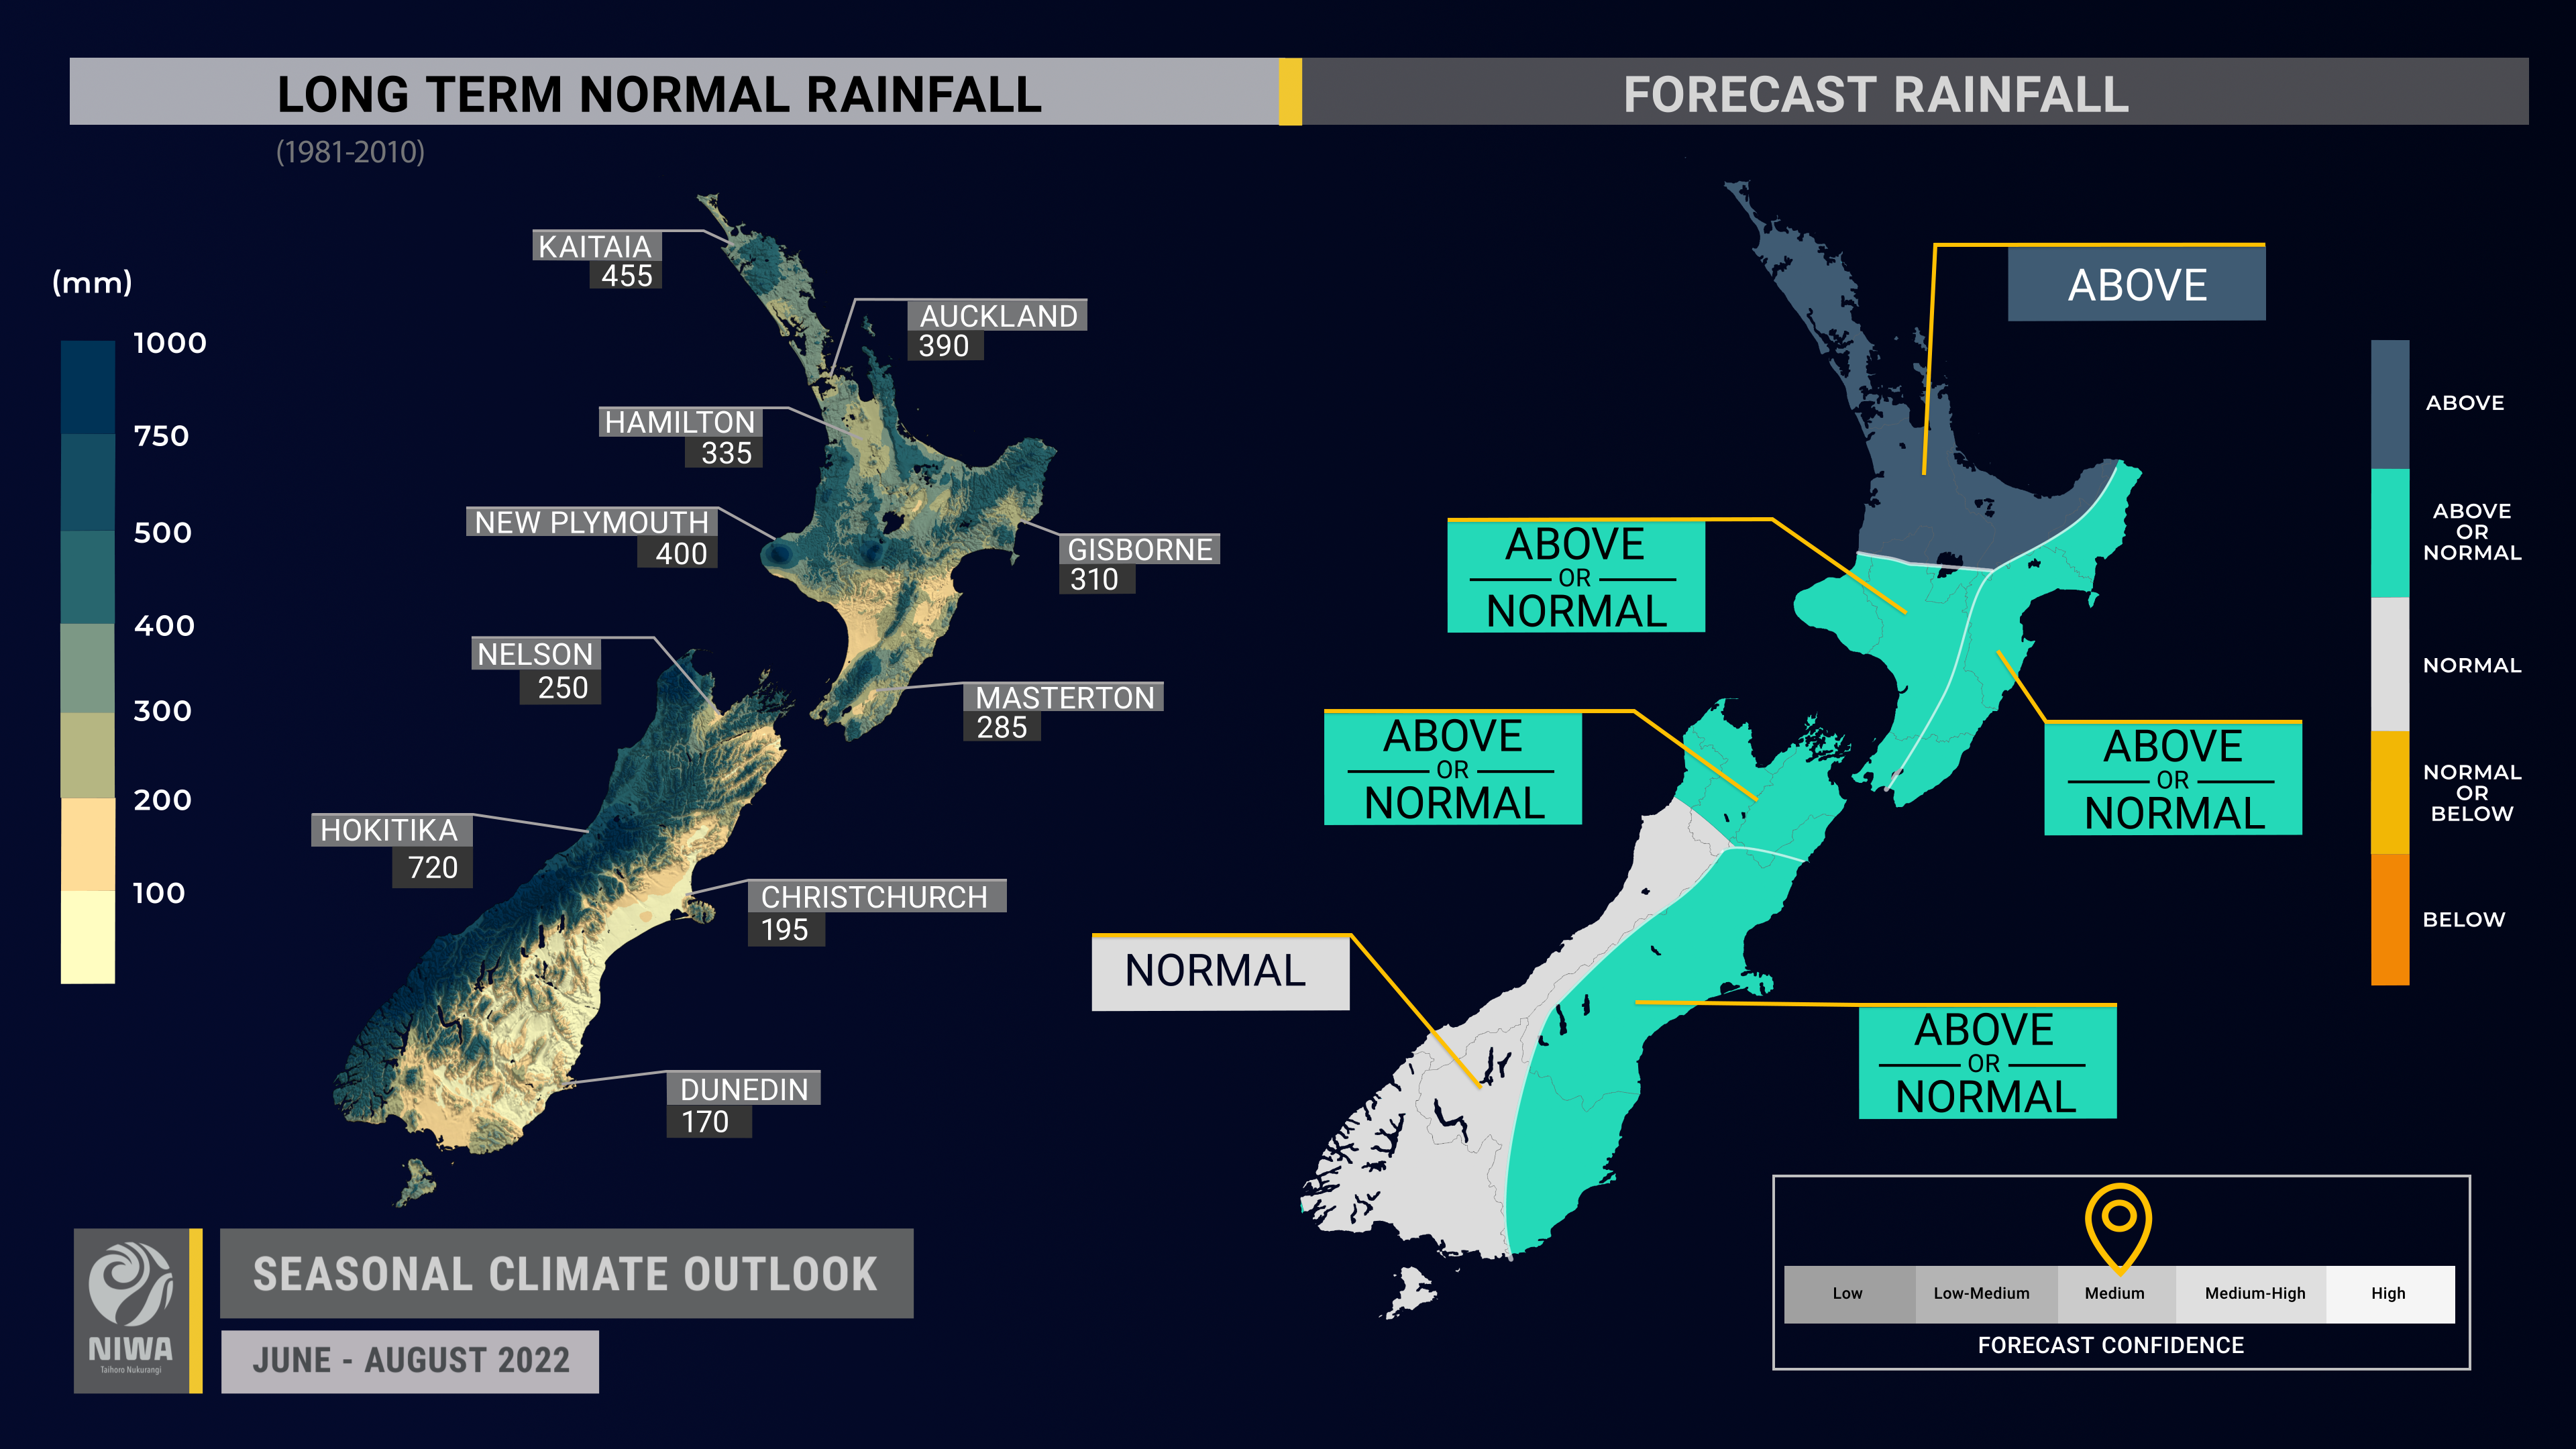
- Winter rainfall is most likely to be above normal in the north of the North Island and near normal in the west of the South Island. Near normal or above normal seasonal rainfall is about equally likely in all other regions. More frequent low pressure systems in the Tasman Sea may direct plumes of sub-tropical moisture and humid air toward the country at times, causing heavy rainfall and potential flooding.
- Winter air pressure is forecast to be lower than normal to the west of New Zealand and higher than normal to the east. This is expected to be associated with mixed northeasterly and westerly quarter air flow anomalies.
- The atmospheric imprint of La Niña continues to be strong; the Southern Oscillation Index (SOI) during May was the 2nd-highest May value on record since at least 1876.
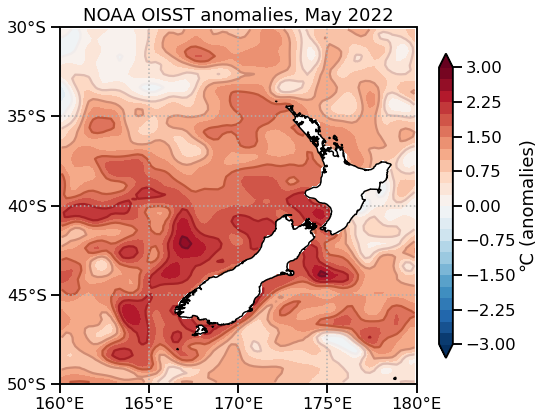
- Around the country, sea surface temperatures (SSTs) ranged from 0.5˚C to 2.0˚C above average during May.
- Soil moisture levels are most likely to be above normal in the North Island, near normal in the east of the South Island, about equally likely to be near normal or above normal in the north of the South Island, and about equally likely to be below normal or near normal in the west of the South Island.
- River flows are most likely to be above normal in the north of the North Island, near normal in the north and east of the South Island, equally likely to be near normal or above normal in the west and east of the North Island, and equally likely to be near normal or below normal in the west of the South Island.
Regional predictions for June – August 2022
Northland, Auckland, Waikato, Bay of Plenty
The table below shows the probabilities (or percent chances) for each of three categories: above average, near average, and below average. In the absence of any forecast guidance there would be an equal likelihood (33% chance) of the outcome being in any one of the three categories. Forecast information from local and global guidance models is used to indicate the deviation from equal chance expected for the coming three-month period, with the following outcomes the most likely (but not certain) for this region:
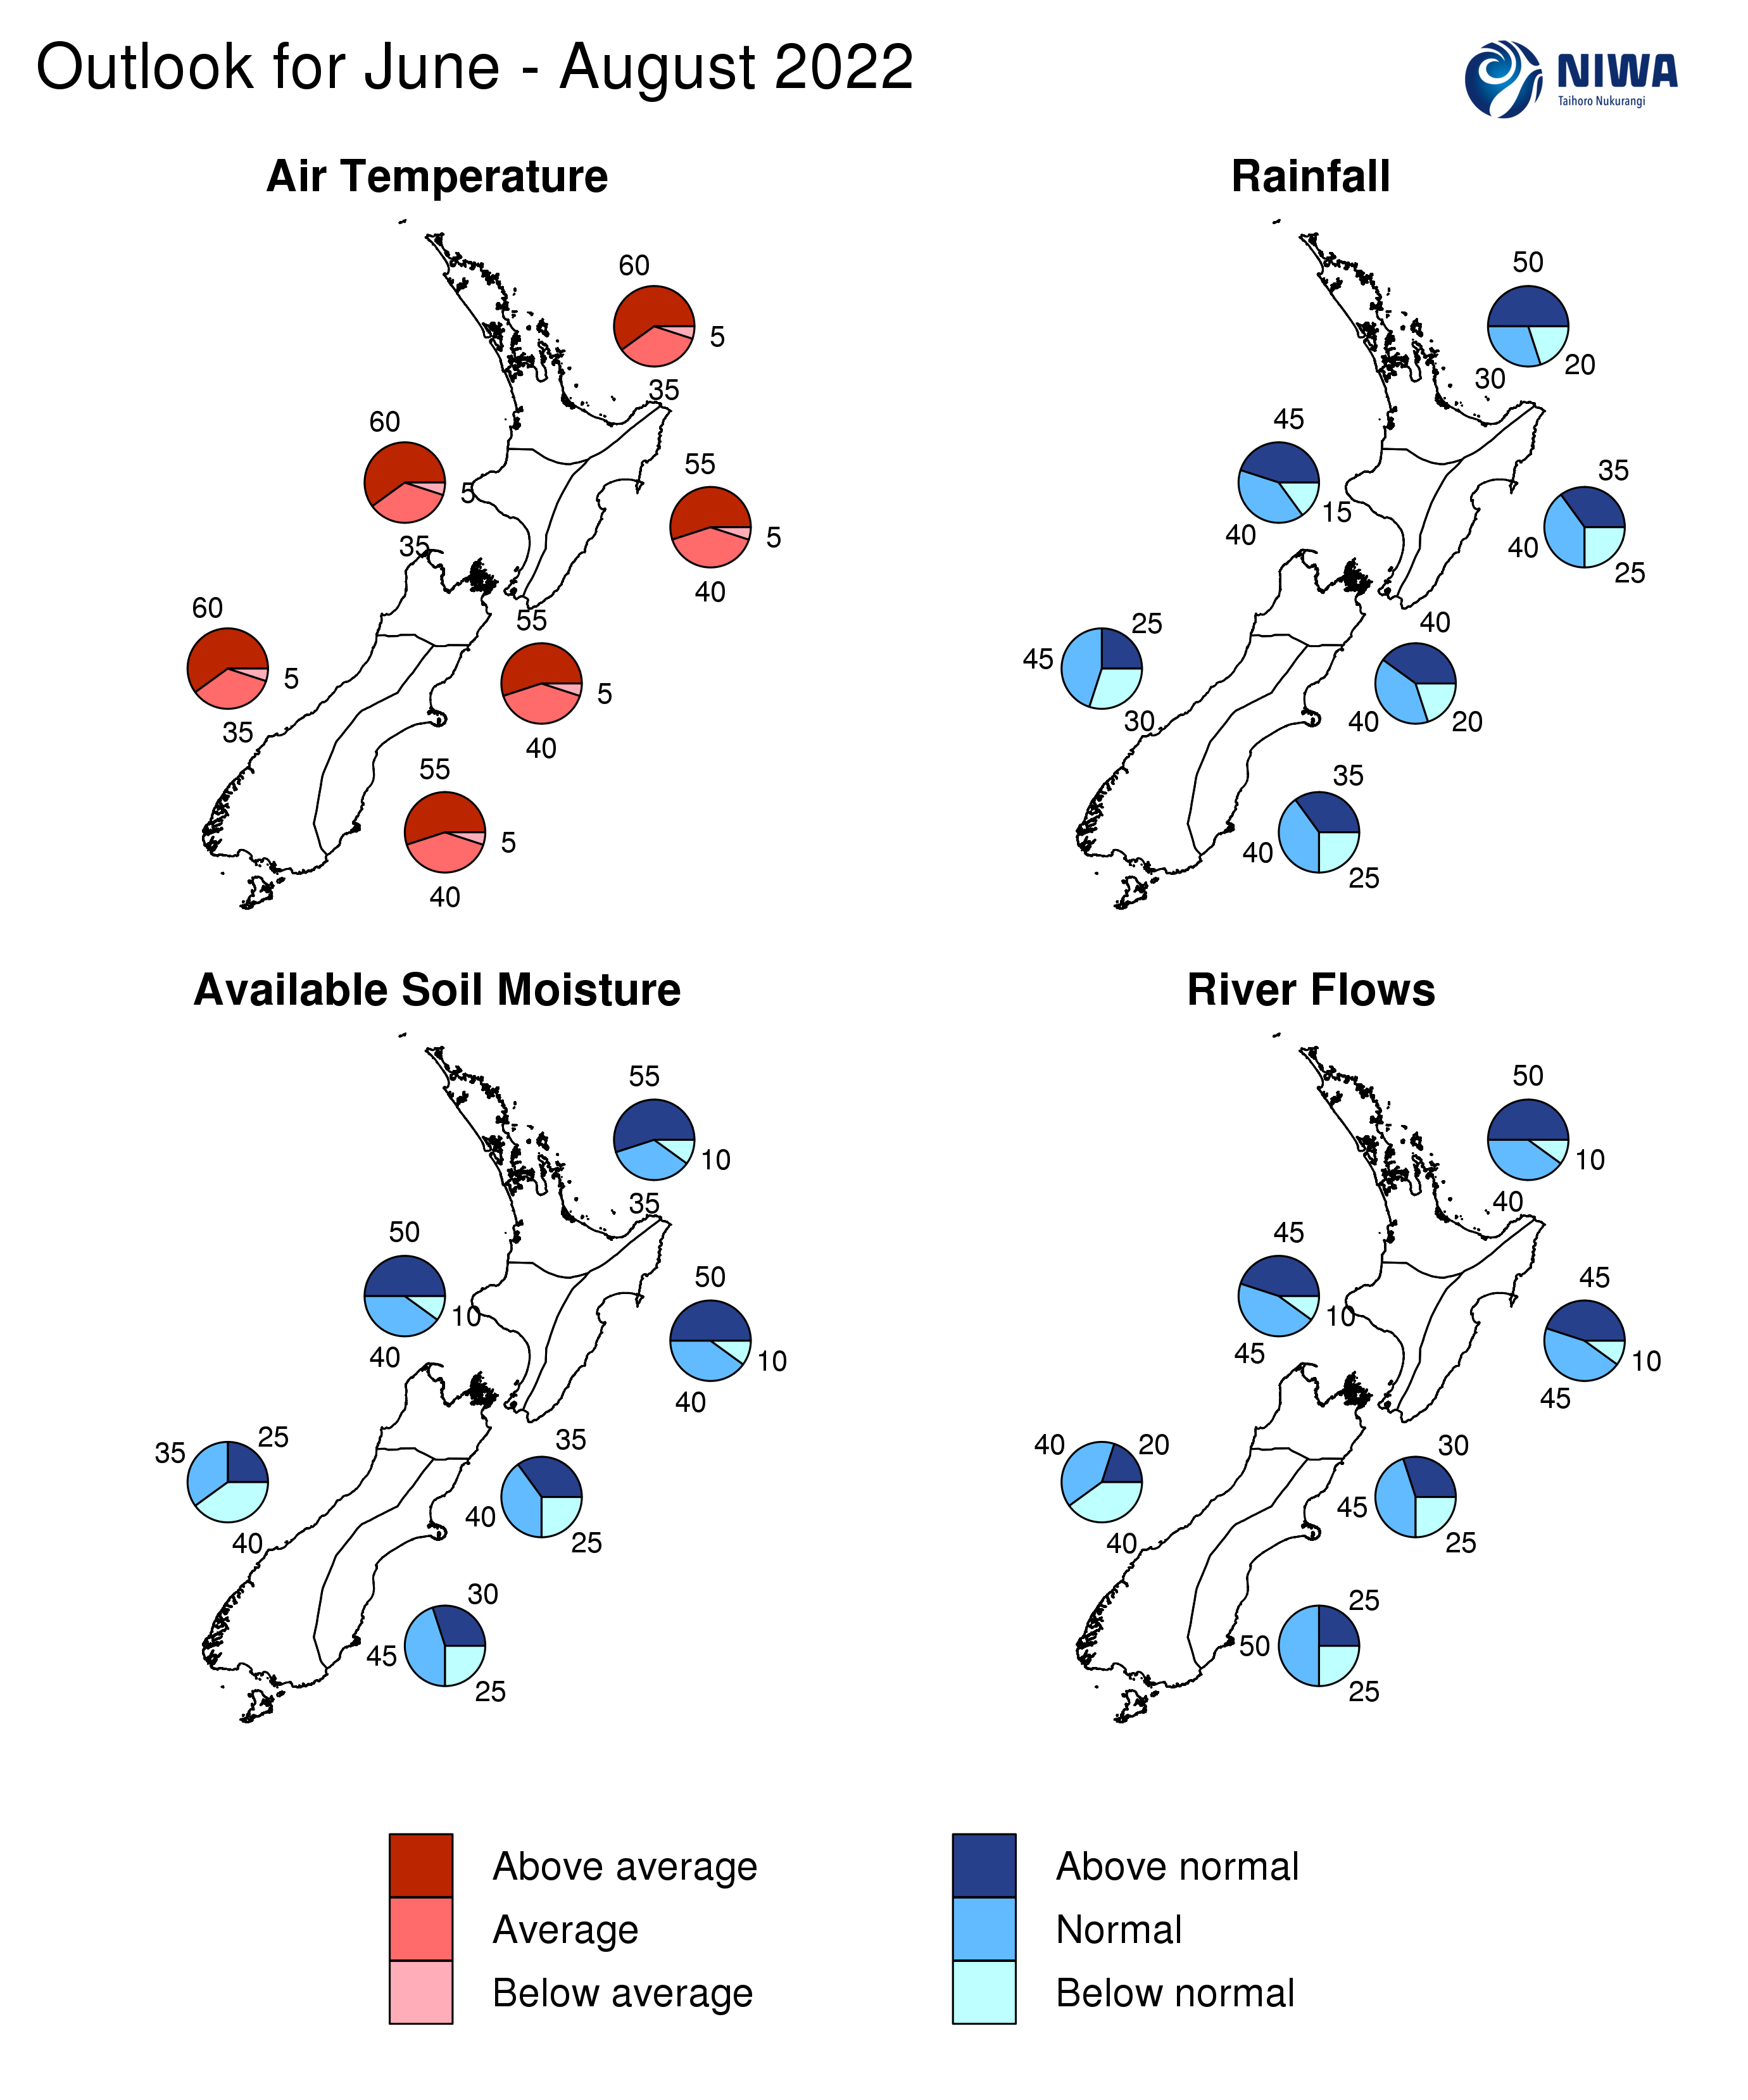
- Temperatures are very likely to be above average (60% chance). A predicted lack of southerly winds and warmer than average coastal seas will likely reduce the frequency and intensity of cold spells, although a colder than average period is likely in mid-June.
- Rainfall totals are most likely to be above normal (50% chance). Plumes of sub-tropical moisture will cause heavy rainfall and increase the chance for flooding at times.
- Soil moisture levels and river flows are most likely to be above normal (50-55% chance).
The full probability breakdown is:
|
Temperature |
Rainfall |
Soil moisture |
River flows | |
|
Above average |
60 |
50 |
55 |
50 |
|
Near average |
35 |
30 |
35 |
40 |
|
Below average |
05 |
20 |
10 |
10 |
Central North Island, Taranaki, Whanganui, Manawatu, Wellington
Probabilities are assigned in three categories: above average, near average, and below average.
- Temperatures are very likely to be above average (60% chance). A predicted lack of southerly winds and warmer than average coastal seas will likely reduce the frequency and intensity of cold spells, although a colder than average period is likely in mid-June.
- Rainfall is about equally likely to be above normal (45% chance) or near normal (40% chance). Plumes of sub-tropical moisture will cause heavy rainfall and increase the chance for flooding at times.
- Soil moisture levels are most likely to be above normal (50% chance) while river flows are equally likely to be near normal (45% chance) or above normal (45% chance).
The full probability breakdown is:
|
Temperature |
Rainfall |
Soil moisture |
River flows | |
|
Above average |
60 |
45 |
50 |
45 |
|
Near average |
35 |
40 |
40 |
45 |
|
Below average |
05 |
15 |
10 |
10 |
Gisborne, Hawke’s Bay, Wairarapa
Probabilities are assigned in three categories: above average, near average, and below average.
- Temperatures are most likely to be above average (55% chance). A predicted lack of southerly winds will likely reduce the frequency of cold spells, although a colder than average period is likely in mid-June.
- Rainfall totals are about equally likely to be near normal (40% chance) or above normal (35% chance). Seasonal rainfall patterns may be irregular with longer dry spells interspersed with heavy rainfall events, the latter possible during July.
- Soil moisture levels are most likely to be above normal (50% chance) while river flows are equally likely to be near normal (45% chance) or above normal (45% chance).
The full probability breakdown is:
|
Temperature |
Rainfall |
Soil moisture |
River flows | |
|
Above average |
55 |
35 |
50 |
45 |
|
Near average |
40 |
40 |
40 |
45 |
|
Below average |
05 |
25 |
10 |
10 |
Tasman, Nelson, Marlborough, Buller
Probabilities are assigned in three categories: above average, near average, and below average.
- Temperatures are most likely to be above average (55% chance). A predicted lack of southerly winds and warmer than average coastal seas will likely reduce the frequency and intensity of cold spells, although a colder than average period is likely in mid-June.
- Rainfall is equally likely to be near normal (40% chance) or above normal (40% chance). Plumes of sub-tropical moisture will cause heavy rainfall and increase the chance for flooding at times.
- Soil moisture levels are about equally likely to be near normal (40% chance) or above normal (35% chance) while river flows are most likely to be near normal (45% chance).
The full probability breakdown is:
|
Temperature |
Rainfall |
Soil moisture |
River flows | |
|
Above average |
55 |
40 |
35 |
30 |
|
Near average |
40 |
40 |
40 |
45 |
|
Below average |
05 |
20 |
25 |
25 |
West Coast, Alps and foothills, inland Otago, Southland
Probabilities are assigned in three categories: above average, near average, and below average.
- Temperatures are very likely to be above average (60% chance). A predicted lack of southerly winds and warmer than average coastal seas will likely reduce the frequency and intensity of cold spells, although a colder than average period is likely in mid-June.
- Rainfall totals are most likely to be near normal (45% chance). Seasonal rainfall patterns may be irregular with longer dry spells interspersed with heavy rainfall events.
- Soil moisture levels and river flows are about equally likely to be below normal (40% chance) or near normal (35-40% chance).
The full probability breakdown is:
|
Temperature |
Rainfall |
Soil moisture |
River flows | |
|
Above average |
60 |
25 |
25 |
20 |
|
Near average |
35 |
45 |
35 |
40 |
|
Below average |
05 |
30 |
40 |
40 |
Coastal Canterbury, east Otago
Probabilities are assigned in three categories: above average, near average, and below average.
- Temperatures are most likely to be above average (55% chance). A predicted lack of southerly winds and warmer than average coastal seas will likely reduce the frequency and intensity of cold spells, although a colder than average period is likely in mid-June.
- Rainfall is about equally likely to be near normal (40% chance) or above normal (35% chance). Seasonal rainfall patterns may be irregular with longer dry spells interspersed with heavy rainfall events, the latter possible during July.
- Soil moisture levels and river flows are most likely to be near normal (45-50% chance).
The full probability breakdown is:
|
Temperature |
Rainfall |
Soil moisture |
River flows | |
|
Above average |
55 |
35 |
30 |
25 |
|
Near average |
40 |
40 |
45 |
50 |
|
Below average |
05 |
25 |
25 |
25 |
Graphical representation of the regional probabilities
Background
The NINO3.4 Index anomaly (in the central Pacific) over the last month (through 29 May) was -0.71˚C, near the La Niña threshold. The provisional May monthly SOI was +2.0, the 2nd-highest May value on record since at least 1876 (only May 1917 was higher). This suggests that La Niña continues to influence global atmospheric patterns.
In the subsurface equatorial Pacific, warmer than average water was pushing across the western and central part of the basin at 100-150 m depth. Spurred by a downwelling oceanic Kelvin Wave, these warmer waters could surface in the eastern Pacific in mid-winter. Meanwhile, cooler than average waters continued from the surface to 75 m depth in the central Pacific, reflective of the ongoing La Niña. These signatures were reflected in upper-oceanic heat content (OHC). During May, OHC decreased in the eastern equatorial Pacific and increased slightly in the central part of the basin.
Trade winds across the equatorial Pacific were stronger than normal during May, except for a corridor in the north-east, west of Central America, which was similar to April. A period of reduced trades is expected in early June, followed by a re-enhancement of trades from mid-month. The latter may induce a cooling effect in the central Pacific Ocean during mid-winter.
Taking these factors into account, La Niña conditions are favoured to continue during June-August (60% chance, an increase of 13% compared to last month). During spring, there is around a 55% chance for La Niña and a 40% chance for ENSO neutral. During summer, La Niña is favoured at around 50%. Should La Niña persist through or redevelop by summer 2022-23, the current event would qualify as a “triple-dip”. Since 1900, using an Oceanic Niño threshold of -0.5 from December-February (relative to the 1981-2010 average), the following would qualify as “triple-dip” events: 1998-2000, 1983-1985, 1973-1975, and 1908-1910.
A sea surface temperature seesaw in the Indian Ocean, called the Indian Ocean Dipole (IOD), was trending negative as of late May. The negative phase of the IOD is associated with warmer than average seas in the eastern Indian Ocean near Sumatra and colder than average seas in the western Indian Ocean near Somalia. There is a consensus for a moderate-to-strong negative IOD event to develop during winter and last through spring. This may be associated with heavier rainfall events in northern and eastern New Zealand as the IOD signal becomes superimposed with a La Niña-like base state.
During May, convective forcing was dominated by two high frequency Madden-Julian Oscillation (MJO)/Kelvin Wave events that moved from the Indian Ocean, across the Maritime Continent, and into the Pacific. At the end of the month, the second MJO pulse was traversing the Pacific and was forecast to stand over the eastern Pacific and Americas during the first half of June. This is expected to destructively interfere with La Niña, causing weaker equatorial trade winds and a possible warming of SSTs in the equatorial Pacific. This pattern has historically been associated with more westerly winds and wetter conditions in western parts of New Zealand.
During mid-to-late June, tropical forcing is forecast to migrate eastward, passing over Africa and into the Indian Ocean. A temporary spell of drier conditions is possible in mid-to-late June, before a redevelopment of moist west-to-northwest winds late in the month (MJO phases 3-4). These phases have also been associated with warmer than average temperatures for much of the country.
Maritime Continent and western Pacific forcing (MJO phases 4-6) are indicated for the first half of July. These may result in a relatively warmer North Island and cooler South Island with more easterly-quarter winds and wetter conditions in the north and east of both islands.
The Southern Annular Mode (SAM) was in its positive phase for the first three weeks of May before turning negative. The negative phase of the SAM is favoured during the first half of June with frequent low pressure systems in the New Zealand region, but a positive trend is possible in the mid-to-later part of the month.
New Zealand’s coastal water temperatures remained above average during May with marine heatwave conditions occurring in all regions except the eastern North Island at the end of the month. Model guidance remains consistent in its expectation for above average sea surface temperatures over the next three to six months, although a decrease in anomaly values looks likely during June due to stronger westerly winds and more frequent low pressure systems. For more information, see the NIWA Sea Surface Temperature Update.
NZ coastal SST anomalies (through 30 May)
|
North NI |
1.37˚C |
|
West NI |
1.92˚C |
|
East NI |
0.48˚C |
|
North SI |
1.96˚C |
|
West SI |
1.85˚C |
|
East SI |
1.87˚C |
Forecast Confidence
Temperature
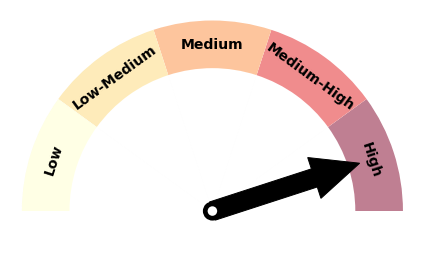
|
Forecast confidence for temperatures is high. The climate models that NIWA surveys are unanimous in their expectation of above average seasonal temperatures. The continuation of La Niña conditions for at least part of the season will encourage more northerly quarter winds with a decided reduction in southerly air flows signalled. The last two winters have been New Zealand’s warmest on record. |
Rainfall
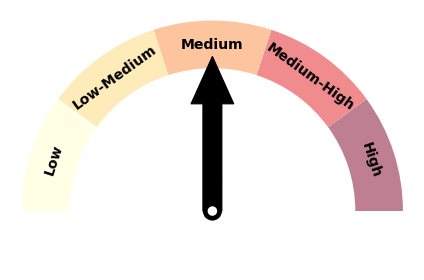
|
Forecast confidence for rainfall is medium. Historical La Niña events were unlikely to be drier than normal in the North Island and the north and west of the South Island. Model guidance is strongly in favour of above normal rainfall for most regions, although in recent seasons, model forecasts have been biased too wet. Periodic heavy rainfall events are likely, which may increase the risk for flooding. |
