Outlook summary
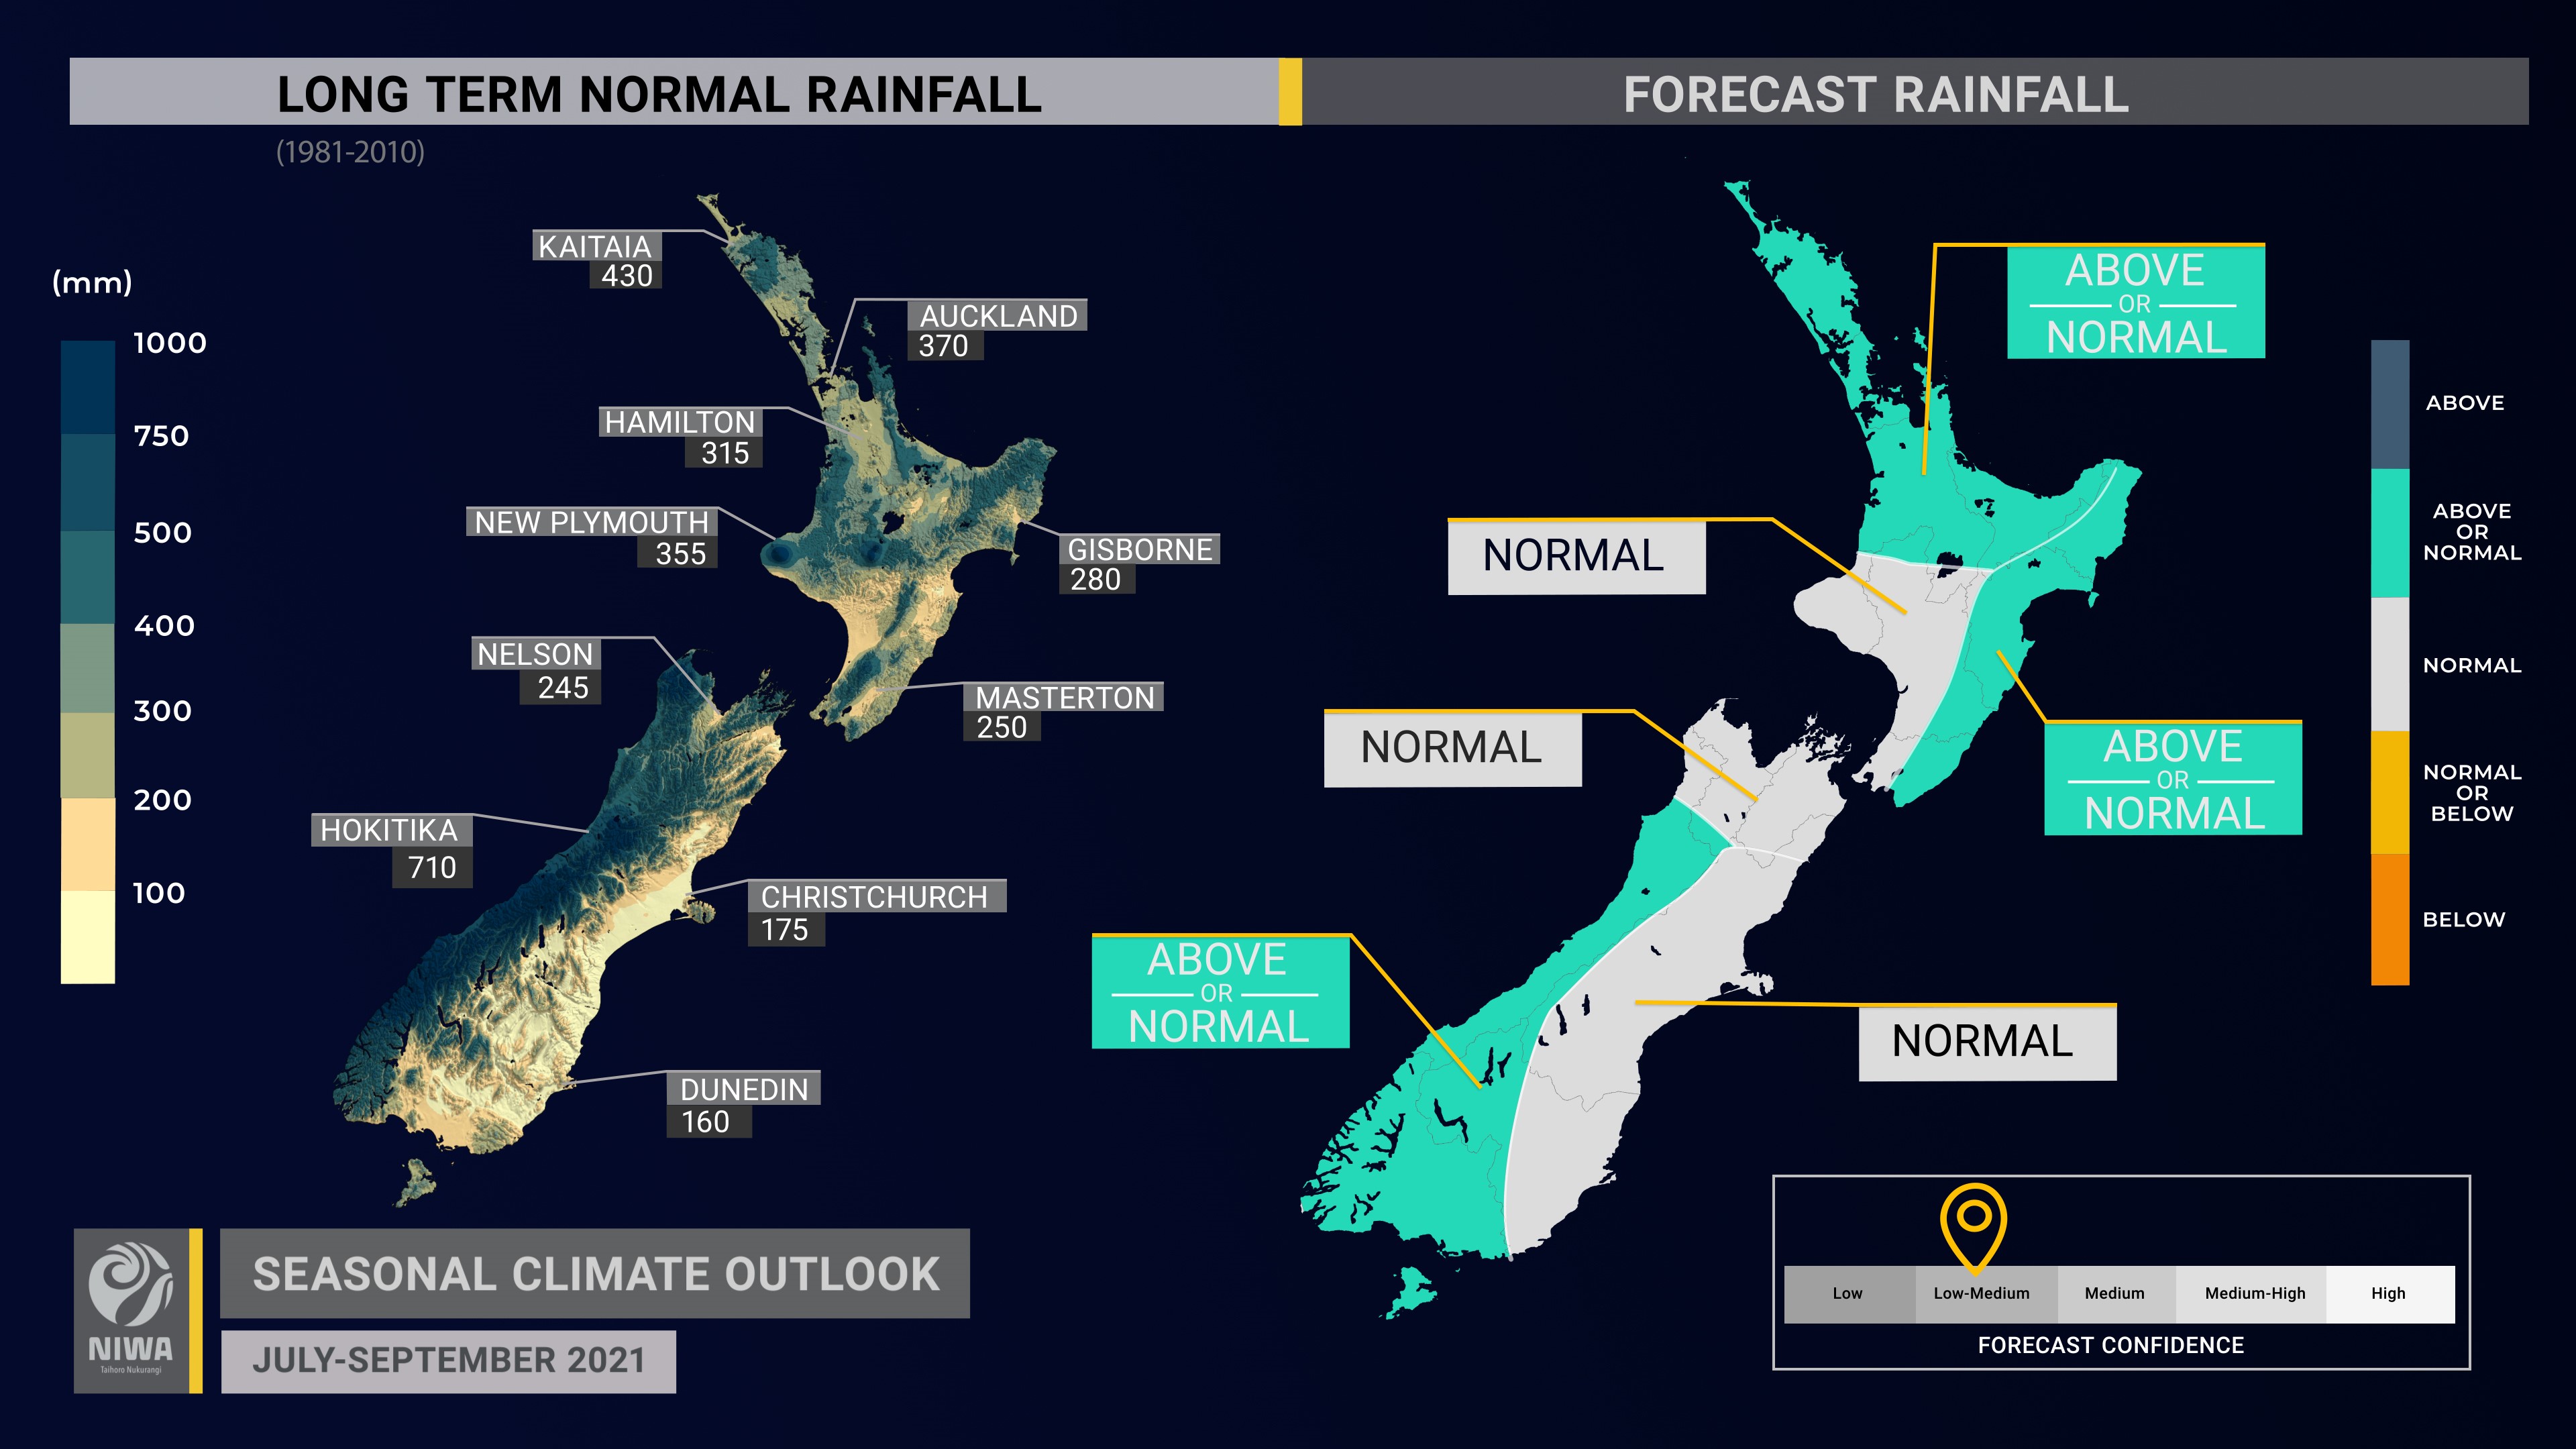
- Rainfall is about equally likely to be near normal or above normal in the north and east of the North Island and west of the South Island. Near normal rainfall is most likely in all other regions.
- Periodic heavy rainfall events remain possible during the coming months, particularly in eastern areas. Some of the heavy rain events could be a result of atmospheric rivers making landfall in New Zealand, similar to the recent Canterbury and Gisborne flooding events. It is not possible to predict specific extreme weather events months in advance, however.
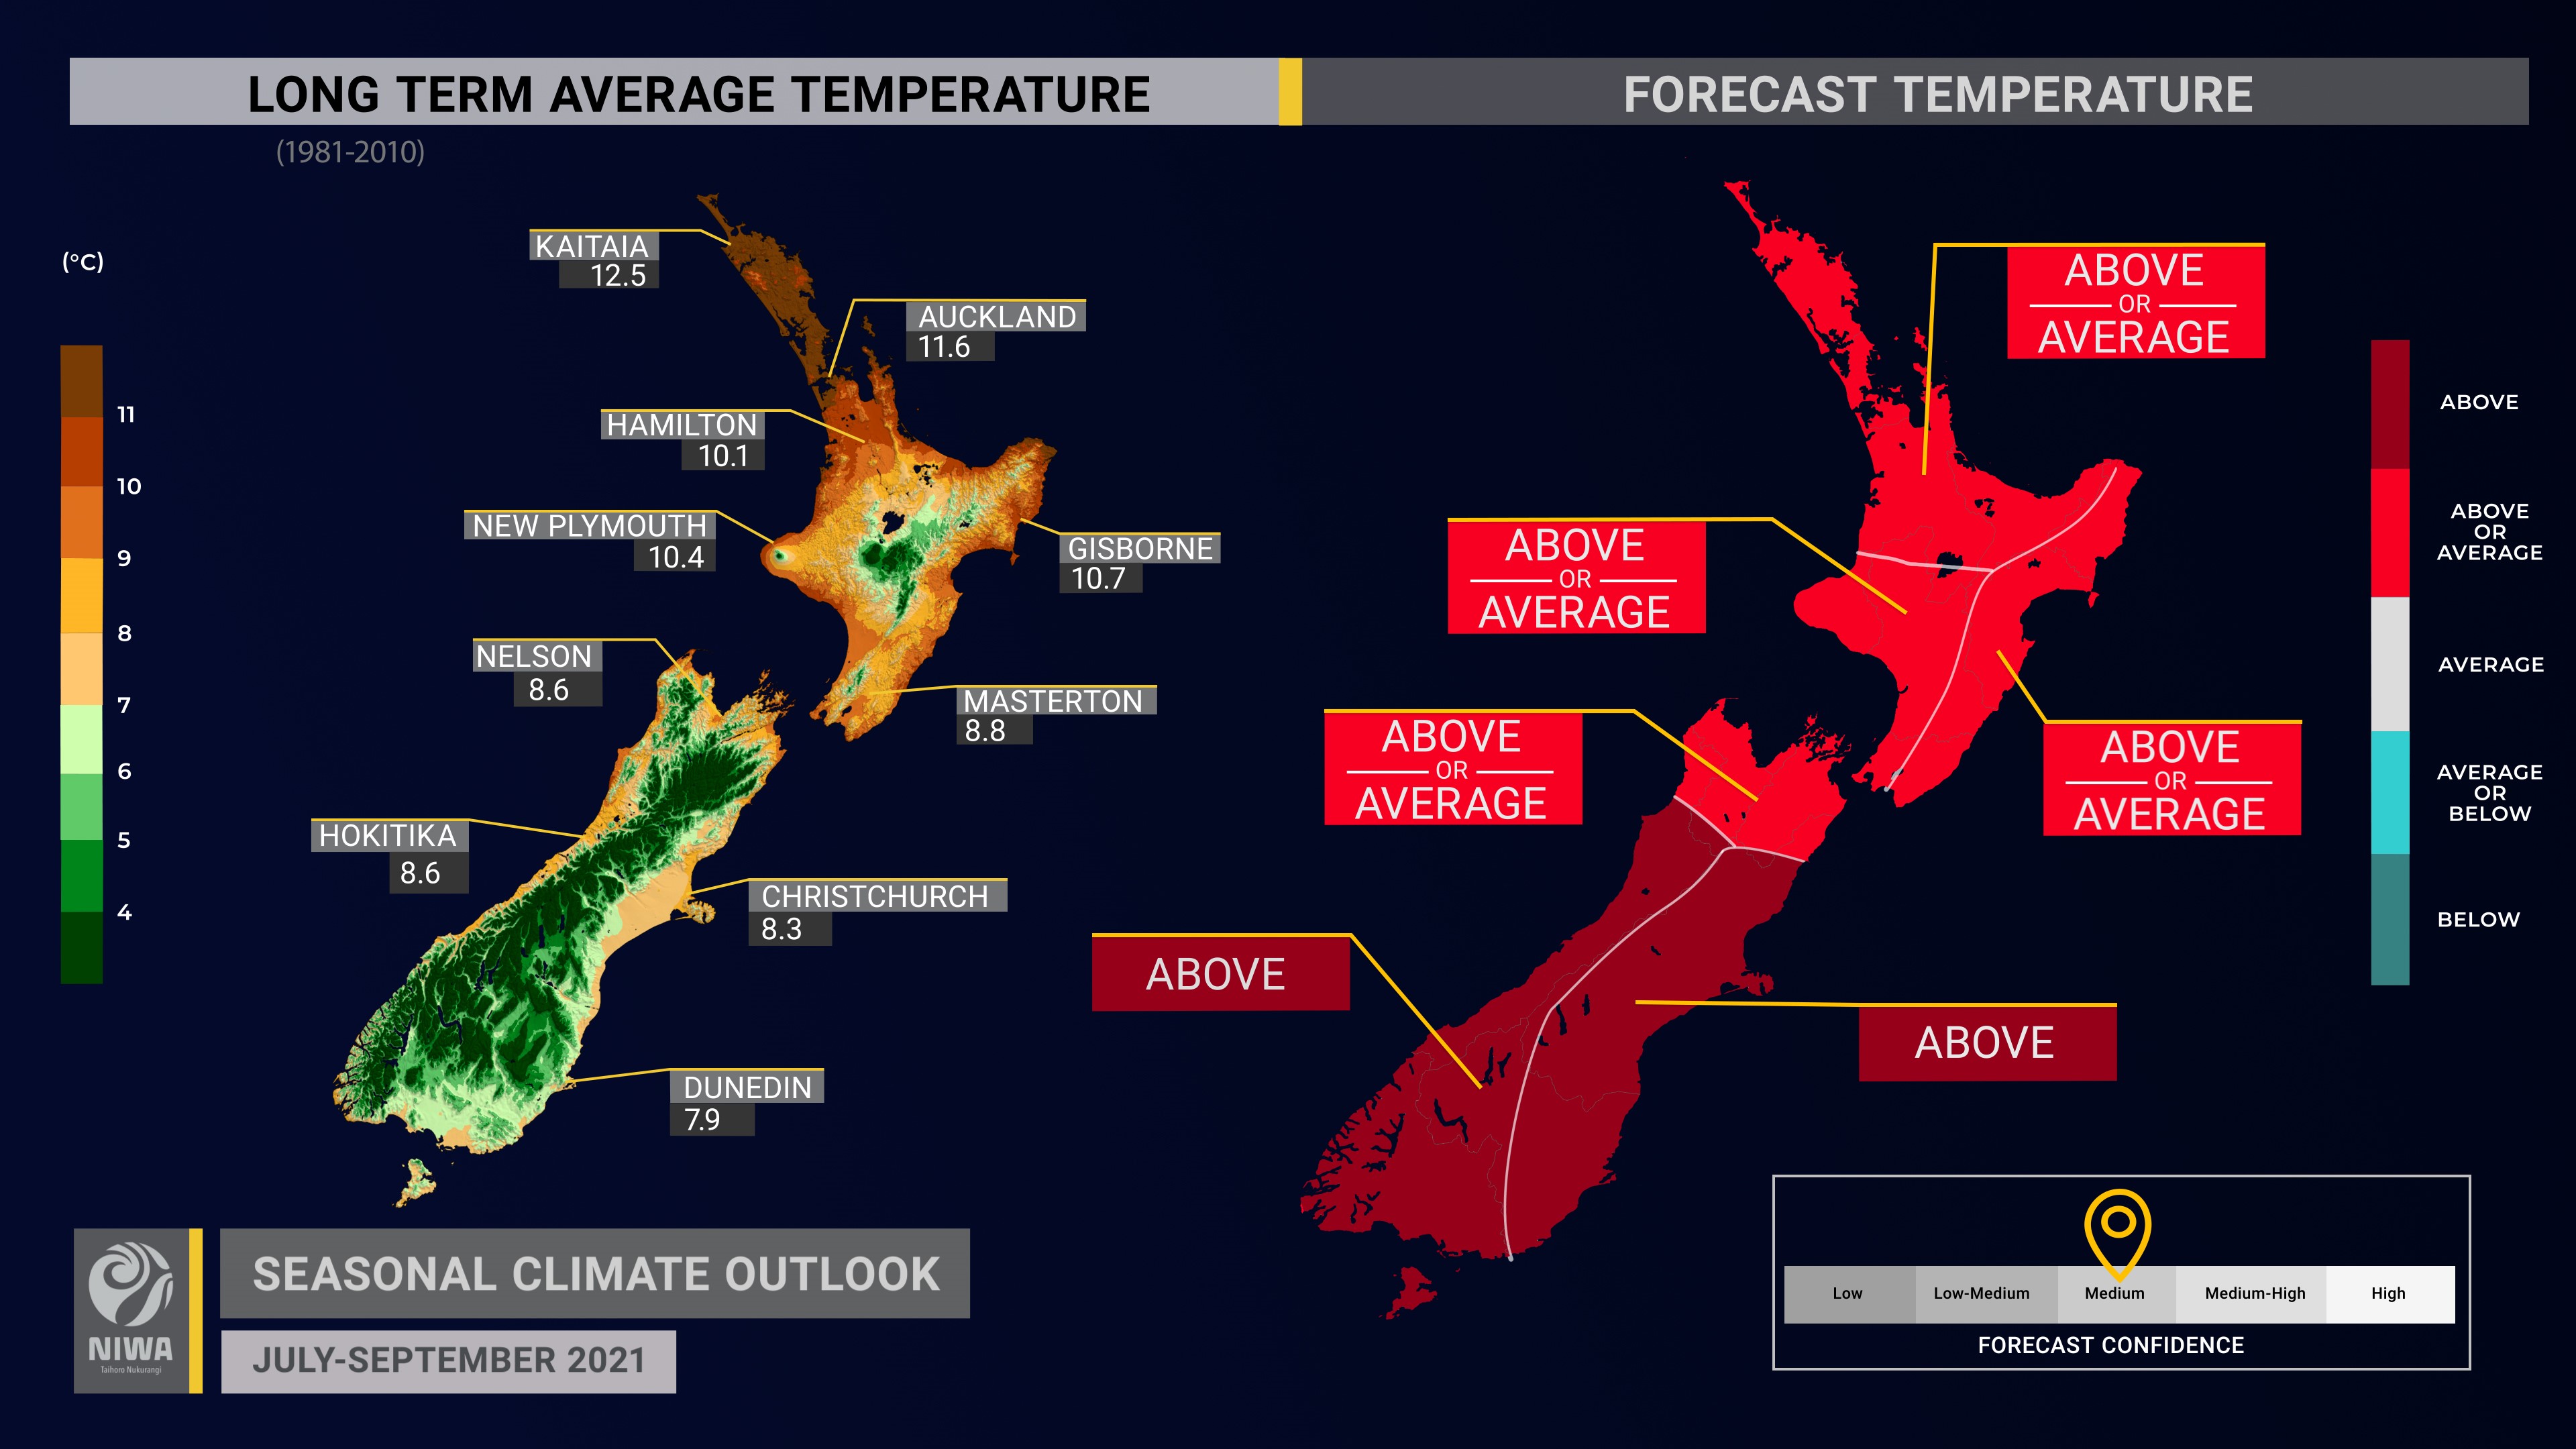
- Temperatures remain very unlikely to be colder than average for the next three months as a whole, although occasional cold snaps and frosts will occur. Above average temperatures are most likely for the east and west of the South Island with about equal chances for above average or near average temperatures elsewhere.
- Air pressure is predicted to be lower than normal in the New Zealand region, particularly to the west of the country. This is expected to be associated with more westerly and northeasterly quarter winds than normal through the season.
- NZ’s weather patterns are expected to feature substantial week-to-week variability over the coming months, owing to an ENSO neutral state in the tropical Pacific Ocean. For more information, see the Background.
- New Zealand’s coastal sea surface temperatures (SSTs) ranged from 0.9˚C to 1.3˚C above average during June and were associated with one of the warmest Junes on record according to NIWA’s seven-station temperature series.
- Soil moisture levels and river flows are equally likely to be near normal or above normal in the east of the South Island and most likely to be near normal in all other regions.
Regional predictions for July – September 2021
Northland, Auckland, Waikato, Bay of Plenty
The table below shows the probabilities (or percent chances) for each of three categories: above average, near average, and below average. In the absence of any forecast guidance there would be an equal likelihood (33% chance) of the outcome being in any one of the three categories. Forecast information from local and global guidance models is used to indicate the deviation from equal chance expected for the coming three-month period, with the following outcomes the most likely (but not certain) for this region:
- Temperatures are about equally likely to be above average (50% chance) or near average (45% chance).
- Rainfall totals are about equally likely to be near normal (40% chance) or above normal (35% chance).
- Soil moisture and river flow levels are most likely to be near normal (40-45% chance).
The full probability breakdown is:
|
Temperature |
Rainfall |
Soil moisture |
River flows |
|
|
Above average |
50 |
35 |
30 |
25 |
|
Near average |
45 |
40 |
40 |
45 |
|
Below average |
05 |
25 |
30 |
30 |
Central North Island, Taranaki, Whanganui, Manawatu, Wellington
Probabilities are assigned in three categories: above average, near average, and below average.
- Temperatures are about equally likely to be above average (50% chance) or near average (45% chance).
- Rainfall totals are most likely to be near normal (45% chance).
- Soil moisture and river flow levels are most likely to be near normal (40-45% chance).
The full probability breakdown is:
|
Temperature |
Rainfall |
Soil moisture |
River flows |
|
|
Above average |
50 |
30 |
25 |
25 |
|
Near average |
45 |
45 |
45 |
45 |
|
Below average |
05 |
25 |
30 |
30 |
Gisborne, Hawke’s Bay, Wairarapa
Probabilities are assigned in three categories: above average, near average, and below average.
- Temperatures are about equally likely to be above average (50% chance) or near average (45% chance).
- Rainfall totals are about equally likely to be near normal (40% chance) or above normal (35% chance).
- There is a chance for occasional heavy rainfall events that can elevate the risk for flooding.
- Soil moisture and river flow levels are most likely to be near normal (40% chance).
The full probability breakdown is:
|
Temperature |
Rainfall |
Soil moisture |
River flows |
|
|
Above average |
50 |
35 |
30 |
30 |
|
Near average |
45 |
40 |
40 |
40 |
|
Below average |
05 |
25 |
30 |
30 |
Tasman, Nelson, Marlborough, Buller
Probabilities are assigned in three categories: above average, near average, and below average.
- Temperatures are about equally likely to be above average (50% chance) or near average (45% chance).
- Rainfall totals are most likely to be near normal (45% chance).
- Soil moisture levels and river flows are most likely to be near normal (45% chance).
The full probability breakdown is:
|
Temperature |
Rainfall |
Soil moisture |
River flows |
|
|
Above average |
50 |
30 |
30 |
25 |
|
Near average |
45 |
45 |
45 |
45 |
|
Below average |
05 |
25 |
25 |
30 |
West Coast, Alps and foothills, inland Otago, Southland
Probabilities are assigned in three categories: above average, near average, and below average.
- Temperatures are most likely to be above average (50% chance).
- Rainfall totals are about equally likely to be near normal (40% chance) or above normal (35% chance).
- Soil moisture levels and river flows are most likely to be near normal (50% chance).
The full probability breakdown is:
|
Temperature |
Rainfall |
Soil moisture |
River flows |
|
|
Above average |
50 |
35 |
30 |
30 |
|
Near average |
40 |
40 |
50 |
50 |
|
Below average |
10 |
25 |
20 |
20 |
Coastal Canterbury, east Otago
Probabilities are assigned in three categories: above average, near average, and below average.
- Temperatures are most likely to be above average (50% chance).
- Rainfall totals are most likely to be near normal (40% chance).
- There is a chance for occasional heavy rainfall events that can elevate the risk for flooding.
- Soil moisture levels and river flows are equally likely to be near normal (40% chance) or above normal (40% chance).
The full probability breakdown is:
|
Temperature |
Rainfall |
Soil moisture |
River flows |
|
|
Above average |
50 |
30 |
40 |
40 |
|
Near average |
40 |
40 |
40 |
40 |
|
Below average |
10 |
30 |
20 |
20 |
Graphical representation of the regional probabilities

Background
The NINO3.4 Index anomaly (in the central Pacific) during June (through the 27th) was 0.18˚C, the first time it has been positive since July 2020. The Southern Oscillation Index was +0.2, in the ENSO neutral range.
During June, upper-oceanic heat content remained above average across the Pacific. A slight cooling trend occurred in the central part of the basin and is worth monitoring through the rest of winter given some models’ prediction for the development of another La Niña event later this year.
According to the consensus from international models, the probability for ENSO neutral conditions is 72% for July-September. For October-December, ENSO neutral is favoured at 50%, although the chance for the re-emergence of La Niña increases to 34%.
Warmer than average ocean temperatures in the central and eastern equatorial Atlantic have culminated in the development of an “Atlantic Niño”. When an Atlantic Niño is active in austral winter, there is a tendency for La Niña to become active during the following summer.
During June, the Atlantic Niño event influenced convective forcing over the eastern Atlantic Ocean and Africa. This feature will likely continue to leave an imprint on the climate system over the coming months and may cause the Madden-Julian Oscillation (MJO) to linger in phases 1 and 2.
The ENSO neutral background state will likely also allow for plenty of intraseasonal variability, which may result in changeable air pressure, temperature, and rainfall regimes for New Zealand over the coming months. This looks to be the case during July, as a mobile MJO event unfolds and likely arrives in the western Pacific during the middle part of the month. This will increase the chance for unsettled weather in the Tasman Sea and around New Zealand.
NZ’s coastal water temperature anomalies remained warmer than average during June, ranging from 0.9˚C to 1.3˚C above average. This will continue to have an upward influence on air temperatures.
NZ coastal SSTs during June 2021 (through to the 27th)
|
North NI |
0.99˚C |
|
West NI |
1.12˚C |
|
East NI |
0.88˚C |
|
North SI |
1.14˚C |
|
West SI |
1.32˚C |
|
East SI |
1.16˚C |

The Southern Annular Mode (SAM) was strongly positive for much of June, associated with a ridge of high pressure in the New Zealand region as well as a stronger-than-normal tropospheric polar vortex over Antarctica. A negative SAM pattern may develop in early July as pressures fall across New Zealand and the Tasman Sea and increase near the pole. For New Zealand, this may be associated with an increase in westerly winds and more variable rainfall and temperature patterns.
Forecast confidence
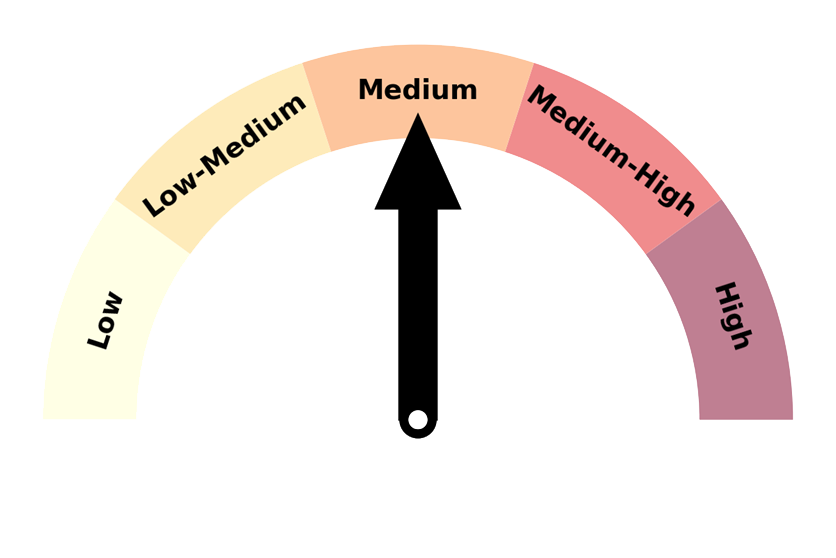
Temperature
|
Forecast confidence for temperature is medium. Although ocean temperature continues to run above average in the western Pacific Ocean and in New Zealand’s coastal waters, climate forcing patterns suggest more variable air flows over the coming months, causing changeable air temperatures. The chance for a colder than average three month period remains very low, however. |
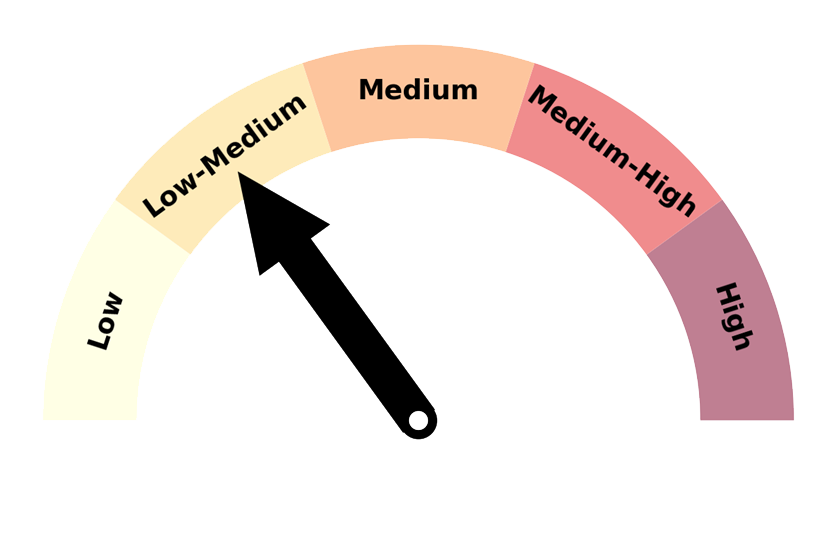
Rainfall
|
Forecast confidence for rainfall is low to medium. With ENSO neutral conditions still in control, New Zealand’s climate drivers will operate on shorter timescales (i.e. changing quickly). This will likely lead to more variability and uncertainty in weather patterns over the course of the season. |
