Outlook summary
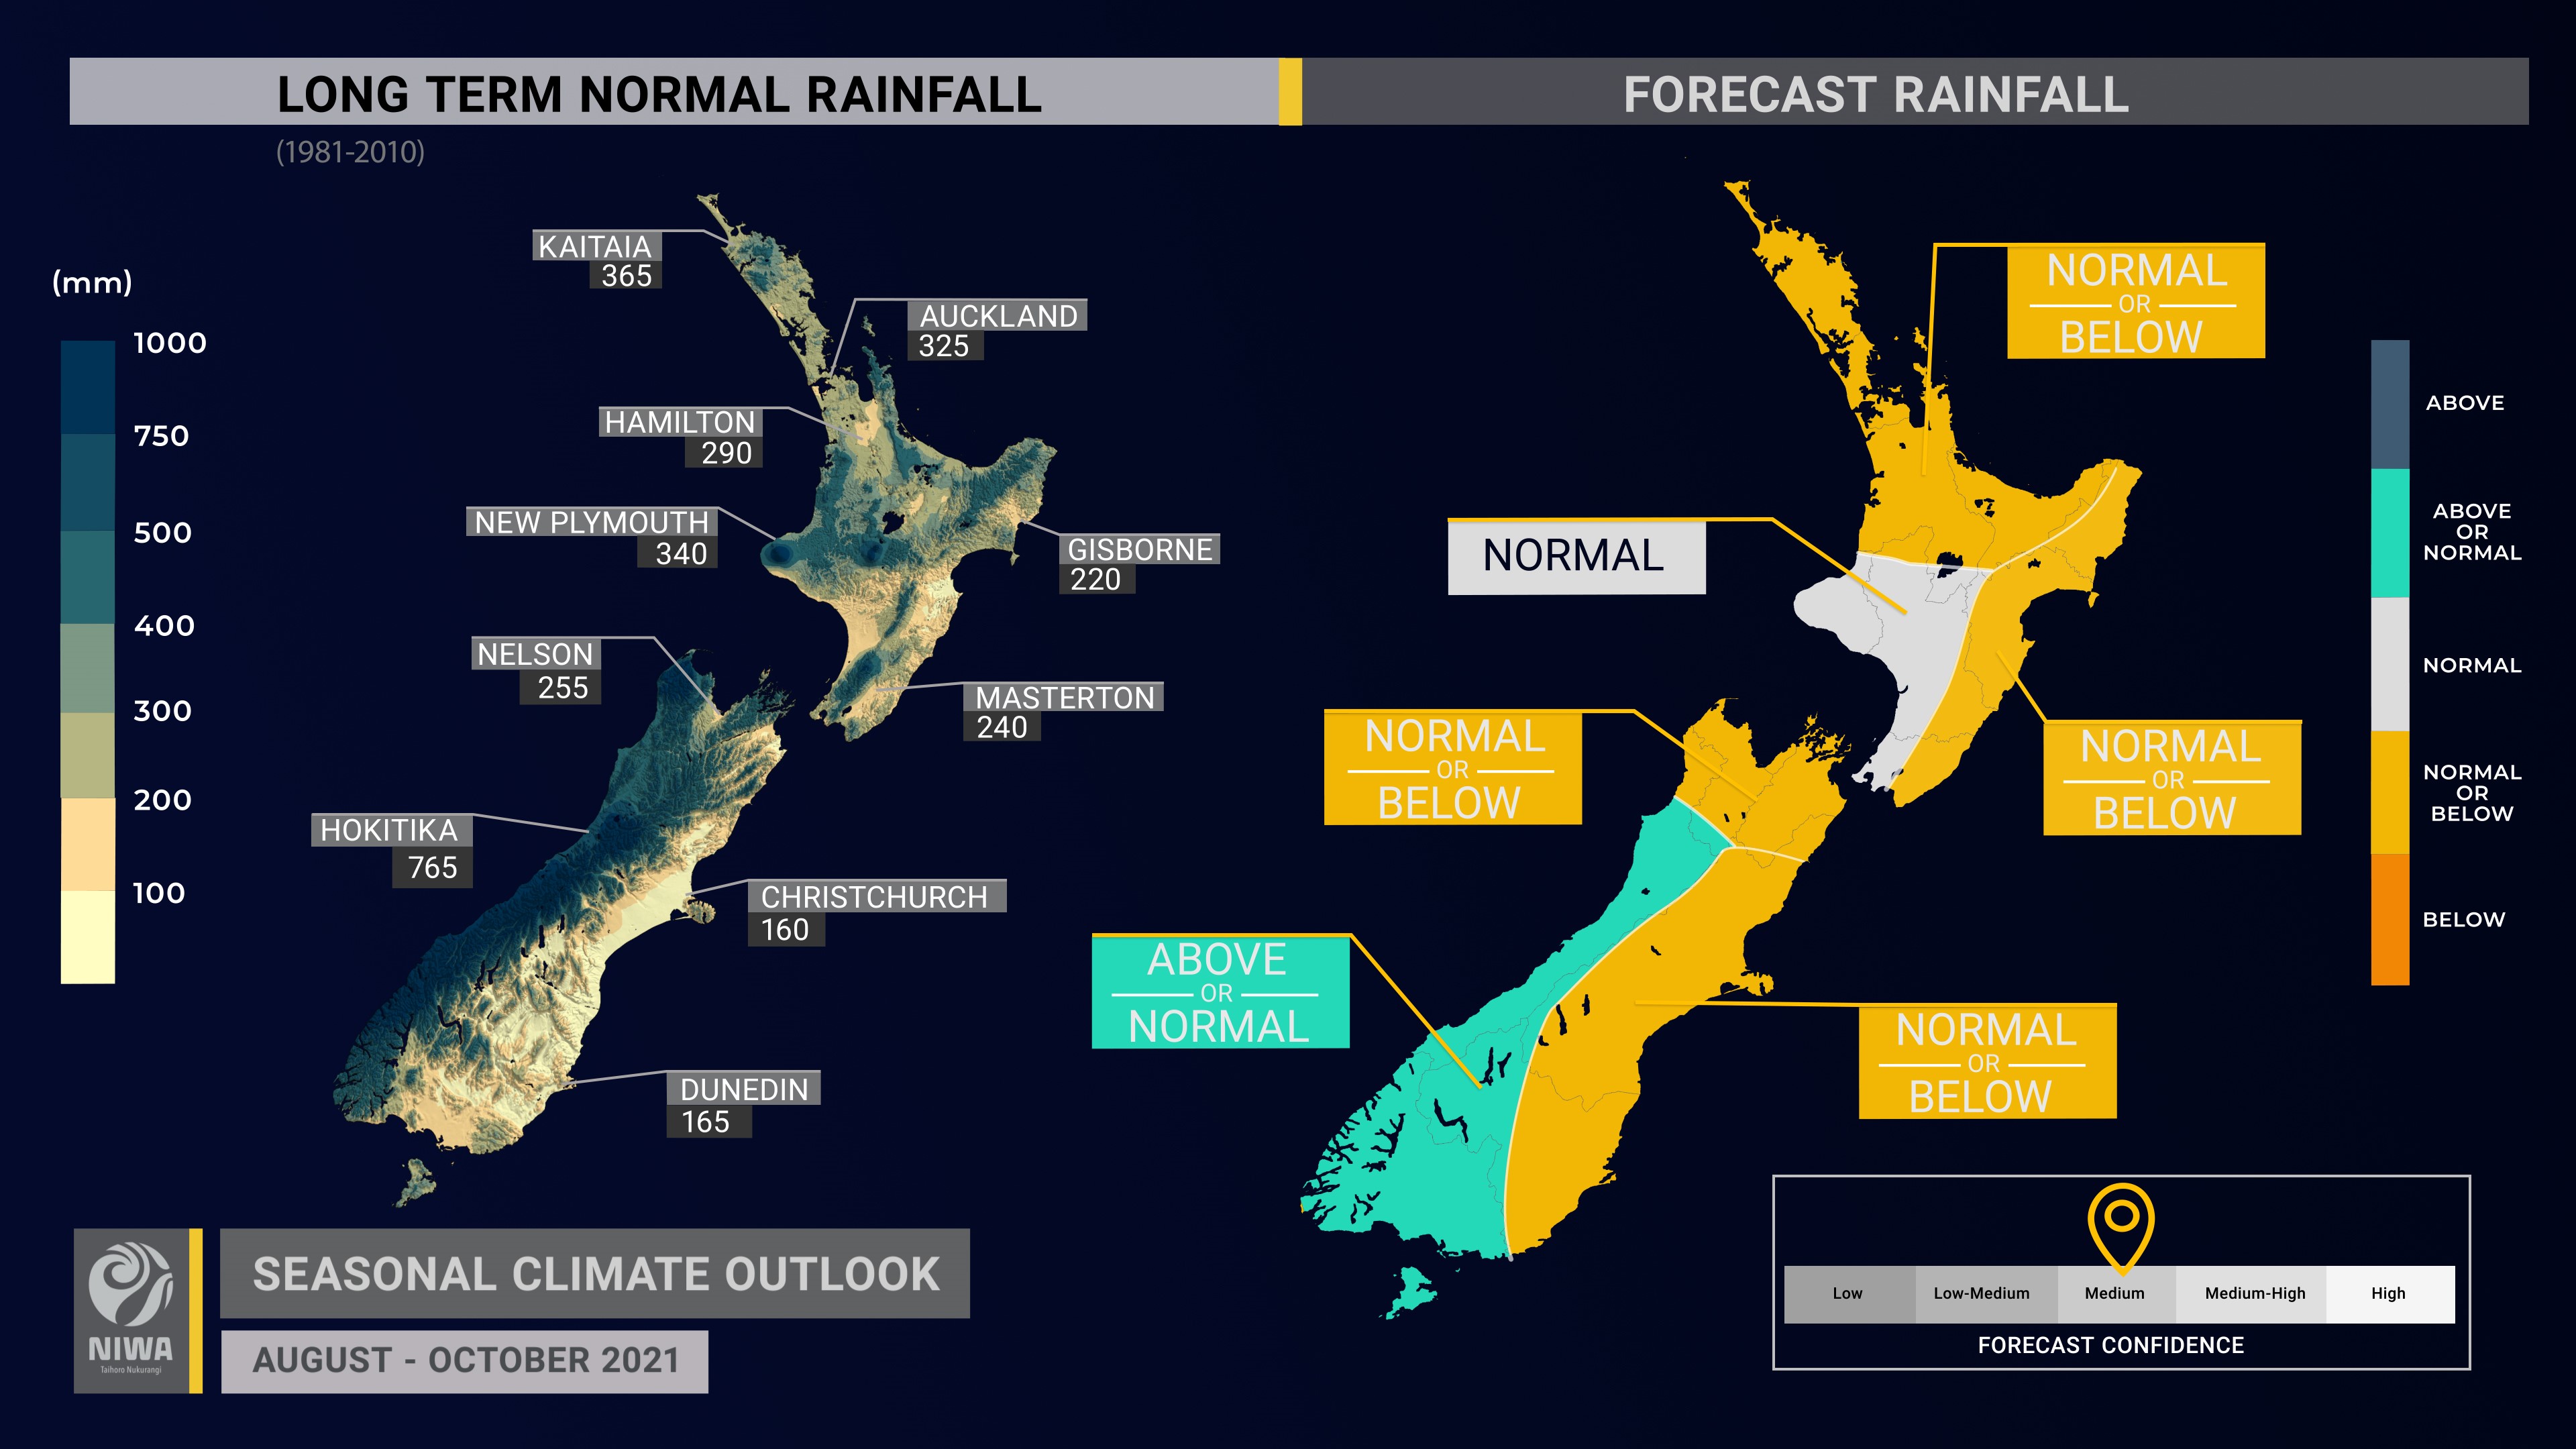
- Rainfall is about equally likely to be near normal or above normal in the west of the South Island, most likely to be near normal in the west of the North Island, and about equally likely to be near normal or below normal in all remaining regions.
- Higher than normal air pressure in the New Zealand region, especially to the north and east, is expected to bring spells of drier than normal conditions to many regions through the three month period along with more northwesterly quarter winds (westerly to northerly).
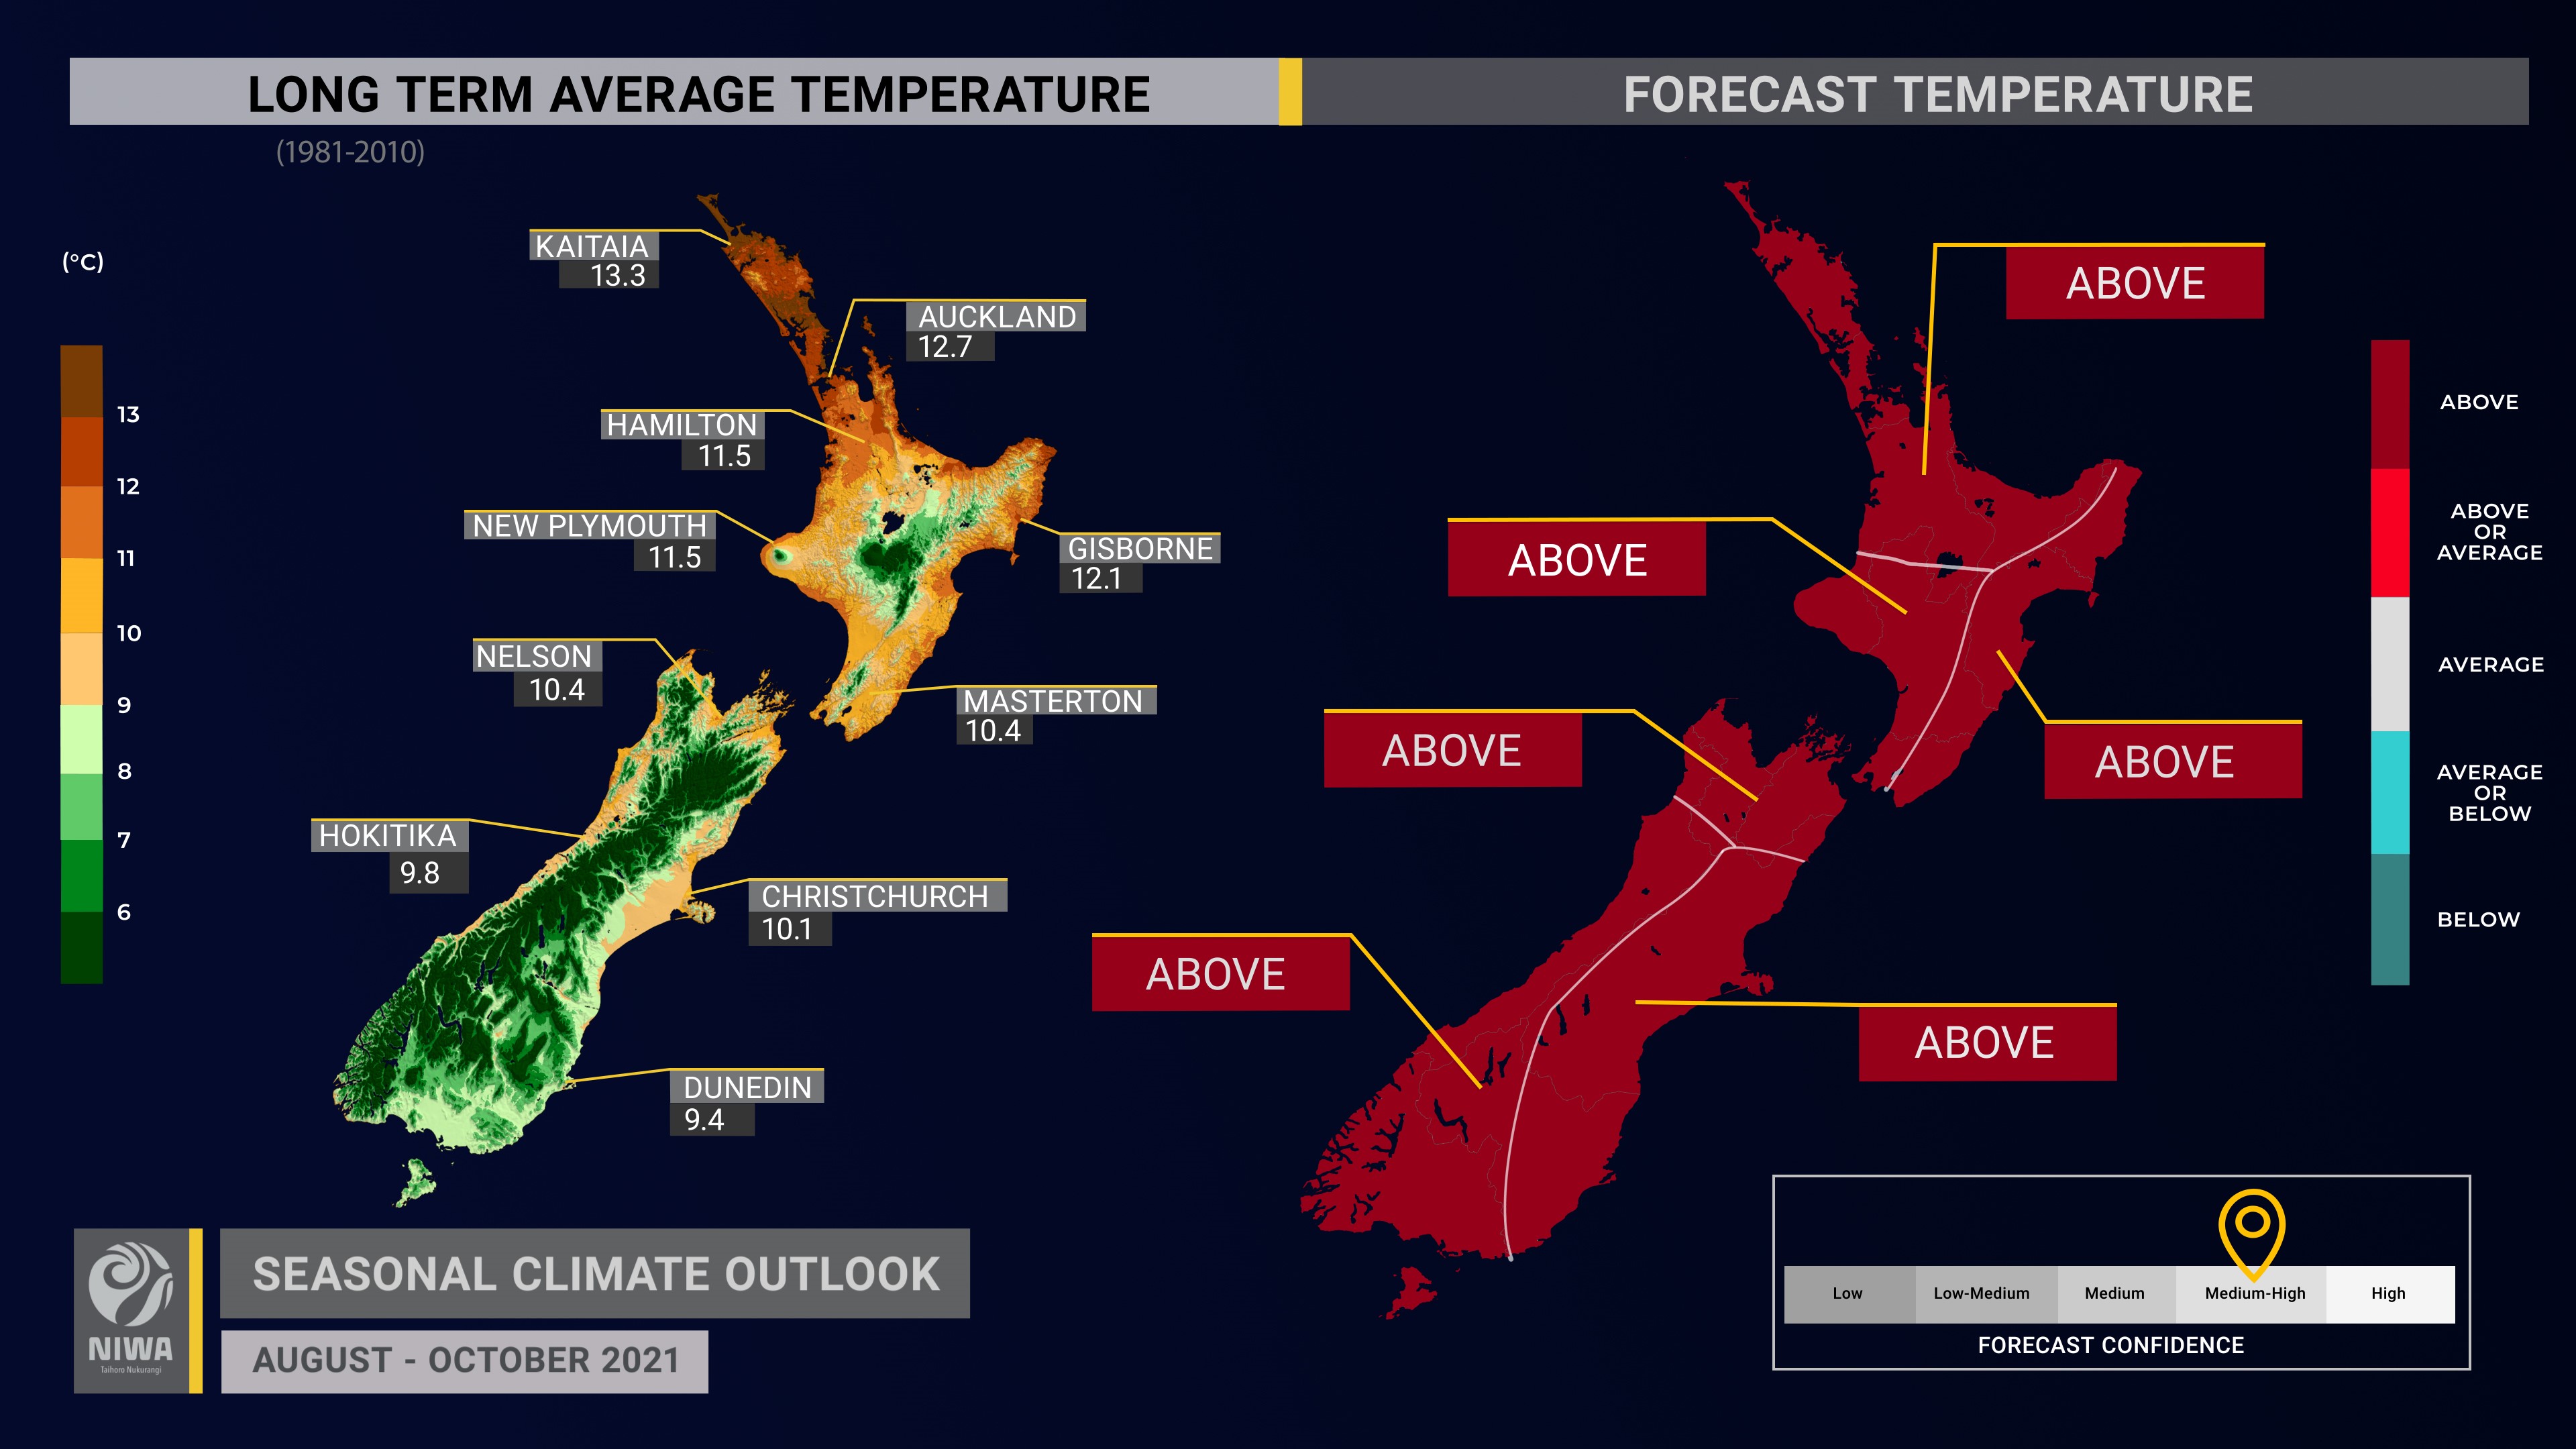
- Temperatures are most likely to be above average in all regions of the country. More northwesterly air flows will likely cause spells of unseasonably warm temperatures in the north and east of both islands in particular.
- NIWA will move to La Niña Watch, acknowledging ocean and atmosphere conditions in the Pacific Ocean that are trending toward La Niña. For more information, see the Background.
- The climate system is showing similarities to this time last year, which featured La Niña development during spring – these similarities are reflected in the rainfall and temperature outlook. This information may be useful for planning purposes over the coming season.
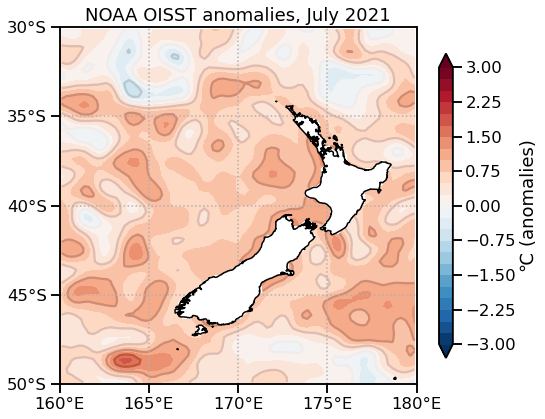
- New Zealand’s coastal sea surface temperatures (SSTs) ranged from 0.7˚C to 1.0˚C above average during July and are predicted to remain warmer than average.
- Soil moisture levels are about equally likely to be near normal or below normal in the east of the North Island and most likely to be near normal in all other regions.
- River flows are about equally likely to be near normal or below normal in the north and east of the North Island and north of the South Island and most likely to be near normal in all other regions.
Regional predictions for August – October 2021
Northland, Auckland, Waikato, Bay of Plenty
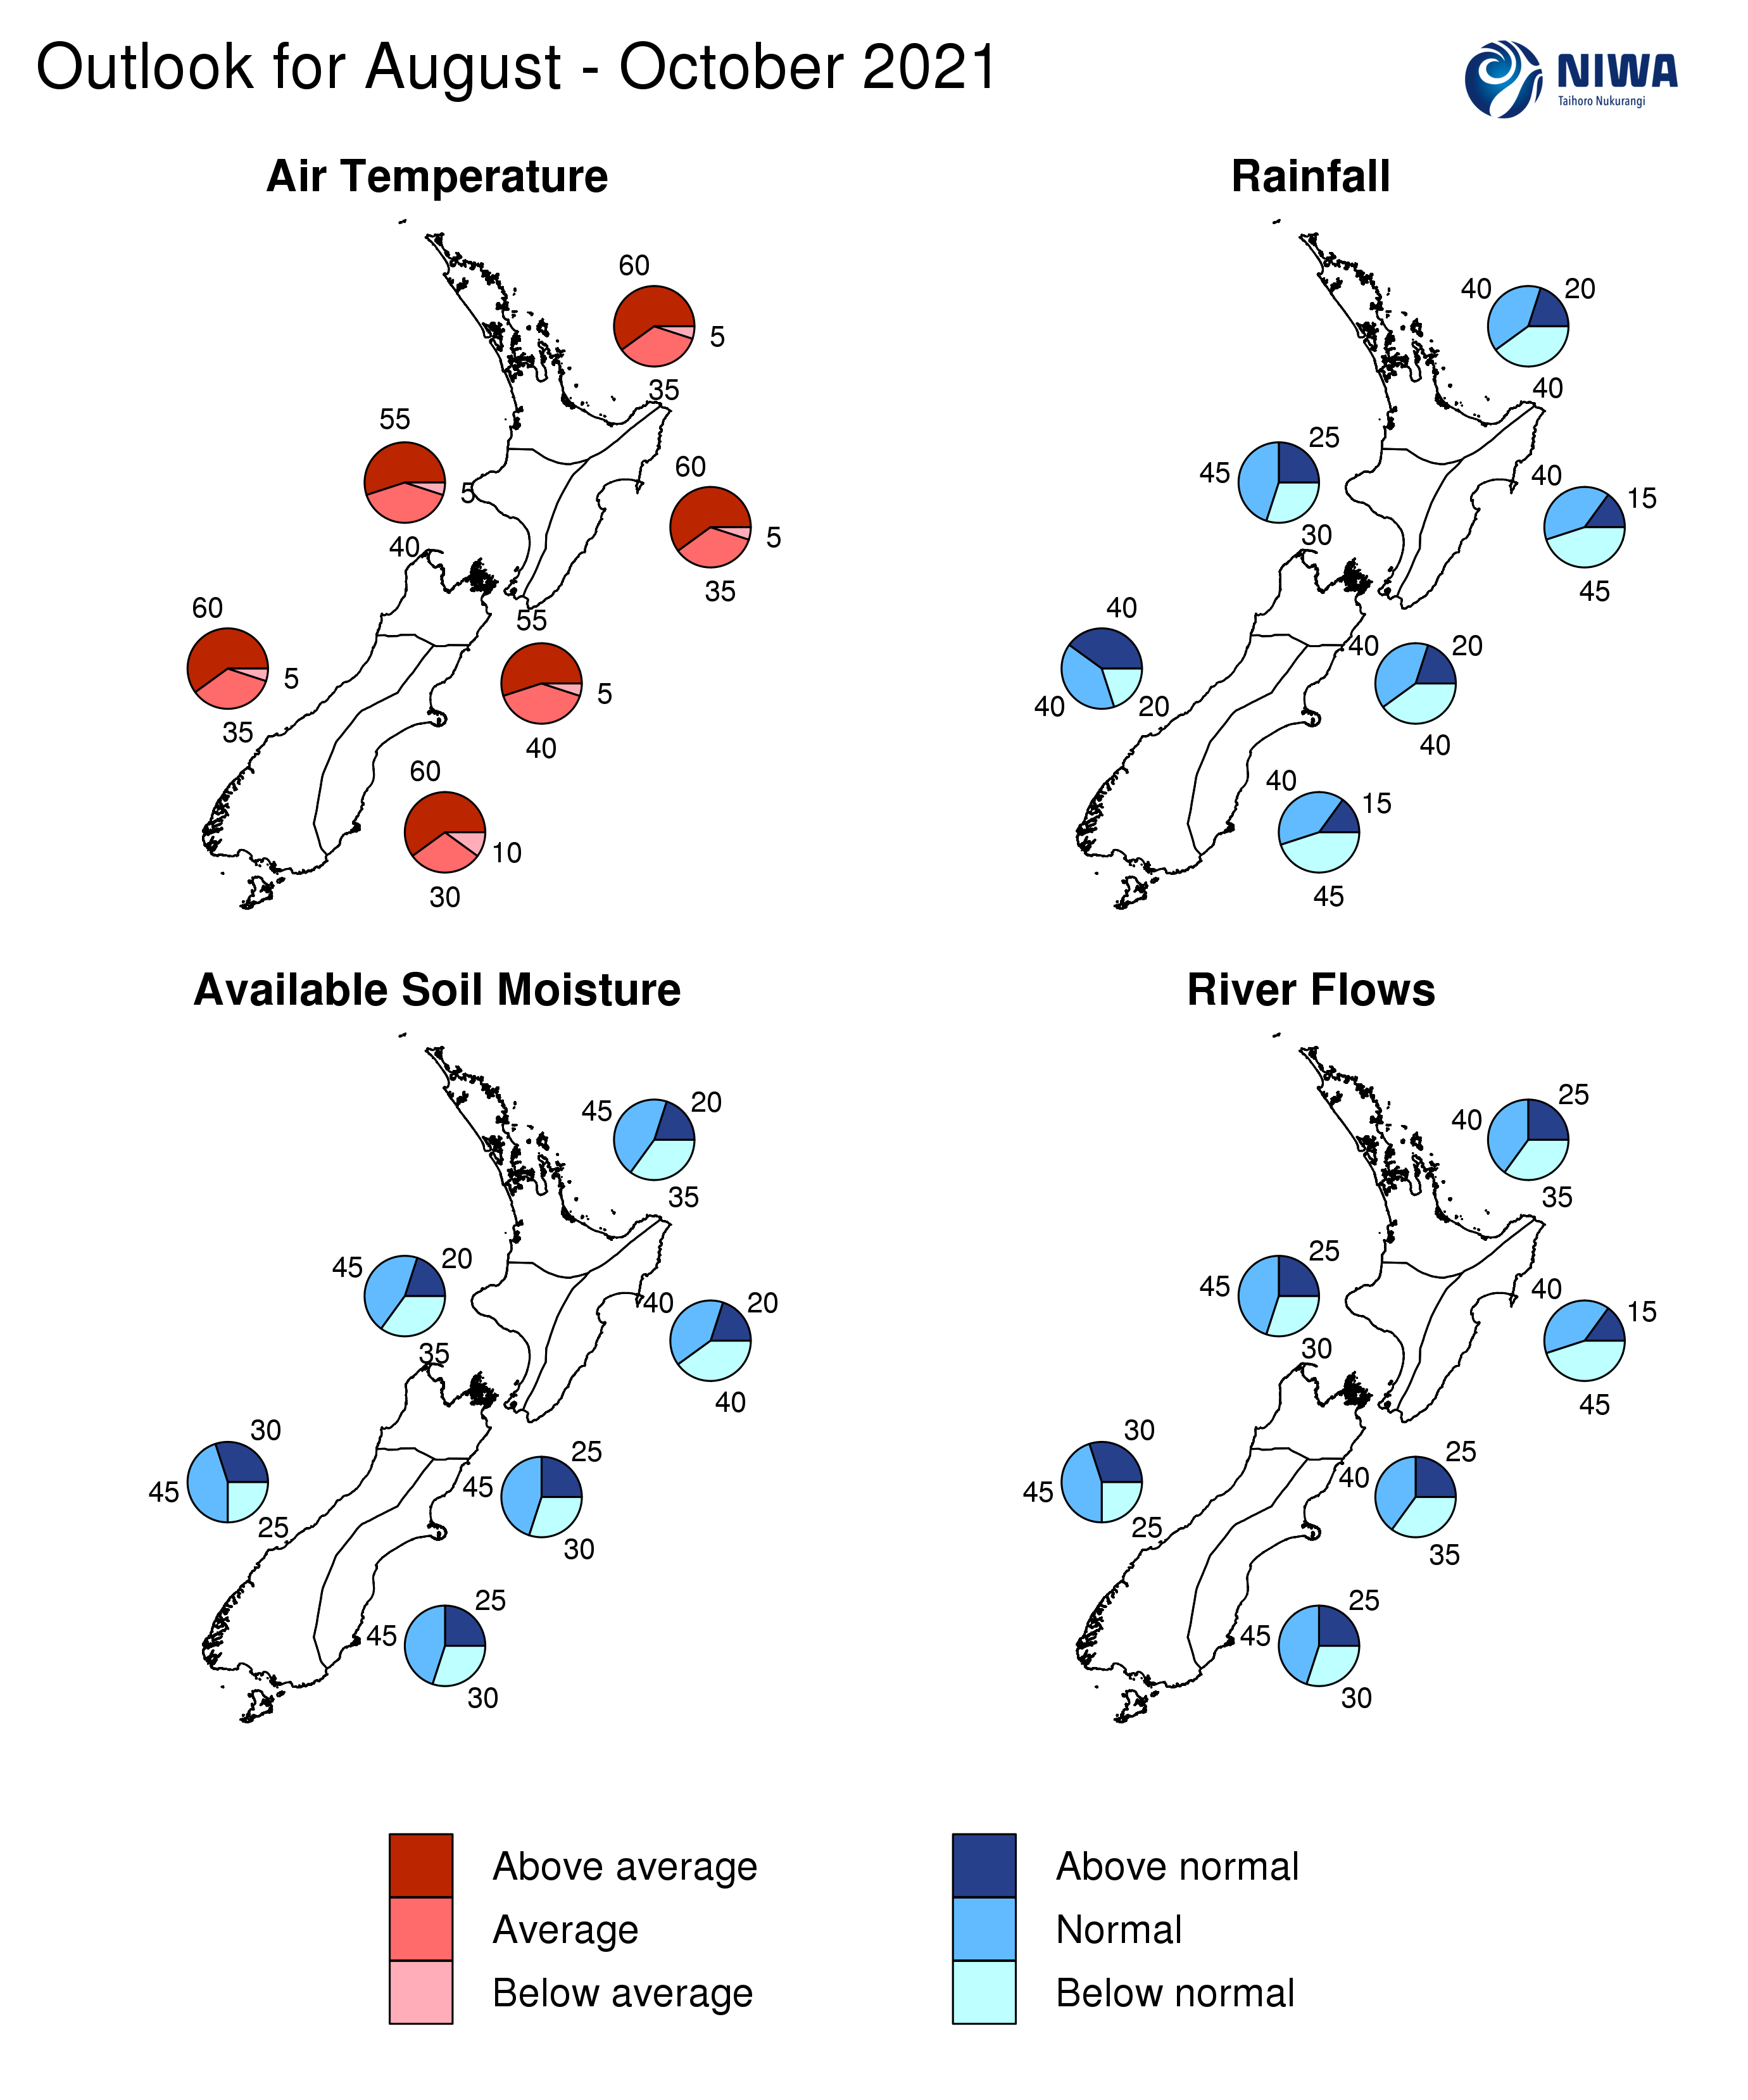
The table below shows the probabilities (or percent chances) for each of three categories: above average, near average, and below average. In the absence of any forecast guidance there would be an equal likelihood (33% chance) of the outcome being in any one of the three categories. Forecast information from local and global guidance models is used to indicate the deviation from equal chance expected for the coming three-month period, with the following outcomes the most likely (but not certain) for this region:
- Temperatures are very likely to be above average (60% chance).
- Rainfall totals are about equally likely to be near normal (40% chance) or below normal (40% chance).
- Extended dry spells, unusual for the time of year, are possible.
- Soil moisture levels are most likely to be near normal (45% chance) while river flows are about equally likely to be near normal (40% chance) or below normal (35% chance).
The full probability breakdown is:
|
Temperature |
Rainfall |
Soil moisture |
River flows |
|
|
Above average |
60 |
20 |
20 |
25 |
|
Near average |
35 |
40 |
45 |
40 |
|
Below average |
05 |
40 |
35 |
35 |
Central North Island, Taranaki, Whanganui, Manawatu, Wellington
Probabilities are assigned in three categories: above average, near average, and below average.
- Temperatures are most likely to be above average (55% chance).
- Rainfall totals are most likely to be near normal (45% chance).
- Soil moisture and river flow levels are most likely to be near normal (45% chance).
The full probability breakdown is:
|
Temperature |
Rainfall |
Soil moisture |
River flows |
|
|
Above average |
55 |
25 |
20 |
25 |
|
Near average |
40 |
45 |
45 |
45 |
|
Below average |
05 |
30 |
35 |
30 |
Gisborne, Hawke’s Bay, Wairarapa
Probabilities are assigned in three categories: above average, near average, and below average.
- Temperatures are very likely to be above average (60% chance).
- Rainfall totals are about equally likely to be below normal (45% chance) or near normal (40% chance).
- Extended dry spells, unusual for the time of year, are possible.
- Periods of unseasonable warmth are possible due to more northwesterly winds.
- Soil moisture and river flow levels are about equally likely to be near normal or below normal (40-45% chance).
The full probability breakdown is:
|
Temperature |
Rainfall |
Soil moisture |
River flows |
|
|
Above average |
60 |
15 |
20 |
15 |
|
Near average |
35 |
40 |
40 |
40 |
|
Below average |
05 |
45 |
40 |
45 |
Tasman, Nelson, Marlborough, Buller
Probabilities are assigned in three categories: above average, near average, and below average.
- Temperatures are most likely to be above average (55% chance).
- Rainfall totals are equally likely to be near normal (40% chance) or below normal (40% chance).
- Extended dry spells, unusual for the time of year, are possible.
- Soil moisture levels are most likely to be near normal (45% chance) while river flows are about equally likely to be near normal (40% chance) or below normal (35% chance).
The full probability breakdown is:
|
Temperature |
Rainfall |
Soil moisture |
River flows |
|
|
Above average |
55 |
20 |
25 |
25 |
|
Near average |
40 |
40 |
45 |
40 |
|
Below average |
05 |
40 |
30 |
35 |
West Coast, Alps and foothills, inland Otago, Southland
Probabilities are assigned in three categories: above average, near average, and below average.
- Temperatures are very likely to be above average (60% chance).
- Rainfall totals are equally likely to be near normal (40% chance) or above normal (40% chance).
- More westerly wind flows can bring frequent fronts to the region, elevating the potential for heavy rainfall events.
- Soil moisture levels and river flows are most likely to be near normal (45% chance).
The full probability breakdown is:
|
Temperature |
Rainfall |
Soil moisture |
River flows |
|
|
Above average |
60 |
40 |
30 |
30 |
|
Near average |
35 |
40 |
45 |
45 |
|
Below average |
05 |
20 |
25 |
25 |
Coastal Canterbury, east Otago
Probabilities are assigned in three categories: above average, near average, and below average.
- Temperatures are very likely to be above average (60% chance).
- Rainfall totals are about equally likely to be below normal (45% chance) or near normal (40% chance).
- Extended dry spells, unusual for the time of year, are possible.
- Periods of unseasonable warmth are possible due to more northwesterly winds.
- Soil moisture levels and river flows are most likely to be near normal (45% chance).
The full probability breakdown is:
|
Temperature |
Rainfall |
Soil moisture |
River flows |
|
|
Above average |
60 |
15 |
25 |
25 |
|
Near average |
30 |
40 |
45 |
45 |
|
Below average |
10 |
45 |
30 |
30 |
Graphical representation of the regional probabilities
Background
The NINO3.4 Index anomaly (in the central Pacific) during July (through the 25th) was 0.08˚C, although the latest weekly value had dropped to -0.09˚C. The Southern Oscillation Index was +1.8, firmly in La Niña territory.
During July, upper-oceanic heat content continued to decrease across the equatorial Pacific, a trend that started in June. Cooler waters at depth progressed toward the surface and warmer conditions close to the surface contracted and became less anomalous. An upwelling Kelvin wave crossed the Pacific during the month, which spurred the cooling.
Trade winds were enhanced around the equatorial Pacific, consistent with an atmosphere that was trending in a La Niña-like direction. This is expected to continue.
A negative Indian Ocean Dipole (IOD) event was classified by the Australian Bureau of Meteorology during July, referring to well above average SSTs in the tropical eastern Indian Ocean. An Atlantic Niño, characterised by warmer than average ocean temperatures in the central and eastern equatorial Atlantic, persisted throughout the month. These teleconnections, or climate patterns related to one another across long distances, also support an ocean-atmosphere system that is likely to continue to trend in a La Niña-like direction.
On the balance of evidence, the re-emergence of La Niña or continuation of ENSO “cool” neutral conditions are about equally likely (45-50% chance each) over the coming three months. It is also worth acknowledging that USA’s Climate Prediction Centre moved to a “La Niña watch”.
During July, convective forcing was active over Africa and the Indian Ocean early in the month before moving into the western Pacific. In association with this, several plumes of deep, tropical moisture stretched from the eastern Indian Ocean to New Zealand, including one that caused extreme flooding in the Buller District. This likely had some connection to the IOD event.
During August-September, there is a signal that convective forcing events (e.g. MJO) will occur more frequently over Africa and the western Indian Ocean, visiting the Pacific less often. Consequently, model guidance shows the development of higher than normal air pressure in the Southwest Pacific, particularly north and east of New Zealand. For several regions of the country, this may result in the development of rainfall deficiencies during late winter and early spring.
Additionally, after a variable July, the Southern Annular Mode (SAM) will likely spend more time in its positive phase over the coming weeks. This may help to keep rain-bearing fronts suppressed over the Southern Ocean at times, in stride with the forcing patterns previously described.
NZ’s coastal water temperature anomalies remained warmer than average during July, ranging from 0.7˚C to 1.0˚C above average. This will continue to have an upward influence on air temperatures.
NZ coastal SSTs during July 2021 (through the 28th)
|
North NI |
0.84˚C |
|
West NI |
1.06˚C |
|
East NI |
0.70˚C |
|
North SI |
0.95˚C |
|
West SI |
0.82˚C |
|
East SI |
0.85˚C |
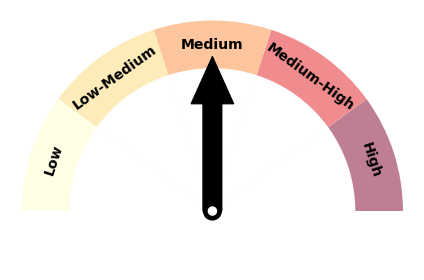
Forecast Confidence
Temperature
|
Forecast confidence for temperatures is medium to high. Wind flows through the season are predicted to favour the west and north, which may help to keep colder air masses suppressed in the Southern Ocean. New Zealand’s coastal water temperatures continue to run warmer than average and the potential development of another La Niña event could cause that to continue. |
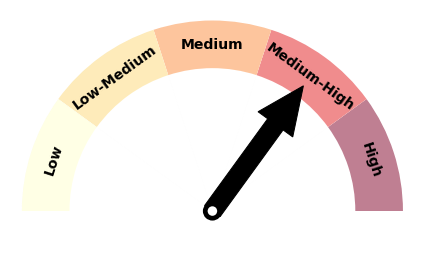
Rainfall
|
Forecast confidence for rainfall is medium. There is strong agreement in sub-seasonal to seasonal model guidance on the existence of a belt of higher than normal pressure in the New Zealand region, which may contribute to unseasonable dry periods. The possible development of another La Niña event through the season could enhance the predictive ability of the guidance, contributing to higher confidence than last month’s outlook. |
