Outlook Summary
- La Niña ended during March, concluding its three-year run. A dramatic change in tropical trade winds resulted in warming seas across the equatorial Pacific. As of late March, ENSO-neutral conditions were occurring, but El Niño conditions may arrive as early as winter. An El Niño Watch has been issued to cover this potential.
- Because of this transition, changeability will be a theme in New Zealand’s weather patterns. Mixed air flows during autumn could tend southerly around the start of winter, consistent with a developing El Niño. As such, the weather during the previous month may not be a particularly useful indicator of the weather in the month ahead.
- During mid-April, a northerly quarter air flow may cause tropical moisture to move toward Aotearoa/New Zealand, resulting in the potential for heavy rainfall.
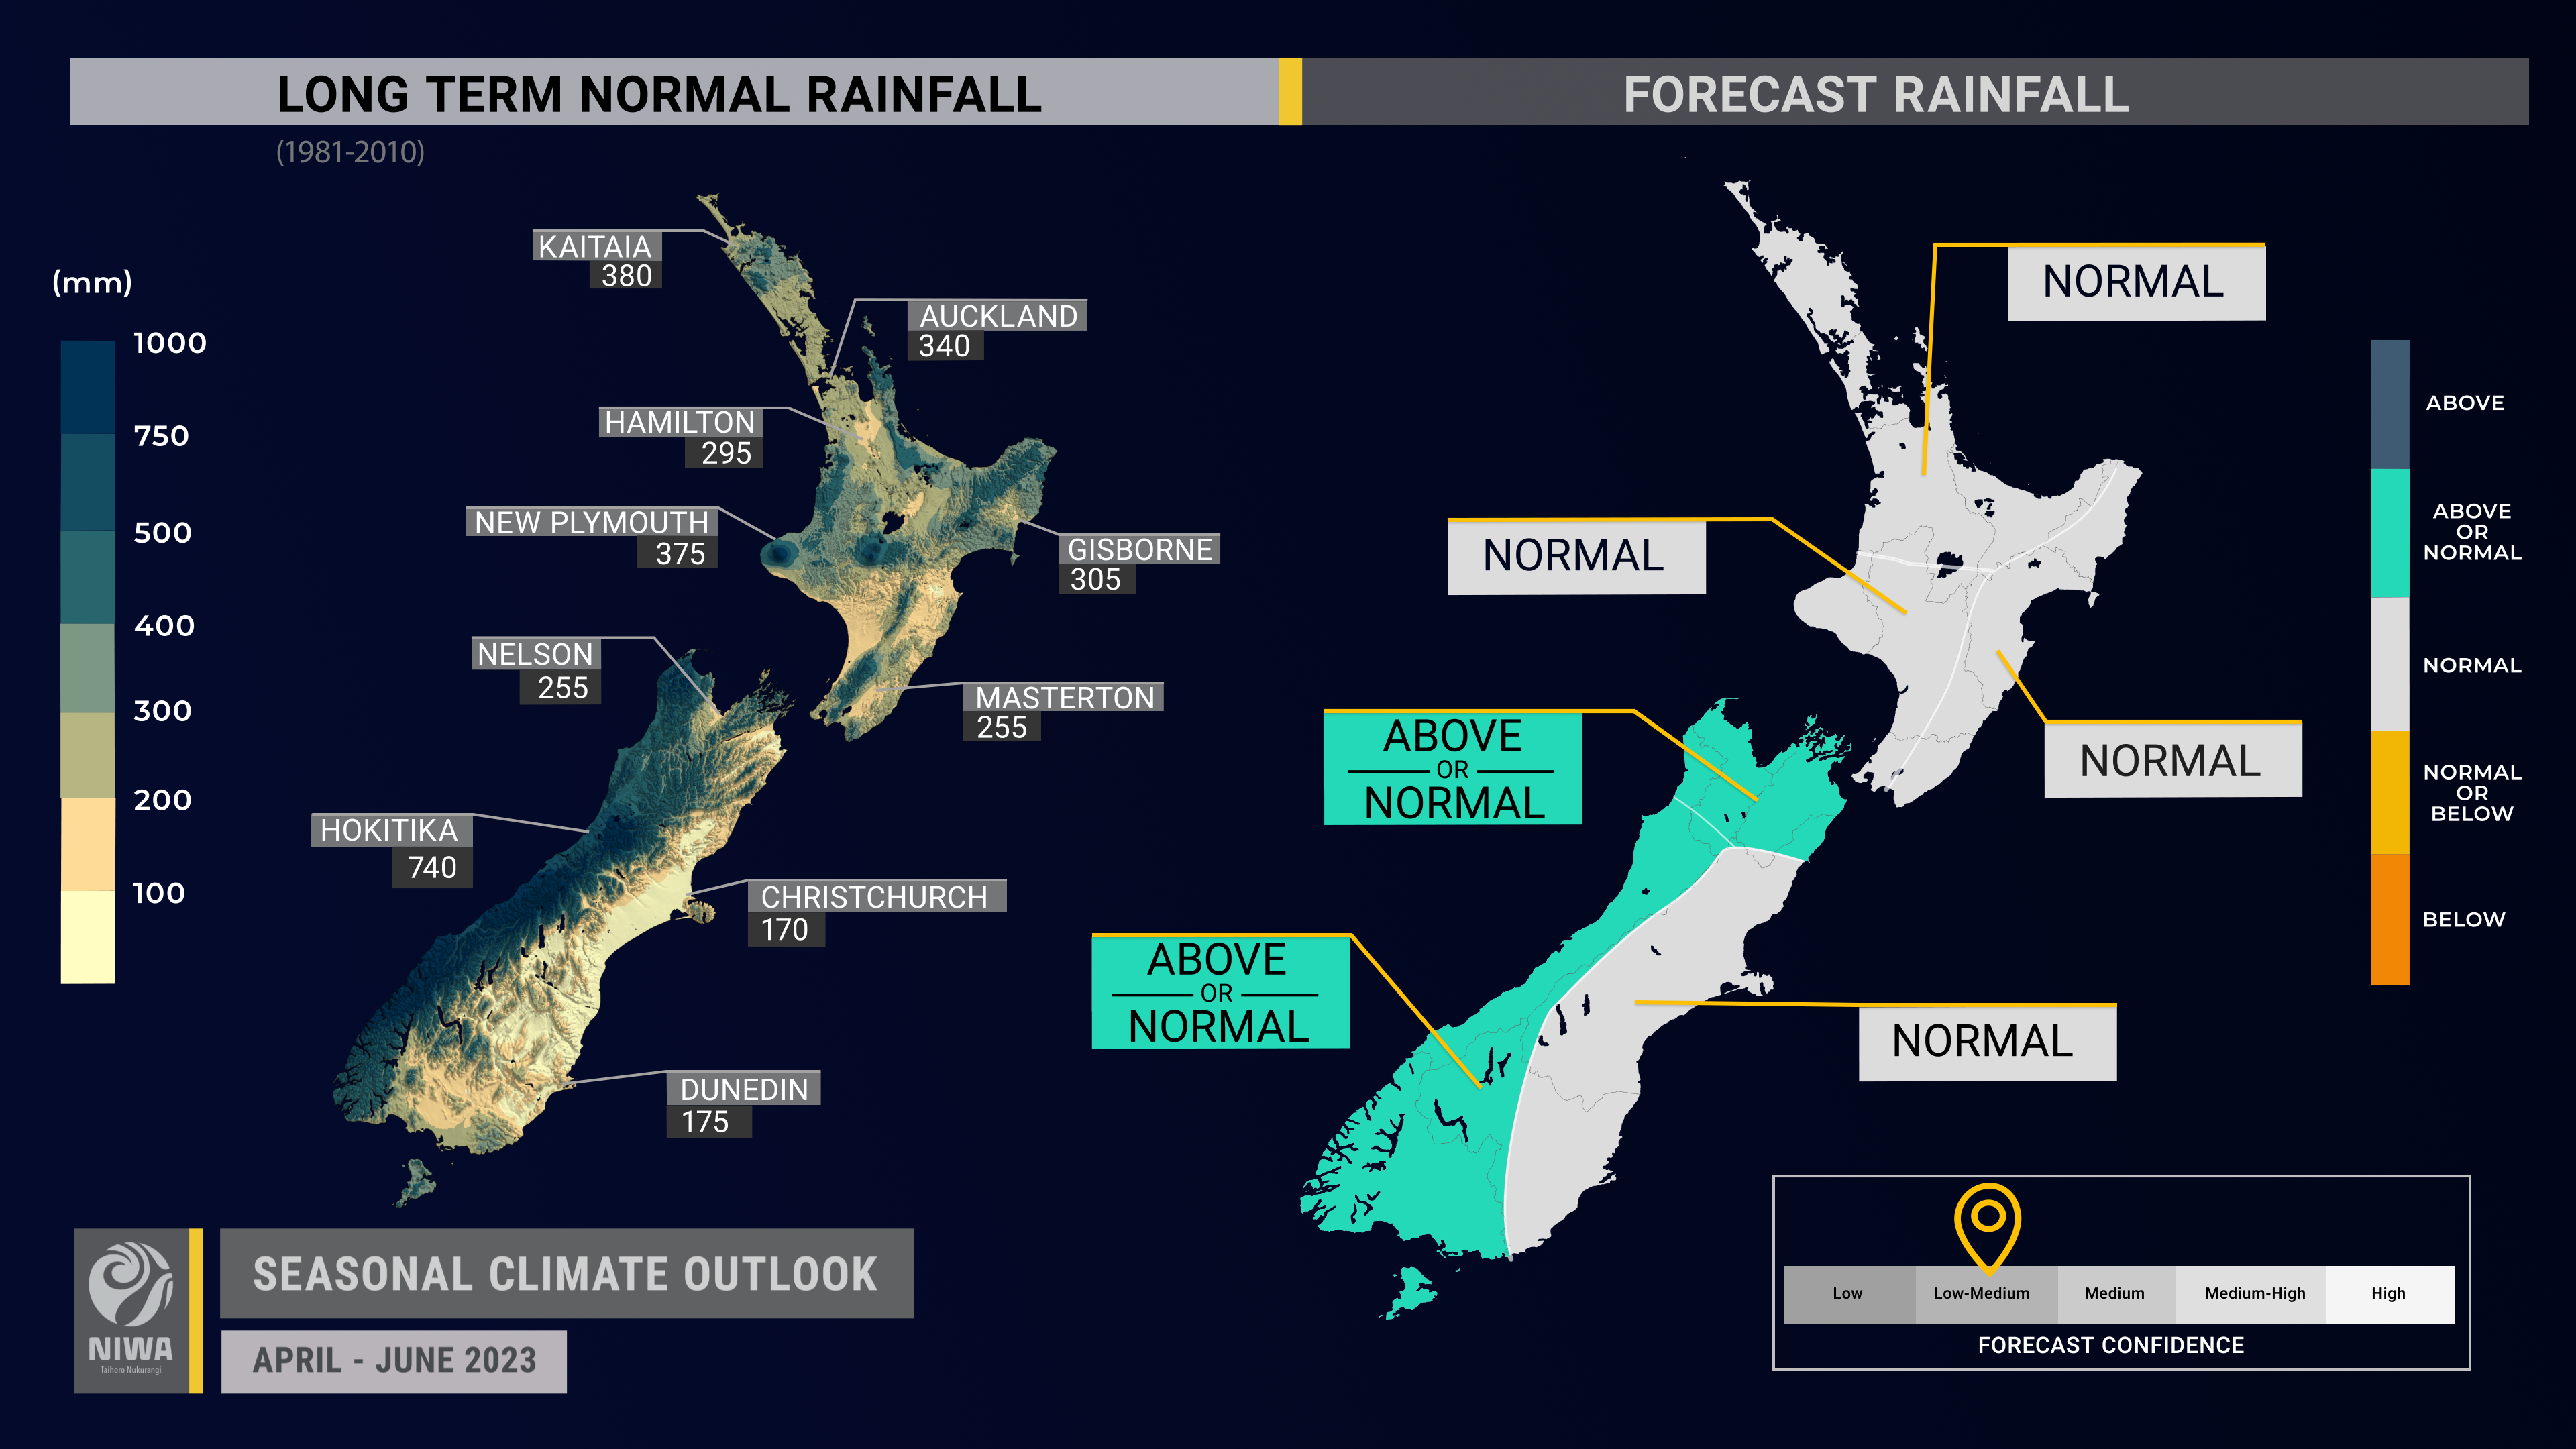
- For the three-month period as a whole, rainfall is about equally likely to be near normal or above normal in the north and west of the South Island and most likely to be near normal in all other regions. Should the climate system migrate toward El Niño in the months ahead, June could turn out less wet than normal, particularly if southerly quarter winds take hold.
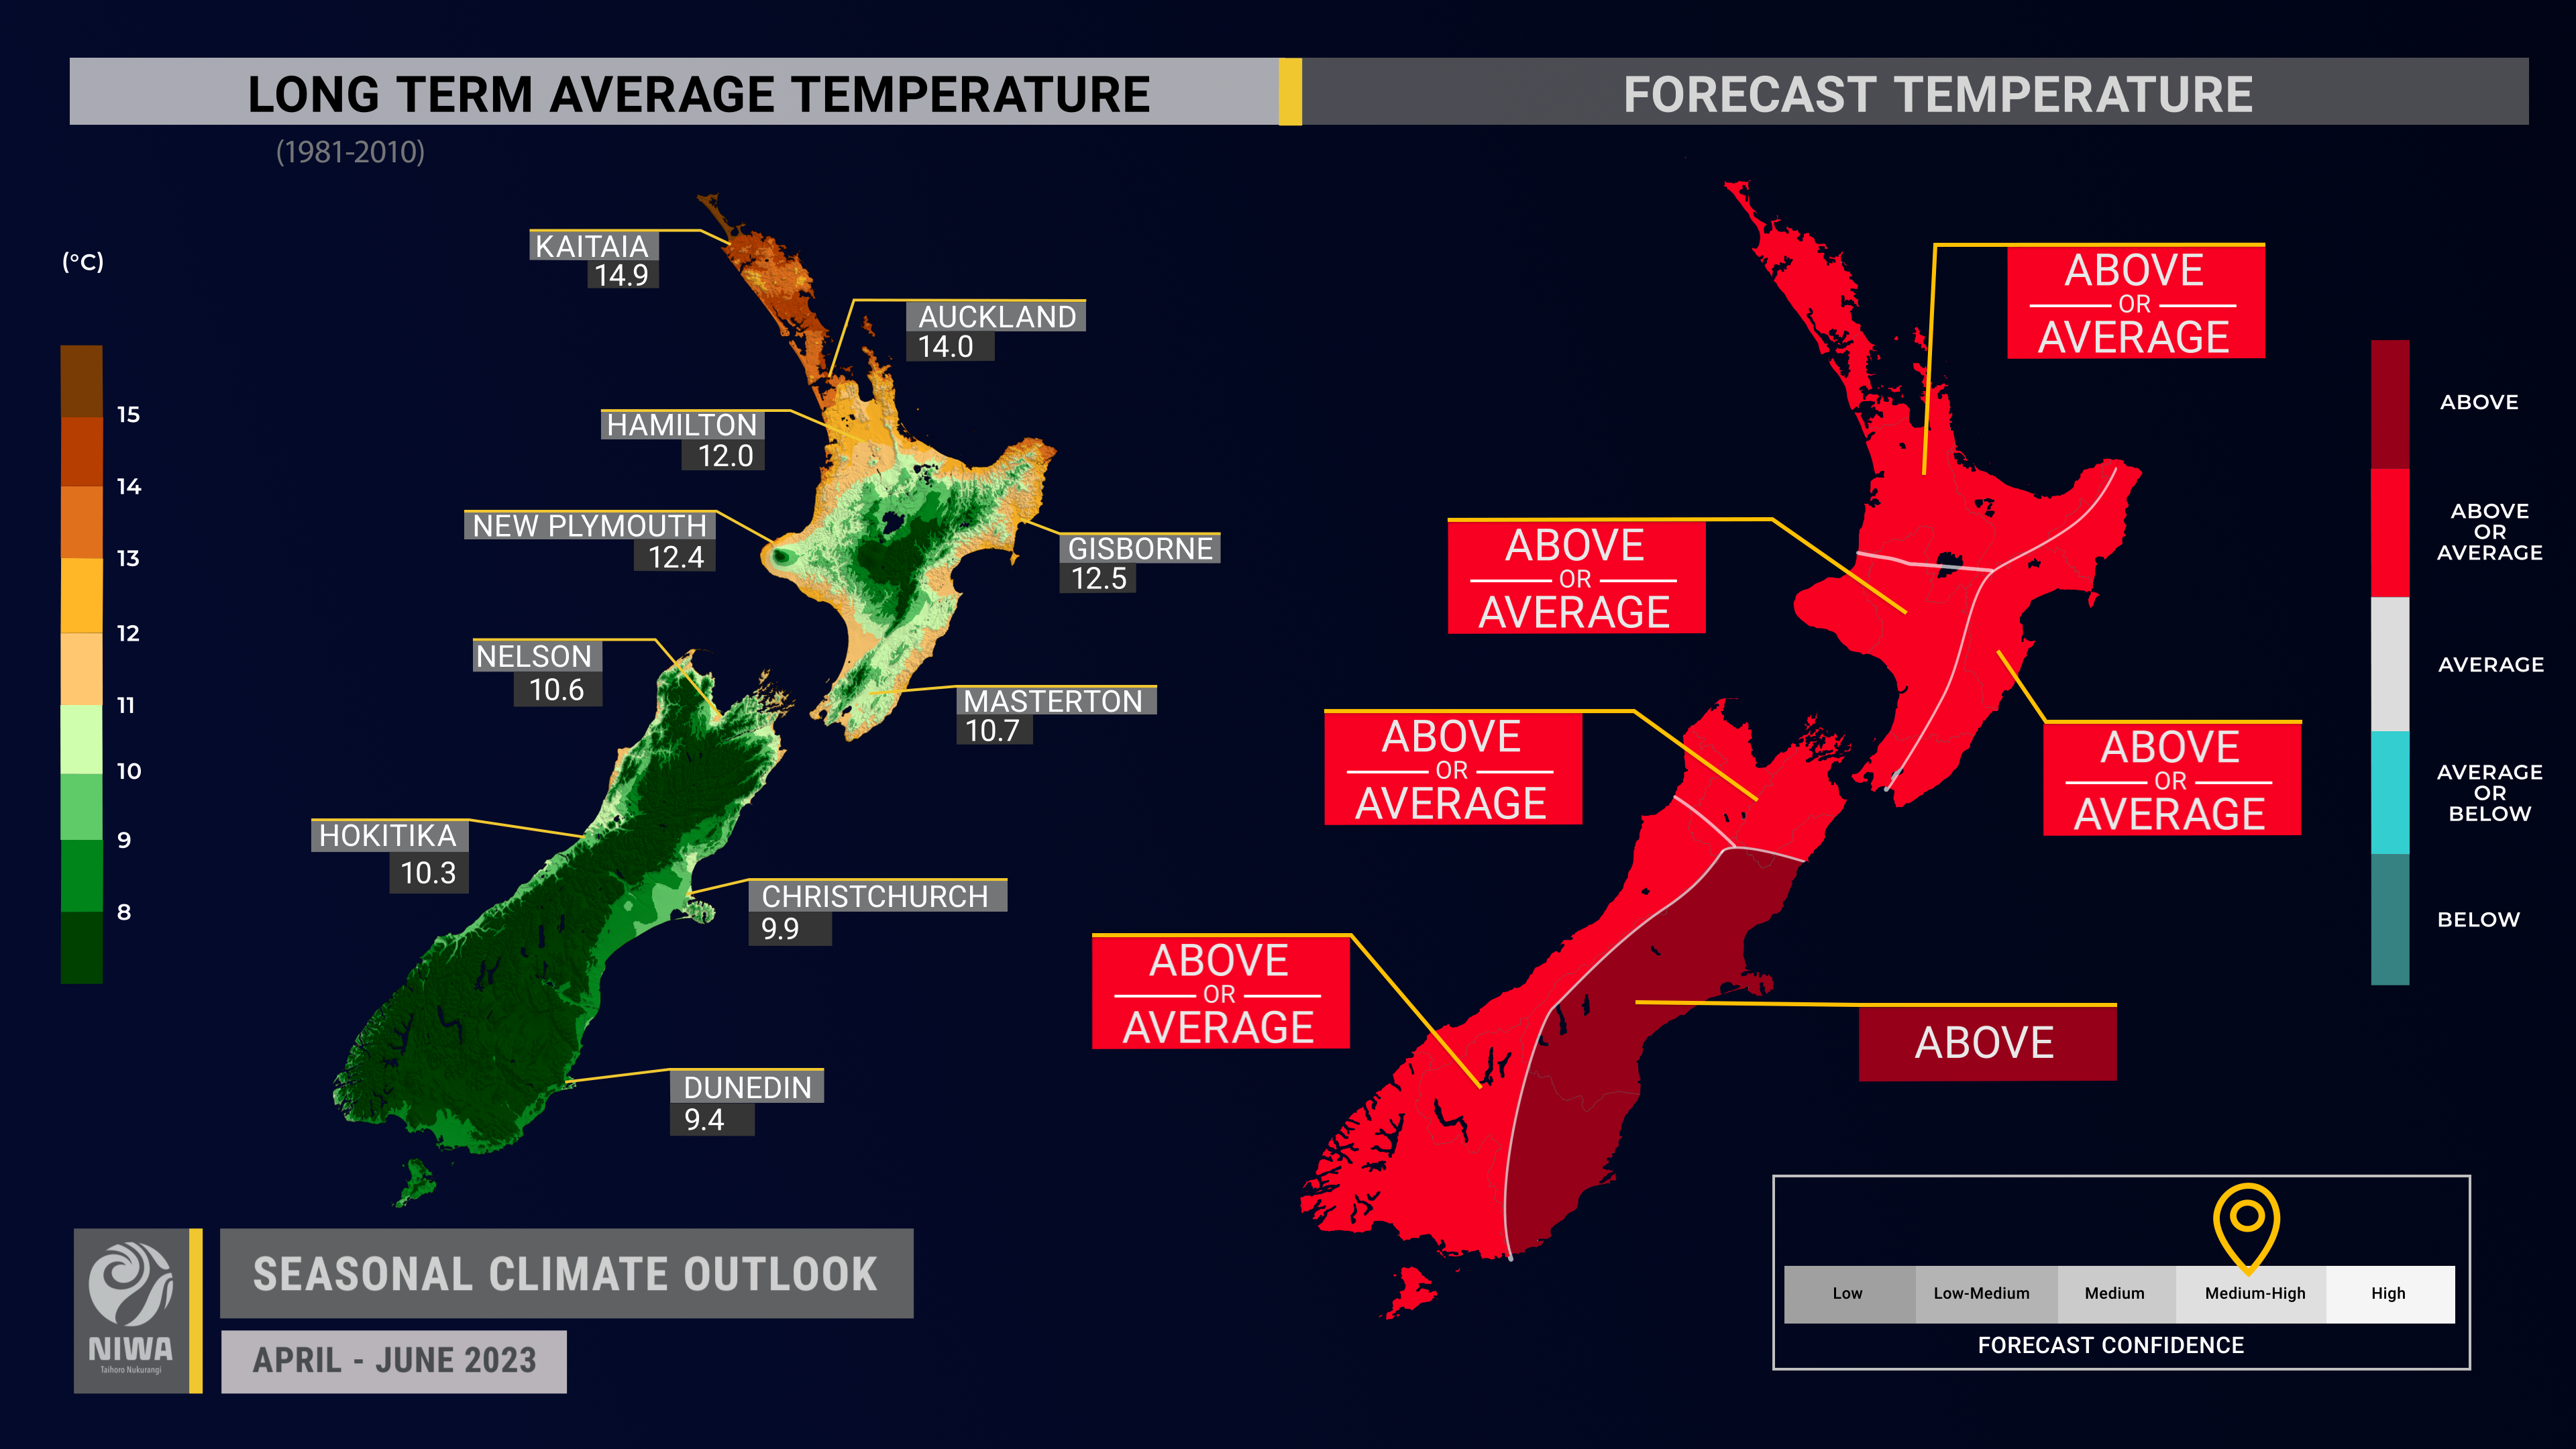
- Seasonal temperatures are most likely to be above average in the east of the South Island and about equally likely to be near average or above average in all other regions. While a colder than average season is unlikely due to the persistence of warmer than average sea temperatures (SSTs), more variable circulation and wind patterns will lead to more variable temperatures. Should El Niño arrive, it could result in cooler winter temperatures, particularly relative to recent record warm winters, including an increased risk for frosts.
- Coastal sea surface temperatures (SSTs) ranged from 0.6˚C to 2.0˚C above average during March. March SSTs were the warmest on record in the east of the South Island. SST records extend back to 1981.
- Soil moisture levels and river flows are most likely to be near normal in the east of the North Island and north and east of the South Island and about equally likely to be near normal or below normal in the north of the North Island and west of the South Island. In the west of the North Island, near normal soil moisture levels are most likely while river flows are about equally likely to be near normal or below normal.
Regional predictions for April – June 2023
Northland, Auckland, Waikato, Bay of Plenty
The table below shows the probabilities (or percent chances) for each of three categories: above average, near average, and below average. In the absence of any forecast guidance there would be an equal likelihood (33% chance) of the outcome being in any one of the three categories. Forecast information from local and global guidance models is used to indicate the deviation from equal chance that is expected for the coming three-month period. The following outcomes are the most likely (but not certain) for this region:
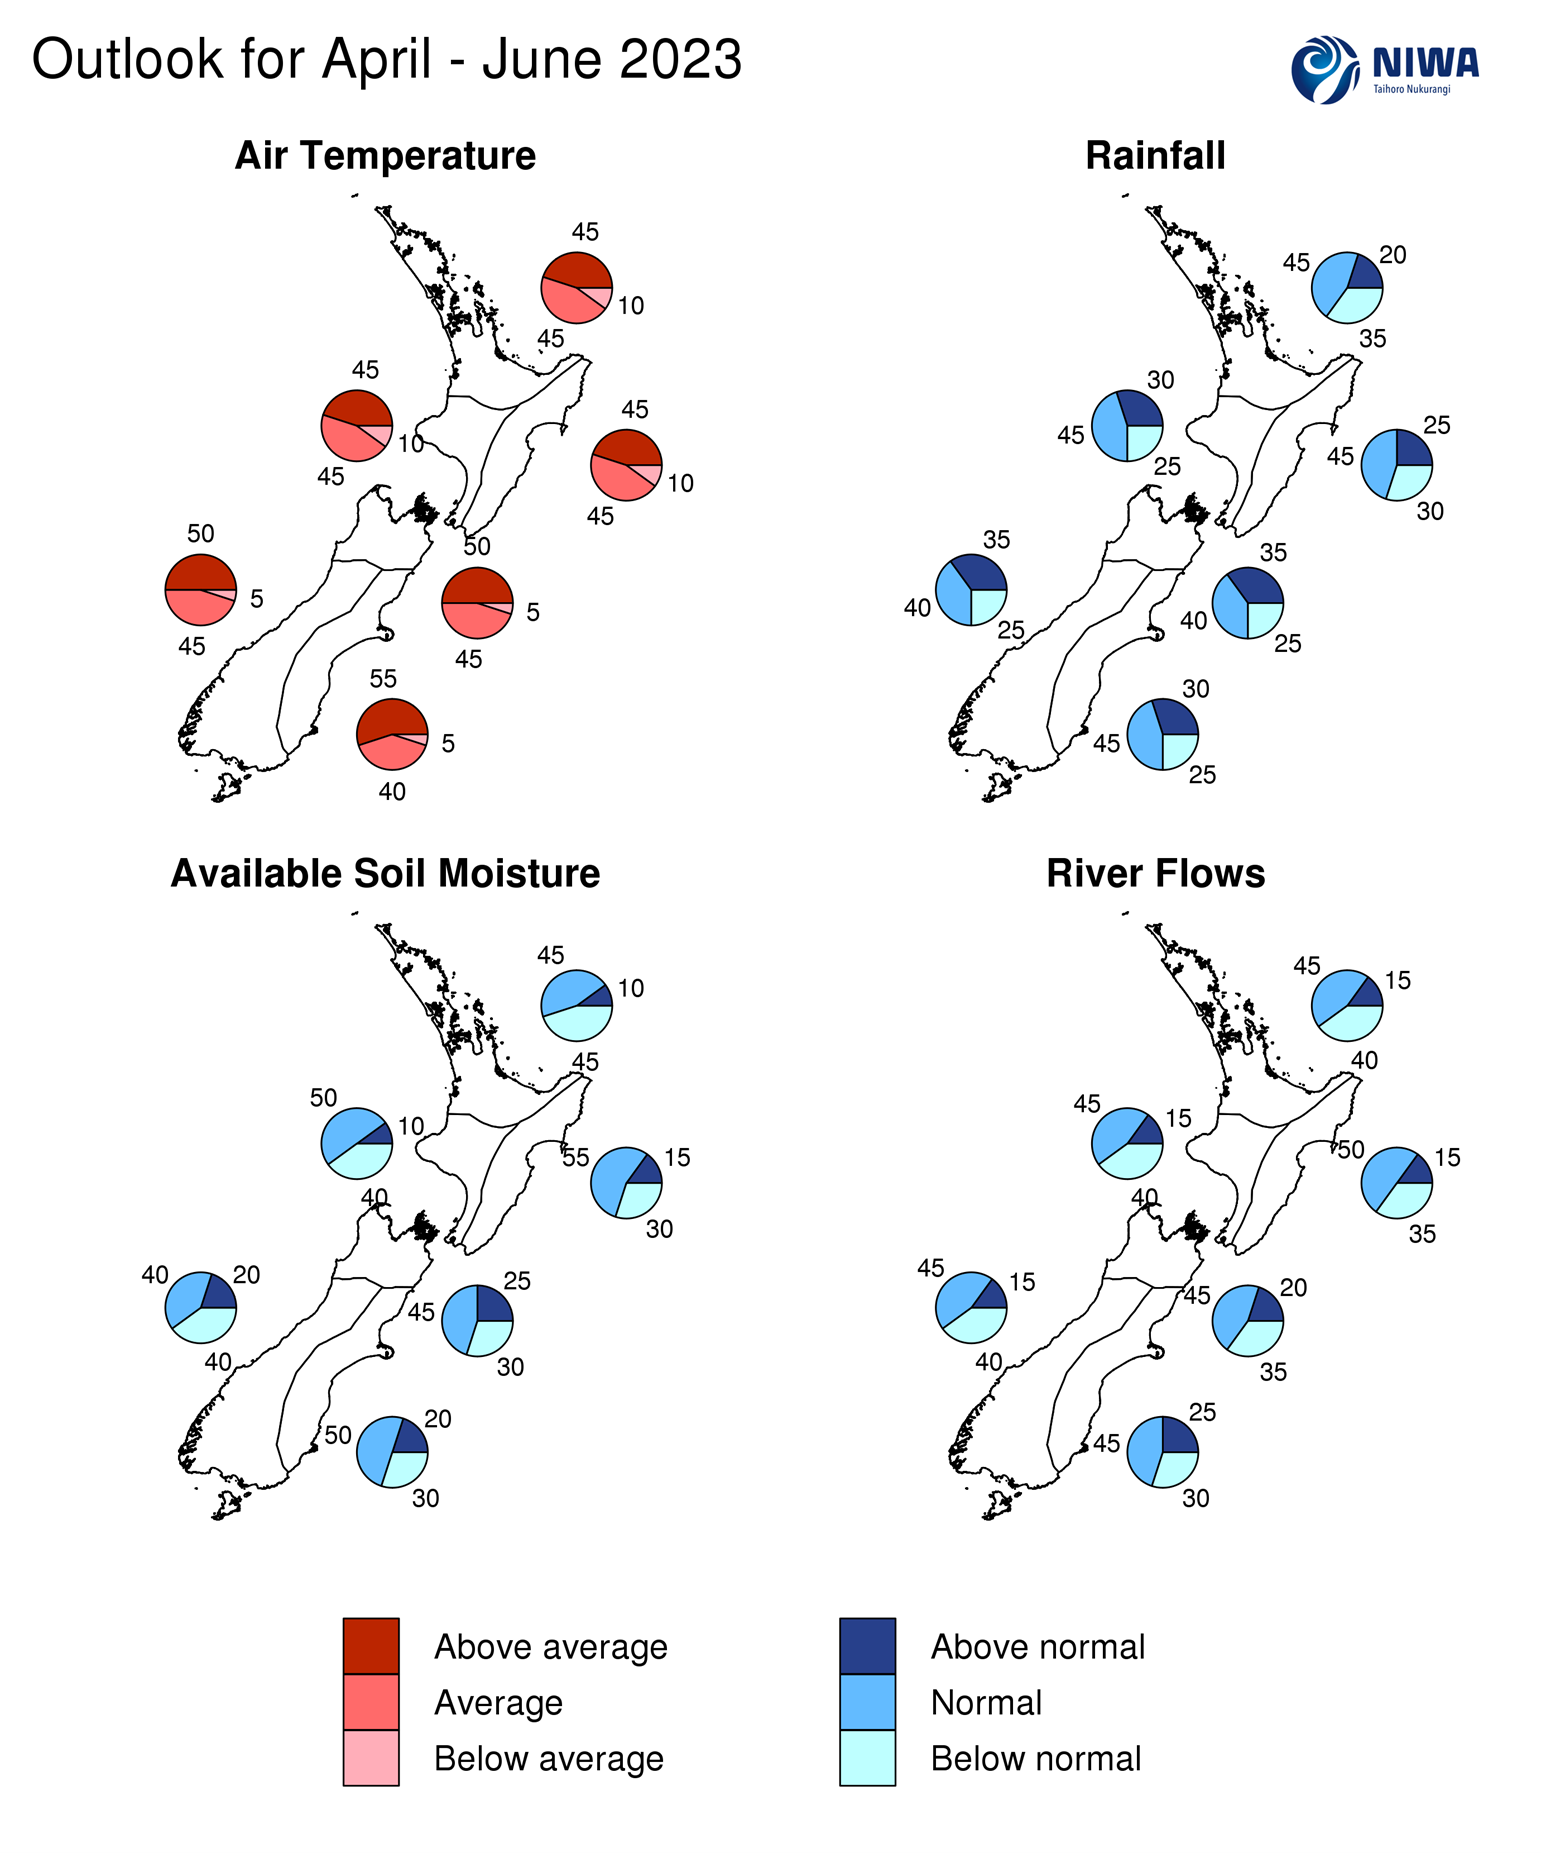
- Temperatures are equally likely to be near average or above average (45% chance each).
- Rainfall totals are most likely to be near normal (45% chance). A period of northerly winds in mid-April may increase the chance for heavy rainfall. Rainfall may tend lower than normal during early winter as southerly winds may become more common.
- Soil moisture levels and river flows are about equally likely to be near normal (45% chance) or below normal (40-45% chance).
The full probability breakdown is:
|
Temperature |
Rainfall |
Soil moisture |
River flows |
|
|
Above average |
45 |
20 |
10 |
15 |
|
Near average |
45 |
45 |
45 |
45 |
|
Below average |
10 |
35 |
45 |
40 |
Central North Island, Taranaki, Whanganui, Manawatu, Wellington
Probabilities are assigned in three categories: above average, near average, and below average.
- Temperatures are equally likely to be near average or above average (45% chance each).
- Rainfall totals are most likely to be near normal (45% chance). A period of northerly winds in mid-April may increase the chance for heavy rainfall.
- Soil moisture levels are most likely to be near normal (50% chance) while river flows are about equally likely to be near normal (45% chance) or below normal (40% chance).
The full probability breakdown is:
|
Temperature |
Rainfall |
Soil moisture |
River flows |
|
|
Above average |
45 |
30 |
10 |
15 |
|
Near average |
45 |
45 |
50 |
45 |
|
Below average |
10 |
25 |
40 |
40 |
Gisborne, Hawke’s Bay, Wairarapa
Probabilities are assigned in three categories: above average, near average, and below average.
- Temperatures are equally likely to be near average or above average (45% chance each).
- Rainfall totals are most likely to be near normal (45% chance). A period of northerly winds in mid-April may increase the chance for heavy rainfall.
- Soil moisture levels and river flows are most likely to be near normal (50-55% chance).
The full probability breakdown is:
|
Temperature |
Rainfall |
Soil moisture |
River flows |
|
|
Above average |
45 |
25 |
15 |
15 |
|
Near average |
45 |
45 |
55 |
50 |
|
Below average |
10 |
30 |
30 |
35 |
Tasman, Nelson, Marlborough, Buller
Probabilities are assigned in three categories: above average, near average, and below average.
- Temperatures are about equally likely to be near average (45% chance) or above average (50% chance). Above average SSTs will likely prevent long-lasting below average air temperatures.
- Rainfall totals are about equally likely to be near normal (40% chance) or above normal (35% chance). A period of northerly winds in mid- April may increase the chance for heavy rainfall.
- Soil moisture levels and river flows are most likely to be near normal (45% chance).
The full probability breakdown is:
|
Temperature |
Rainfall |
Soil moisture |
River flows |
|
|
Above average |
50 |
35 |
25 |
20 |
|
Near average |
45 |
40 |
45 |
45 |
|
Below average |
05 |
25 |
30 |
35 |
West Coast, Alps and foothills, inland Otago, Southland
Probabilities are assigned in three categories: above average, near average, and below average.
- Temperatures are about equally likely to be near average (45% chance) or above average (50% chance). Continued marine heatwave conditions will likely prevent long-lasting below average air temperatures.
- Rainfall totals are about equally likely to be near normal (40% chance) or above normal (35% chance). A period of northerly winds in mid-April may increase the chance for heavy rainfall.
- Soil moisture levels and river flows are about equally likely to be near normal (40-45% chance) or above normal (40% chance).
The full probability breakdown is:
|
Temperature |
Rainfall |
Soil moisture |
River flows |
|
|
Above average |
50 |
35 |
20 |
15 |
|
Near average |
45 |
40 |
40 |
45 |
|
Below average |
05 |
25 |
40 |
40 |
Coastal Canterbury, east Otago
Probabilities are assigned in three categories: above average, near average, and below average.
- Temperatures are most likely to be above average (55% chance). Continued marine heatwave conditions will likely prevent long-lasting below average air temperatures.
- Rainfall totals are most likely to be near normal (45% chance).
- Soil moisture levels and river flows are most likely to be near normal (45-50% chance).
The full probability breakdown is:
|
Temperature |
Rainfall |
Soil moisture |
River flows |
|
|
Above average |
55 |
30 |
20 |
25 |
|
Near average |
40 |
45 |
50 |
45 |
|
Below average |
05 |
25 |
30 |
30 |
Graphical representation of the regional probabilities
Background
The NINO3.4 Index anomaly (which covers the west-central equatorial Pacific) over the last month (through 29 March) was -0.03˚C (climatology: 1991-2020), in the ENSO-neutral range for the second consecutive month. The NINO 1+2 Index (eastern Pacific) continued its sharp warming trend, with the 30-day value reaching +1.51˚C – the highest since April 2017 (during the so-called South America coastal El Niño event). The eastern and central equatorial Pacific sea surface warmed markedly during March, giving real credence to a potential El Niño event developing as early as winter.
The March monthly Southern Oscillation Index (SOI) was neutral (0.0) and +0.7 from December-February (climatology: 1991-2020), the former in the neutral range and suggestive of a trend away from La Niña-like atmospheric patterns.
Importantly, trade wind strength was significantly reduced across the equatorial Pacific during March, owing to a westerly wind burst (WWB) during the first 10 days of the month. WWBs are a critical mechanism toward developing El Niño events.
The trade wind reduction was largest in the eastern part of the basin, which is also where the most substantial ocean warming took place. This was linked to the most unusually strong March Madden-Julian Oscillation (MJO) pulse in phase 8 since 2015 and before that, 1997. In both prior instances, strong El Niño conditions eventuated. April shows a continued reduction in trade wind strength in the east. During the middle part of the month, a reduction in trade wind strength is possible in the central part of the basin. Overall, this should support a continued warming trend in ocean temperatures during April, but with less sharpness than during March.
In the subsurface equatorial Pacific, dramatic warming occurred during March, with anomalies of 3˚C to 5˚C above average widespread in the east. In the central part of the basin near 150˚W, a downwelling oceanic Kelvin Wave was associated with a large, eastward-progressing area of warmer than average seas (3˚C to 5˚C above average). This feature may reach the eastern Pacific and move toward the ocean’s surface during the next two months. The sub-surface ocean is exhibiting a strong trend toward an El Niño event.
NIWA’s analysis indicates that ENSO-neutral conditions have an 80% chance of continuing through June. Thereafter, El Niño has a 65-70% chance of developing during winter and continuing through spring. The changes observed during March, as described above, support a continued progression toward El Niño thresholds. Because anomalous warmth is building in the surface and subsurface of the equatorial Pacific Ocean, there is a reduction of trade winds across the basin, and there is an expectation for these conditions to continue, NIWA’s ENSO criteria supports a move to “El Niño Watch”.
During March, convective forcing was dominated by the most anomalously strong Madden-Julian Oscillation (MJO) pulse in phase 8 during the month of March on record (since at least 1981). This was associated with anomalous rising air over South America and Africa, with anomalous sinking air over Indonesia and the Maritime Continent. This was in direct contrast to preceding seasons that largely had the opposite configuration; this change was associated with the very rapid demise of La Niña and a trend toward El Niño-like atmospheric patterns.
At the end of March, the MJO pulse was still active over the Indian Ocean and was moving toward the Maritime Continent.
During April, the MJO is forecast to move over the Maritime Continent and western Pacific for the first half of the month, more consistent with La Niña-like conditions. However, this variability is predicted to be short-lived; during the second half of April, rising air is forecast to build over the eastern Pacific and South America again, similar to what was observed during March.
There are signs that high-frequency tropical variability, via the MJO, will continue from late April into May, but the most persistent signals include rising air over the central and eastern Pacific, South America, and Africa, with sinking air over the eastern Indian Ocean and Maritime Continent. Overall, this is reflective of an atmosphere that is transitioning toward El Niño.
For New Zealand, phases 4-6 during April-June have historically brought more northerly quarter winds, which is consistent with the forecast expectation in the middle part of the month. This favours above normal rainfall for most regions of the country aside from the lower and western South Island, as well as above average temperatures.
As the MJO progression continues during April, the pattern may change again during the third or fourth week of the month, favouring southerly-quarter winds, less rain, and cooler temperatures.
May shows an MJO progression across phases 6-7-8-1, which would assist with the continued development of El Niño and support changeable weather patterns through the month. During periods of El Niño-like intraseasonal variability, southerlies and westerlies would be favoured.
The Southern Annular Mode (SAM) was negative for the first two weeks of March, with the index having its lowest March daily value since 2017, and before that 2002, on the 10th of the month. A negative SAM is signalled in early April with low pressure in the Tasman Sea. During the season ahead, ENSO-neutral conditions that transition toward El Niño may influence a SAM that is more frequently negative.
New Zealand’s coastal water temperatures remained above average during March, with the most significant anomalies observed near the South Island. For the east of the South Island, SSTs were the warmest on record for the month of March. Although southerly quarter air flows are forecast to become more common as winter approaches, above average SSTs may prevent long-lasting below average air temperatures. For more information, see the NIWA Sea Surface Temperature Update.
NZ 30-day coastal SST anomalies (to 29 March)
|
North NI |
+0.65˚C |
|
West NI |
+0.76˚C |
|
East NI |
+0.58˚C |
|
North SI |
+1.23˚C |
|
West SI |
+2.03˚C |
|
East SI |
+1.92˚C |

Forecast Confidence
Temperature
|
Forecast confidence for temperatures is medium to high. While a colder than average season is unlikely due to the persistence of warmer than average sea temperatures, more variable circulation and wind patterns will lead to more variable temperatures across New Zealand. Should El Niño arrive, it could result in cooler winter temperatures, particularly relative to recent record warm winters. |
Rainfall
|
Forecast confidence for rainfall is low to medium. The end of La Niña means that New Zealand’s climatic variability will be driven by other factors. This will lead to mixed wind flows and more changeable weather patterns, unlike recent seasons during which easterlies were more dominant. The net effect is less certainty in the rainfall outlook. |
