Outlook Summary
- ENSO-neutral conditions continued during March 2020. The Southern Oscillation Index (SOI) (-0.5) was within the neutral range while sea surface temperatures (SSTs) in the central Pacific were also in the neutral range.
- Oceanic ENSO-neutral conditions will very likely persist (81% chance) over the next three months.
- Even with oceanic ENSO-neutral conditions, the atmosphere is expected to lean in an El Niño-like direction during April-June, resulting in more westerly quarter air flows than normal.
- Warmer than average ocean waters in the Coral Sea and west-central Pacific Ocean are expected to have some influence on New Zealand’s climate in the first half of the three month period.
- April – June 2020 air pressure is forecast to be lower than normal near and south of New Zealand with above normal sea level pressure near and northwest of the country. This set-up is expected to be associated with a westerly quarter air flow anomaly.
- Temperatures are about equally likely to be above average or near average for most of New Zealand, except the west of the South Island where April-June temperatures are most likely to be near average. Cold snaps and frosts are likely to occur as the three-month period progresses.
- With a westerly quarter air flow, New Zealand may be more exposed to fronts and more frequent temperature changes, particularly the South Island.
- Rainfall is most likely to be near normal for the west of the North Island as well as the north and east of the South Island. Rainfall is about equally likely to be near normal or below normal in the north and east of the North Island and about equally likely to be above normal or near normal for the west of the South Island.
- The tropical southwest Pacific is expected to become active during the first 10 days of April. The latest indications are that cyclone activity will not affect New Zealand. The cyclone season ends on 30 April.
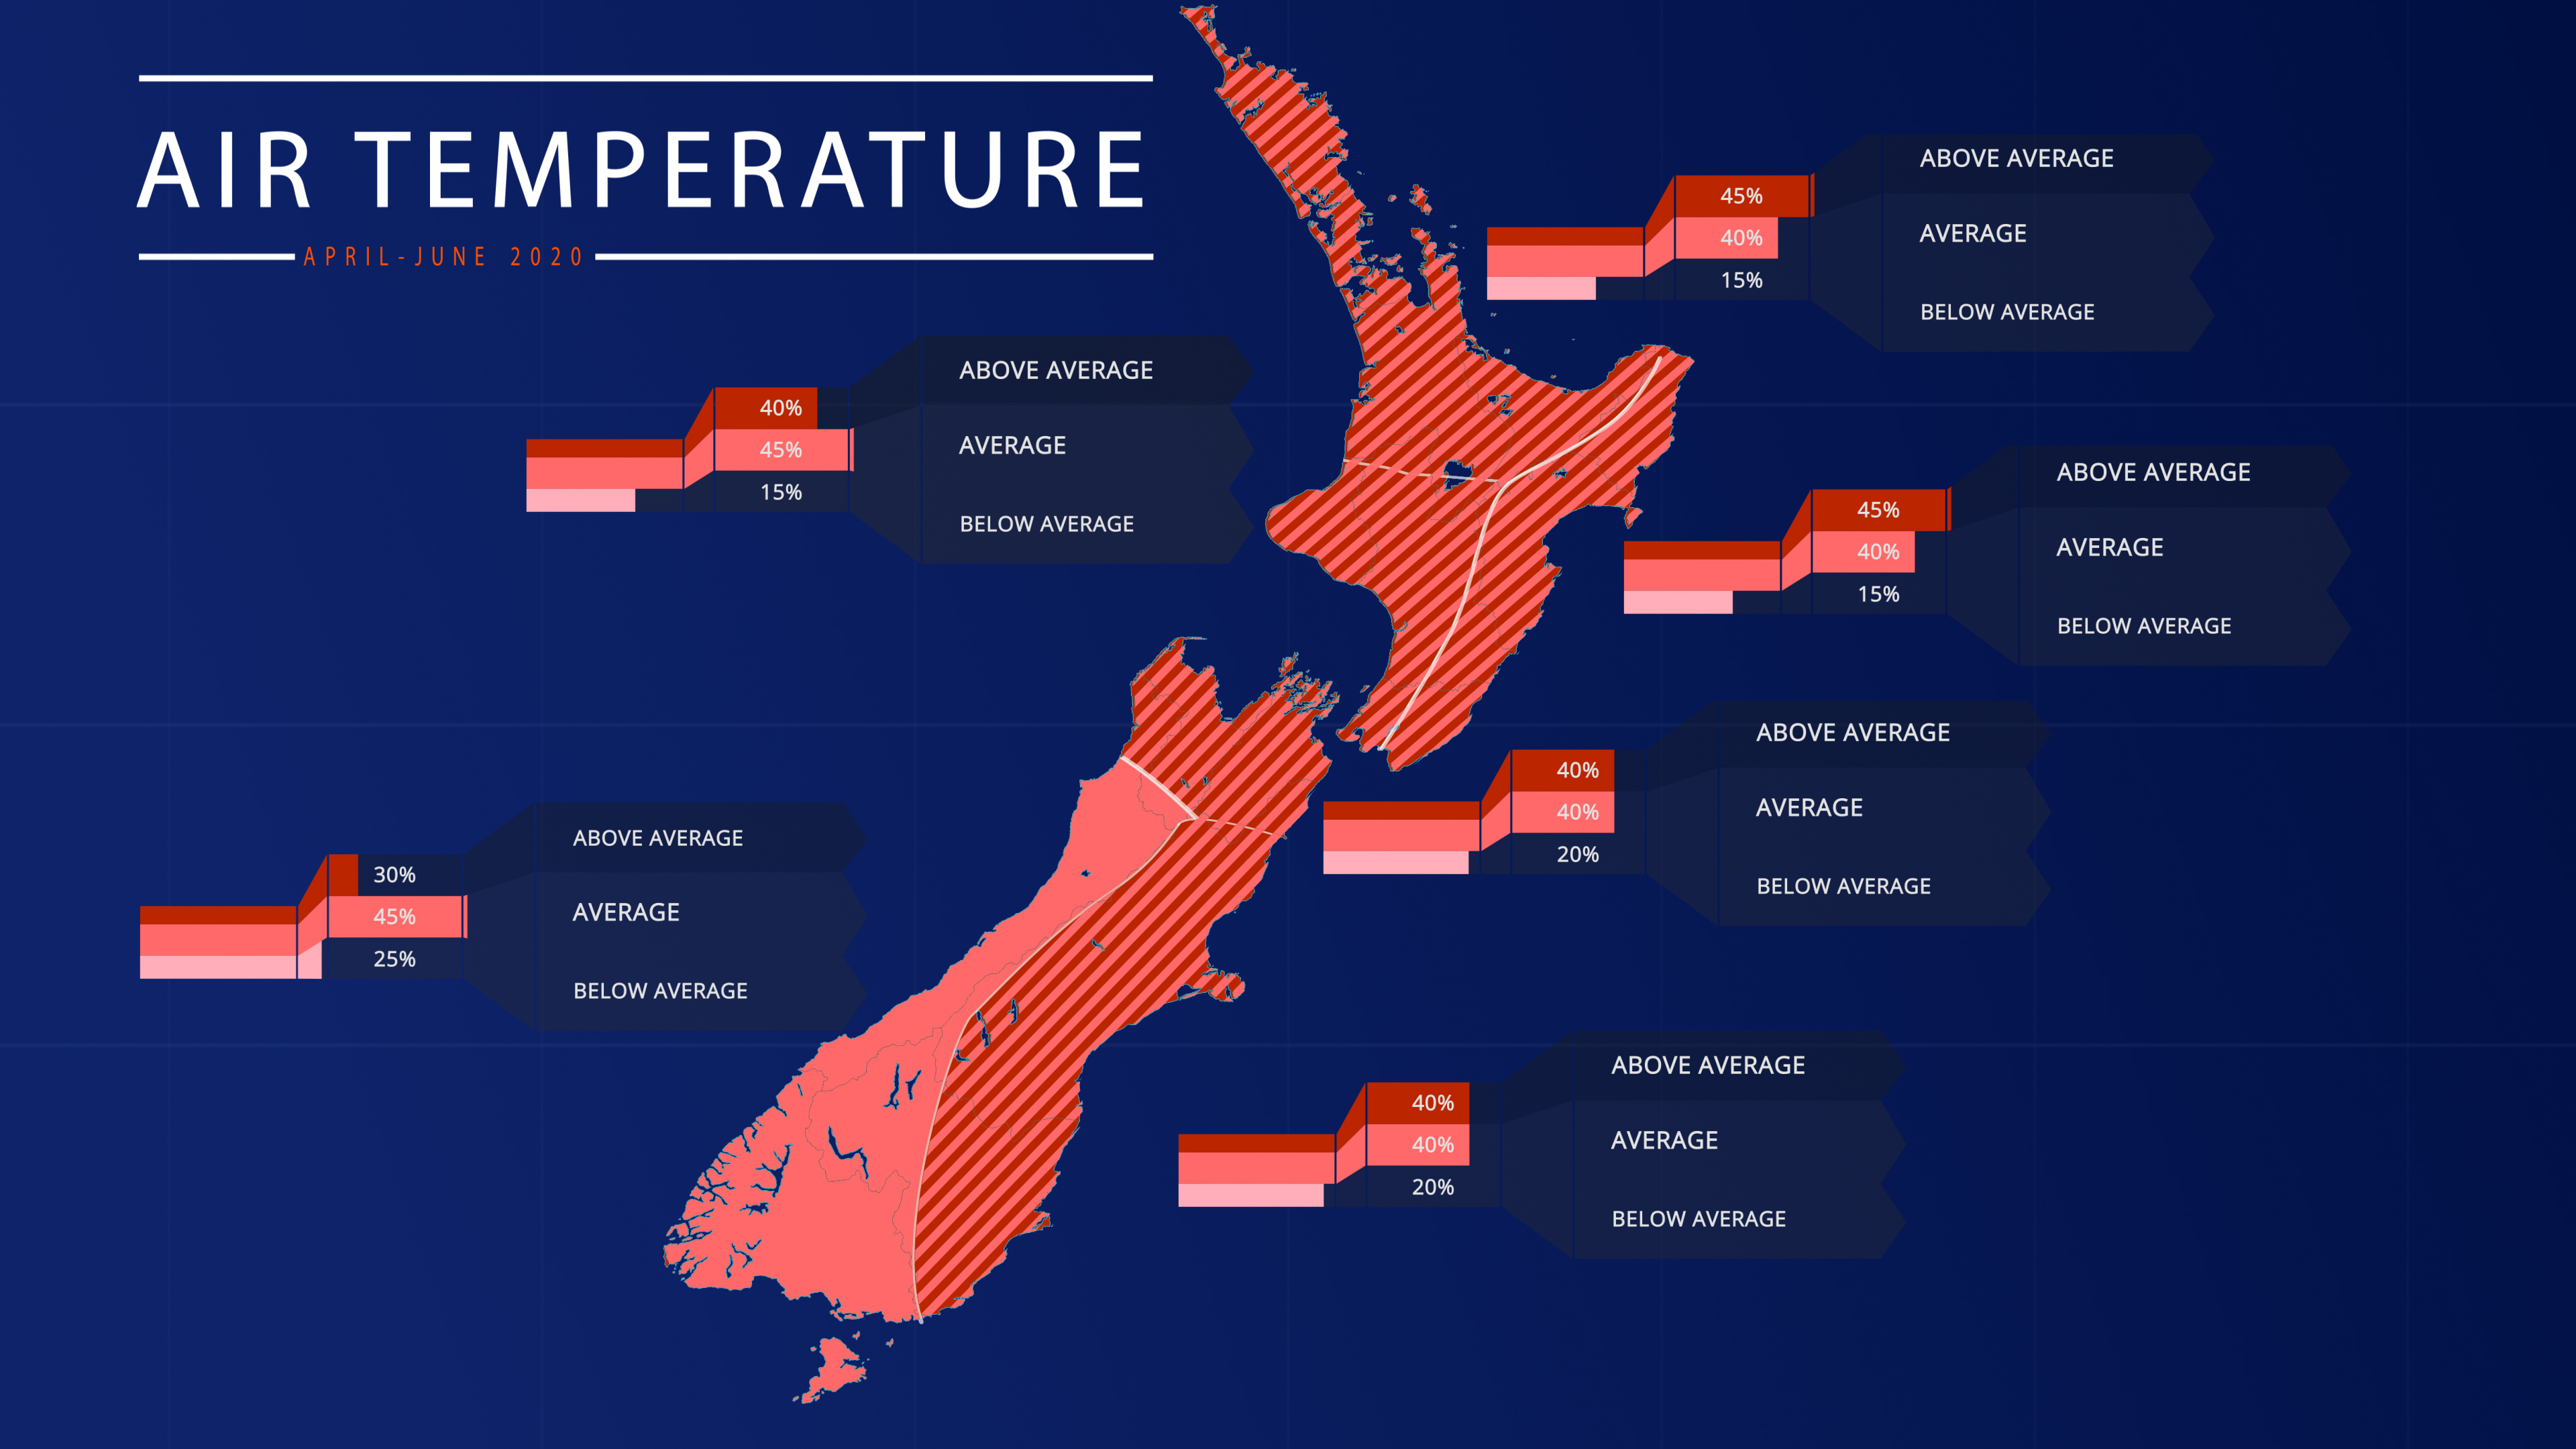
Air Temperature
April – June 2020 temperatures are most likely to be near average in the west of the South Island (45% chance). The remainder of the country is about equally likely to be above average (40-45% chance) or near average (40-45% chance).
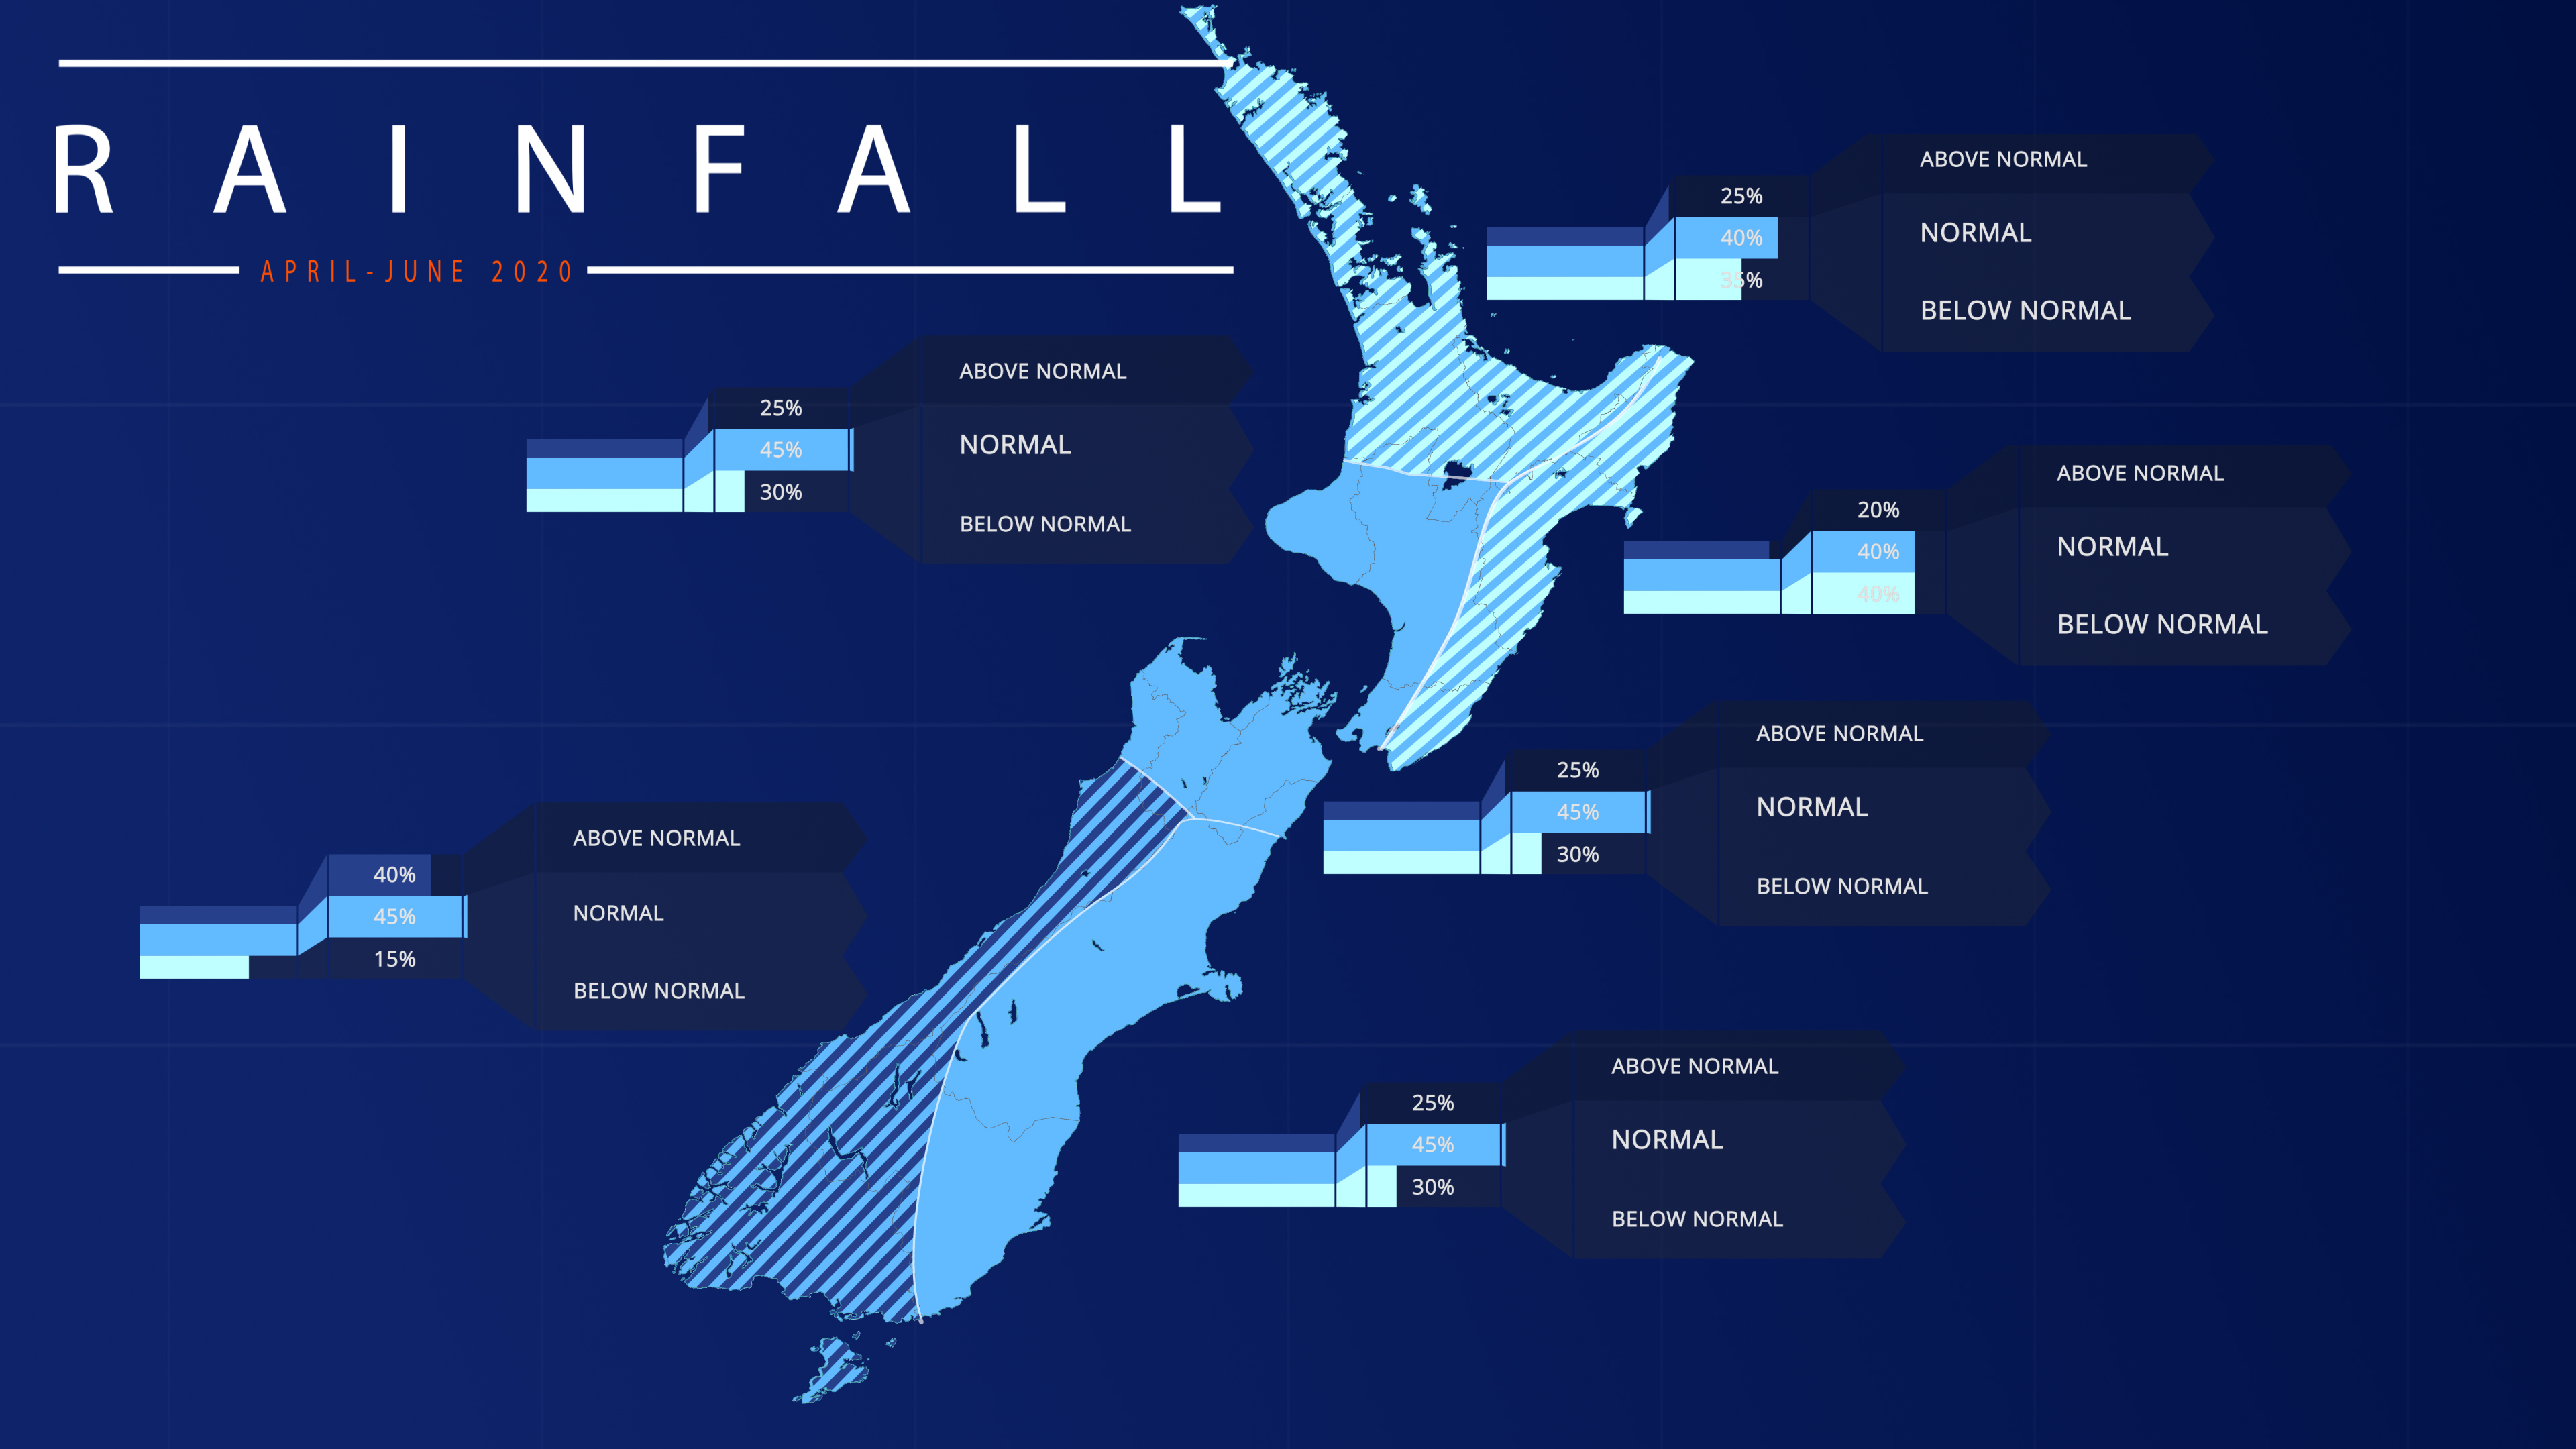
Rainfall
April – June 2020 rainfall is most likely to be near normal (45% chance) for the west of the North Island as well as the north and east of the South Island. Rainfall is about equally likely to be near normal (40% chance) or below normal (35-40% chance) in the north and east of the North Island. Rainfall is about equally likely to be above normal (40% chance) or near normal (45% chance) for the west of the South Island.
Soil Moisture
April – June 2020 soil moisture and river flows are most likely to be near normal (45% chance) for the west of the South Island. For the remainder of New Zealand, there are equal chances for soil moisture levels and river flows to be below normal (35-40% chance) or near normal (40% chance).
Regional predictions for April – June 2020
Northland, Auckland, Waikato, Bay of Plenty
The table below shows the probabilities (or percent chances) for each of three categories: above average, near average, and below average. In the absence of any forecast guidance there would be an equal likelihood (33% chance) of the outcome being in any one of the three categories. Forecast information from local and global guidance models is used to indicate the deviation from equal chance expected for the coming three-month period, with the following outcomes the most likely (but not certain) for this region:
- Temperatures are about equally likely to be above average (45% chance) or near average (40% chance).
- Rainfall totals are about equally likely to be below normal (35% chance) or near normal (40% chance).
- Soil moisture levels and river flows are equally likely to be below normal (40% chance) or near normal (40% chance).
The full probability breakdown is:
|
Temperature |
Rainfall |
Soil moisture |
River flows |
|
|
Above average |
45 |
25 |
20 |
20 |
|
Near average |
40 |
40 |
40 |
40 |
|
Below average |
15 |
35 |
40 |
40 |
Central North Island, Taranaki, Whanganui, Manawatu, Wellington
Probabilities are assigned in three categories: above average, near average, and below average.
- Temperatures are about equally likely to be above average (40% chance) or near average (45% chance).
- Rainfall totals are most likely to be near normal (45% chance).
- Soil moisture levels and river flows are equally likely to be below normal (40% chance) or near normal (40% chance).
The full probability breakdown is:
|
Temperature |
Rainfall |
Soil moisture |
River flows |
|
|
Above average |
40 |
25 |
20 |
20 |
|
Near average |
45 |
45 |
40 |
40 |
|
Below average |
15 |
30 |
40 |
40 |
Gisborne, Hawke’s Bay, Wairarapa
Probabilities are assigned in three categories: above average, near average, and below average.
- Temperatures are about equally likely to be above average (45% chance) or near average (40% chance).
- Rainfall totals are equally likely to be below normal or near normal (40% chance).
- Soil moisture levels and river flows are equally likely to be below normal or near normal (40% chance).
The full probability breakdown is:
|
Temperature |
Rainfall |
Soil moisture |
River flows |
|
|
Above average |
45 |
20 |
20 |
20 |
|
Near average |
40 |
40 |
40 |
40 |
|
Below average |
15 |
40 |
40 |
40 |
Tasman, Nelson, Marlborough, Buller
Probabilities are assigned in three categories: above average, near average, and below average.
- Temperatures are equally likely to be near average (40% chance) or above average (40% chance).
- Rainfall totals are most likely to be near normal (45% chance).
- Soil moisture levels and river flows are about equally likely to be below normal (35-40% chance) or near normal (40% chance).
The full probability breakdown is:
|
Temperature |
Rainfall |
Soil moisture |
River flows |
|
|
Above average |
40 |
25 |
20 |
20 |
|
Near average |
40 |
45 |
40 |
40 |
|
Below average |
20 |
30 |
35 |
40 |
West Coast, Alps and foothills, inland Otago, Southland
Probabilities are assigned in three categories: above average, near average, and below average.
- Temperatures are most likely to be near average (45% chance).
- Rainfall totals are about equally likely to be above normal (40% chance) or near normal (45% chance).
- Soil moisture levels and river flows are most likely to be in the near normal range (45% chance).
The full probability breakdown is:
|
Temperature |
Rainfall |
Soil moisture |
River flows |
|
|
Above average |
30 |
40 |
25 |
25 |
|
Near average |
45 |
45 |
45 |
45 |
|
Below average |
25 |
15 |
30 |
30 |
Coastal Canterbury, east Otago
Probabilities are assigned in three categories: above average, near average, and below average.
- Temperatures are equally likely to be above average (40% chance) or near average (40% chance).
- Rainfall totals are most likely to be in the near normal range (45% chance).
- Soil moisture levels and river flows are equally likely to be below normal (40% chance) or near normal (40% chance).
The full probability breakdown is:
|
Temperature |
Rainfall |
Soil moisture |
River flows |
|
|
Above average |
40 |
25 |
25 |
20 |
|
Near average |
40 |
45 |
40 |
40 |
|
Below average |
20 |
30 |
35 |
40 |
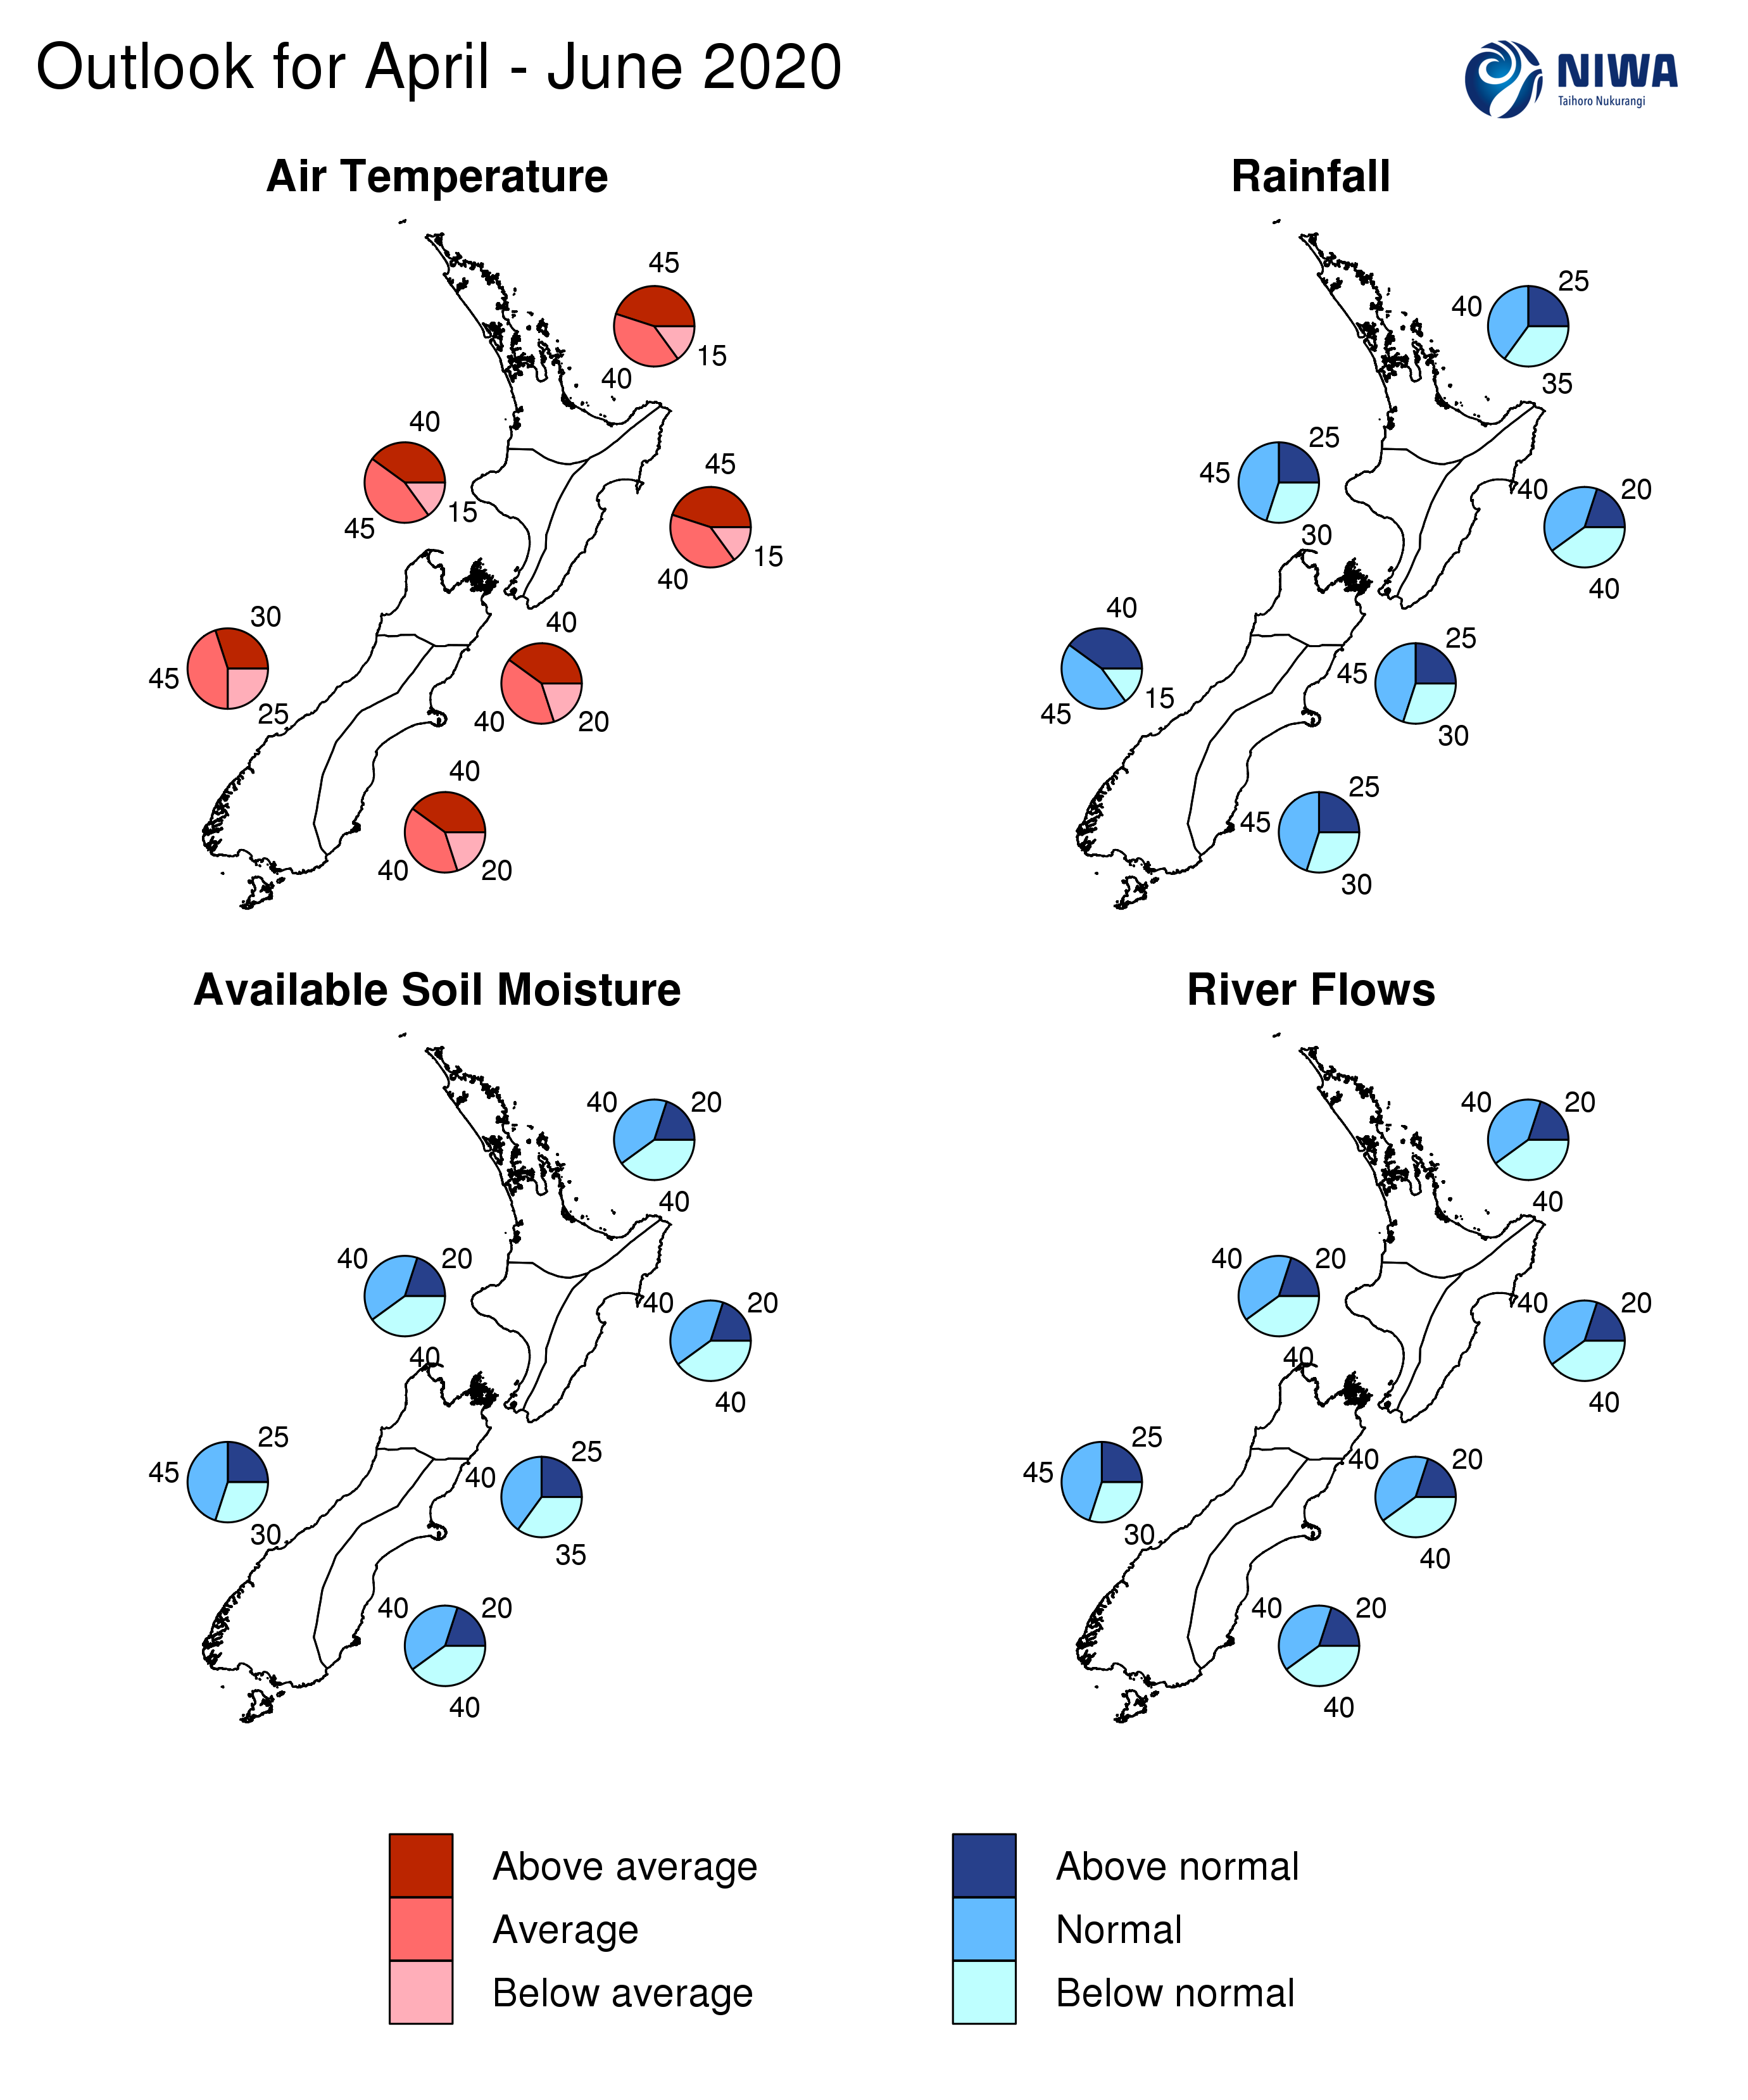
Graphical representation of the regional probabilities
Background
The NINO3.4 Index anomaly (in the central Pacific) for March 2020 (to the 29th) was +0.39˚C (in the neutral range). The warmest ocean waters, with respect to average, continued to be located in the west-central Pacific, with the NINO4 region recording a monthly value of +0.69˚C. However, this was only marginally above the +0.66˚C recorded in the NINO1+2 region (far eastern equatorial Pacific).
During March 2020, upper-oceanic heat content near the International Date Line decreased, while it increased farther east from about 140°W to 110°W. It is this warm pool of water, in the tropical north Pacific, that is expected to become a focal point for rainfall and convection during April-June. This pattern has historically been associated with more westerly quarter air flows for New Zealand.
Trade winds in March were weaker than normal east of the International Date Line from near 160°W to 110°W. Enhanced trade winds were present from the Date Line to about 160°E. For most of April, enhanced trade winds (i.e. stronger than normal) are forecast to occur in the east-central Pacific with weaker than normal trades in the west-central part of the basin during the first half of the month. This will most likely lead to the persistence of the current SST pattern.
According to the consensus from international models, ENSO-neutral conditions are very likely (81% chance) for the April–June period. For the July–September and October–December periods respectively, the probability for ENSO-neutral conditions is 53% and 38% with the probability for La Niña increasing to 35% by October–December.
During March, New Zealand’s coastal water temperatures were mostly above average, with a majority of regions seeing a larger (positive) anomaly compared to February. SSTs remained above average over much of the Tasman and Coral seas.
New Zealand Coastal Sea Surface Temperatures during March 2020 (to the 29th):
|
North NI |
West NI |
East NI |
North SI |
West SI |
East SI |
|
+0.62˚C |
+0.09˚C |
+0.50˚C |
+0.33˚C |
+0.96˚C |
+0.44˚C |
The Southern Annular Mode (SAM) was positive for nearly all of March with New Zealand’s weather seeing an influence from both the tropics and high latitudes. A trend towards neutral or slightly negative values is forecast to begin the month of April. An unsettled Tasman Sea is possible from the end of the first week of April through mid-month, which is consistent with a negative SAM.
The Madden Julian Oscillation (MJO) was convectively active over the Maritime Continent and far western Pacific (phases 3-6) during March, in addition to the Indian Ocean (phases 1-2). This was associated with the formation of one tropical cyclone in the Southwest Pacific (Gretel). For the month of April, a relatively brief period of enhanced tropical convection is forecast in the west Pacific during week one and could be associated with the formation of a tropical cyclone. Thereafter convection is forecast to be suppressed over the Maritime Continent and western Pacific Ocean but active in the eastern Pacific and over South America (El Niño-like). There are indications that west Pacific and/or Maritime Continent regions may become more convectively active toward the end of April. During periods of heightened convection in the west Pacific or Maritime Continent, the threat for tropical or sub-tropical cyclones are elevated in the Coral Sea and north of New Zealand. Furthermore, this increases the odds for significant rainfall events to occur in New Zealand.
Forecast Confidence
Temperature
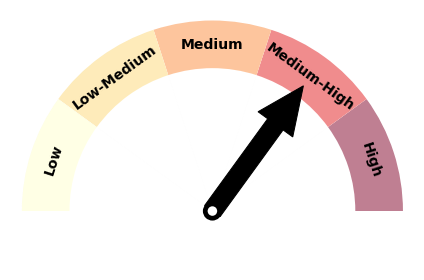
|
Forecast confidence for temperature is medium to high. While the absence of a strong climate driver presents some uncertainty, the signal for a lack of southerly winds provides increased confidence that seasonal temperatures, as a whole, will not be below average. |
Rainfall
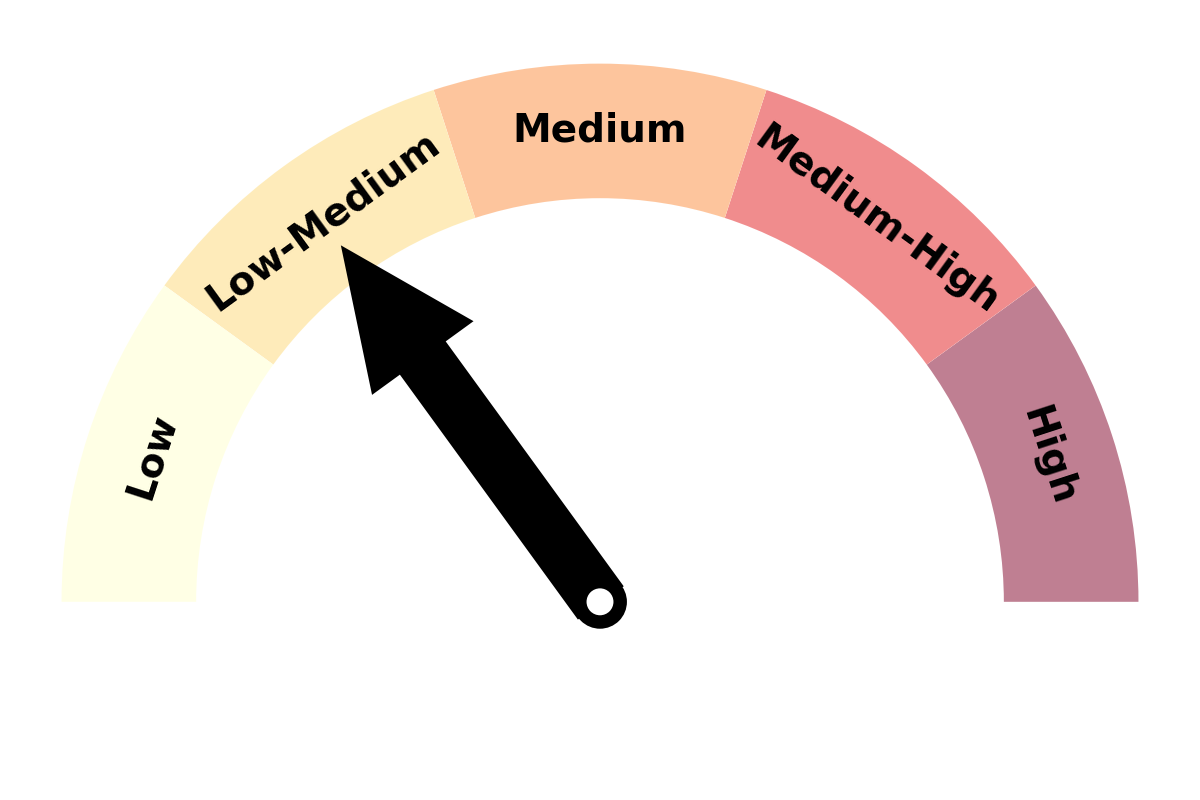
|
Forecast confidence for rainfall is low to medium. The lack of strong climate drivers (ENSO-neutral, variable SAM, unclear tropical influence) makes this a particularly challenging forecast. Additionally, an inordinate number of dynamical guidance indicates equal chances for above, near or below normal rainfall (climatology). |
