Outlook Summary
- The atmospheric imprint of La Niña continues to be strong; the Southern Oscillation Index during April is tracking to become the 3rd-highest April value on record since at least 1876.
- Air pressure is forecast to be higher than normal to the east and lower than normal to the northwest of the country, causing more easterly quarter winds than normal. A continued reduction in westerly quarter winds is expected.
- Rainfall is about equally likely to be near normal or below normal in the west of the North Island and north and east of the South Island, near or above normal in the north and east of the North Island, and near normal in the west of the South Island.
- Seasonal rainfall patterns may continue to be irregular with heavy rainfall events and the potential for flooding interspersed with longer dry spells.
- Temperatures are very likely to be warmer than average in the North Island and west of the South Island and about equally likely to be near average or above average in the north and east of the South Island. Marine heatwave conditions will likely delay the seasonal transition to cooler temperatures, frosts, and the potential for snowfall.
- Around the country, sea surface temperatures ranged from 0.3˚C to 2.7˚C above average during April. For more information, see the background.
- Soil moisture levels and river flows most likely to be below normal in the west of the North Island, near normal in the east of both islands, and about equally likely to be near normal or below normal in all other regions.


Regional predictions for May – July 2022
Northland, Auckland, Waikato, Bay of Plenty
The table below shows the probabilities (or percent chances) for each of three categories: above average, near average, and below average. In the absence of any forecast guidance there would be an equal likelihood (33% chance) of the outcome being in any one of the three categories. Forecast information from local and global guidance models is used to indicate the deviation from equal chance expected for the coming three-month period, with the following outcomes the most likely (but not certain) for this region:
- Temperatures are very likely to be above average (70% chance). Marine heatwave conditions will likely continue to delay the seasonal transition to cooler temperatures.
- Rainfall totals are about equally likely to be near normal (40% chance) or above normal (35% chance). Relatively longer dry spells may continue, interspersed with heavy rainfall events.
- Soil moisture levels and river flows are about equally likely to be near normal (40% chance) or below normal (40% chance).
The full probability breakdown is:
|
Temperature |
Rainfall |
Soil moisture |
River flows |
|
|
Above average |
70 |
35 |
20 |
20 |
|
Near average |
25 |
40 |
40 |
40 |
|
Below average |
05 |
25 |
40 |
40 |
Central North Island, Taranaki, Whanganui, Manawatu, Wellington
Probabilities are assigned in three categories: above average, near average, and below average.
- Temperatures are very likely to be above average (65% chance). Marine heatwave conditions will likely continue to delay the seasonal transition to cooler temperatures.
- Rainfall is about equally likely to be near normal (40% chance) or below normal (35% chance).
- Soil moisture levels and river flows are most likely to be below normal (50% chance).
The full probability breakdown is:
|
Temperature |
Rainfall |
Soil moisture |
River flows |
|
|
Above average |
65 |
25 |
10 |
10 |
|
Near average |
30 |
40 |
40 |
40 |
|
Below average |
05 |
35 |
50 |
50 |
Gisborne, Hawke’s Bay, Wairarapa
Probabilities are assigned in three categories: above average, near average, and below average.
- Temperatures are about equally likely to be above average (60% chance) or near average (35% chance).
- Rainfall totals are about equally likely to be near normal (40% chance) or above normal (35% chance each). Seasonal rainfall patterns may continue to be irregular with longer dry spells interspersed with heavy rainfall events and the potential for flooding.
- Soil moisture levels and river flows are most likely to be near normal (45% chance).
The full probability breakdown is:
|
Temperature |
Rainfall |
Soil moisture |
River flows |
|
|
Above average |
60 |
35 |
30 |
30 |
|
Near average |
35 |
40 |
45 |
45 |
|
Below average |
05 |
25 |
25 |
25 |
Tasman, Nelson, Marlborough, Buller
Probabilities are assigned in three categories: above average, near average, and below average.
- Temperatures are about equally likely to be above average (50% chance) or near average (45% chance).
- Rainfall is about equally likely to be near normal (40% chance) or below normal (35% chance).
- Soil moisture levels and river flows are about equally likely to be below normal (45% chance) or near normal (40% chance).
The full probability breakdown is:
|
Temperature |
Rainfall |
Soil moisture |
River flows |
|
|
Above average |
50 |
25 |
15 |
15 |
|
Near average |
45 |
40 |
40 |
40 |
|
Below average |
05 |
35 |
45 |
45 |
West Coast, Alps and foothills, inland Otago, Southland
Probabilities are assigned in three categories: above average, near average, and below average.
- Temperatures are very likely to be above average (65% chance). Marine heatwave conditions will likely continue to delay the seasonal transition to cooler temperatures.
- Rainfall totals are most likely to be near normal (45% chance). Seasonal rainfall patterns may continue to be irregular with longer dry spells interspersed with heavy rainfall events.
- Soil moisture levels and river flows are equally likely to be near normal (40% chance) or below normal (40% chance).
The full probability breakdown is:
|
Temperature |
Rainfall |
Soil moisture |
River flows |
|
|
Above average |
65 |
25 |
20 |
20 |
|
Near average |
30 |
45 |
40 |
40 |
|
Below average |
05 |
30 |
40 |
40 |
Coastal Canterbury, east Otago
Probabilities are assigned in three categories: above average, near average, and below average.
- Temperatures are about equally likely to be above average (50% chance) or near average (45% chance).
- Rainfall is about equally likely to be near normal (40% chance) or below normal (35% chance).
- Soil moisture levels and river flows are most likely to be near normal (45% chance).
The full probability breakdown is:
|
Temperature |
Rainfall |
Soil moisture |
River flows |
|
|
Above average |
50 |
25 |
20 |
20 |
|
Near average |
45 |
40 |
45 |
45 |
|
Below average |
05 |
35 |
35 |
35 |
Graphical representation of the regional probabilities

Background
The NINO3.4 Index anomaly (in the central Pacific) over the last month (through 24 April) was -0.66˚C, near the La Niña threshold. The provisional April monthly Southern Oscillation Index (SOI) was +2.3, the 3rd-highest April value on record since at least 1876 (only April 1904 and 2011 were higher) and around the 20th-highest monthly value on record overall. This suggests that La Niña is still very much influencing global atmospheric patterns.
In the subsurface equatorial Pacific, cooler than average waters were present in the east below 50 m depth and above 50 m depth in the central and west. A narrow layer of warmer than average water was present just below the surface in the eastern Pacific. If this were to surface over the next month, it could lead to a slight warming in the NINO 1 and 2 regions. In the western Pacific, a warm pool of water intensified at depth (below 100 m) during April. These signatures were reflected in upper-oceanic heat content (OHC). OHC was below normal in the central and eastern Pacific and above normal west of the International Date Line, consistent with continued oceanic La Niña.
Trade winds were stronger than normal during April except for an area west of Central America. Enhanced trade winds are forecast to continue from May into June, particularly in the central Pacific, likely allowing for the persistence of La Niña conditions.
Taking these factors into account, La Niña conditions are favoured to continue during May-July (60% chance). Between August-October, there is a 50% chance for La Niña and 45% for neutral conditions. During November-January, La Niña is favoured at around 50%. Should La Niña persist through or redevelop by summer 2022-23, the current event would qualify as a “triple-dip”. Since 1950, there have only been two other “triple-dip” (i.e. three consecutive) La Niña events: 1998-2000 and 1973-1975.
During April, convective forcing focused over the western Pacific and Africa. There was a combination of forcing from the Madden Julian Oscillation (MJO), higher frequency atmospheric Kelvin Waves, and the low frequency imprint of La Niña. The May-June period looks to be influenced by a mixture of low and high frequency forcing.
In early May, the MJO is forecast to turn active over the Indian Ocean while a Kelvin Wave crosses the Pacific. The latter may result in a change away from higher than normal air pressure and toward wetter conditions during the second week of the month, followed by a return to higher pressure.
During the final week to ten days of May, Maritime Continent forcing resembling phases 3-5 of the MJO may emerge. These phases have historically been associated with wetter and warmer conditions across New Zealand.
By mid-June, there is a sign that forcing will migrate toward the eastern Pacific, the Americas, and Africa (phases 8 and 1). Phase 8 has historically been associated with high pressure over the South Island during winter and phase 1 with more westerly winds across the country.
The Southern Annular Mode (SAM) spent more time in its positive phase during April. While there will be some variability during May, a continued tendency for positive values is expected.
New Zealand’s coastal water temperatures remained above average during April, with anomaly values increasing in all regions except the western South Island. Marine heatwave conditions were occurring in all regions except the eastern North Island at the end of the month. Model guidance remains consistent in its expectation for above average sea surface temperatures over the next three to six months. For more information, see the NIWA Sea Surface Temperature Update.
NZ coastal SST anomalies (through 27 April)
|
North NI |
1.66˚C |
|
West NI |
1.43˚C |
|
East NI |
0.34˚C |
|
North SI |
1.78˚C |
|
West SI |
2.65˚C |
|
East SI |
1.75˚C |

Forecast Confidence
Temperature
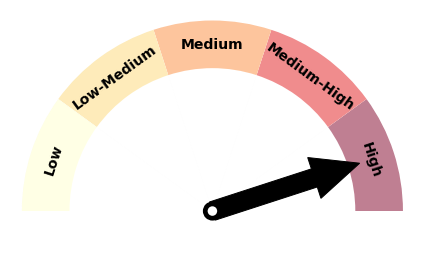
|
Forecast confidence for temperatures is high. The persistence of marine heatwave and La Niña conditions is expected to continue to have an upward influence on air temperatures, delaying the seasonal transition to cooler temperatures. Most of the climate models that NIWA surveys indicate a warmer than average May-July with a lack of southerly air flows. |
Rainfall
|
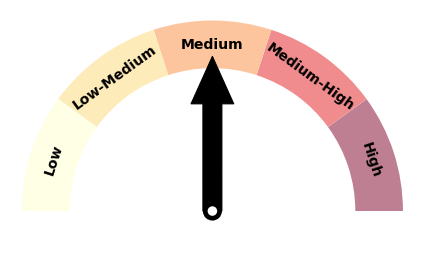
|
Forecast confidence for rainfall is medium. A reduction in the typical westerly winds will likely continue, which is forecast to influence longer dry periods about the west of both islands in particular. Periodic heavy rainfall events are also likely, which may increase the risk for flooding in some regions, particularly in the north and east. Overall, the country should continue to remain prepared for extremes – both wet and dry. |
