Outlook Summary
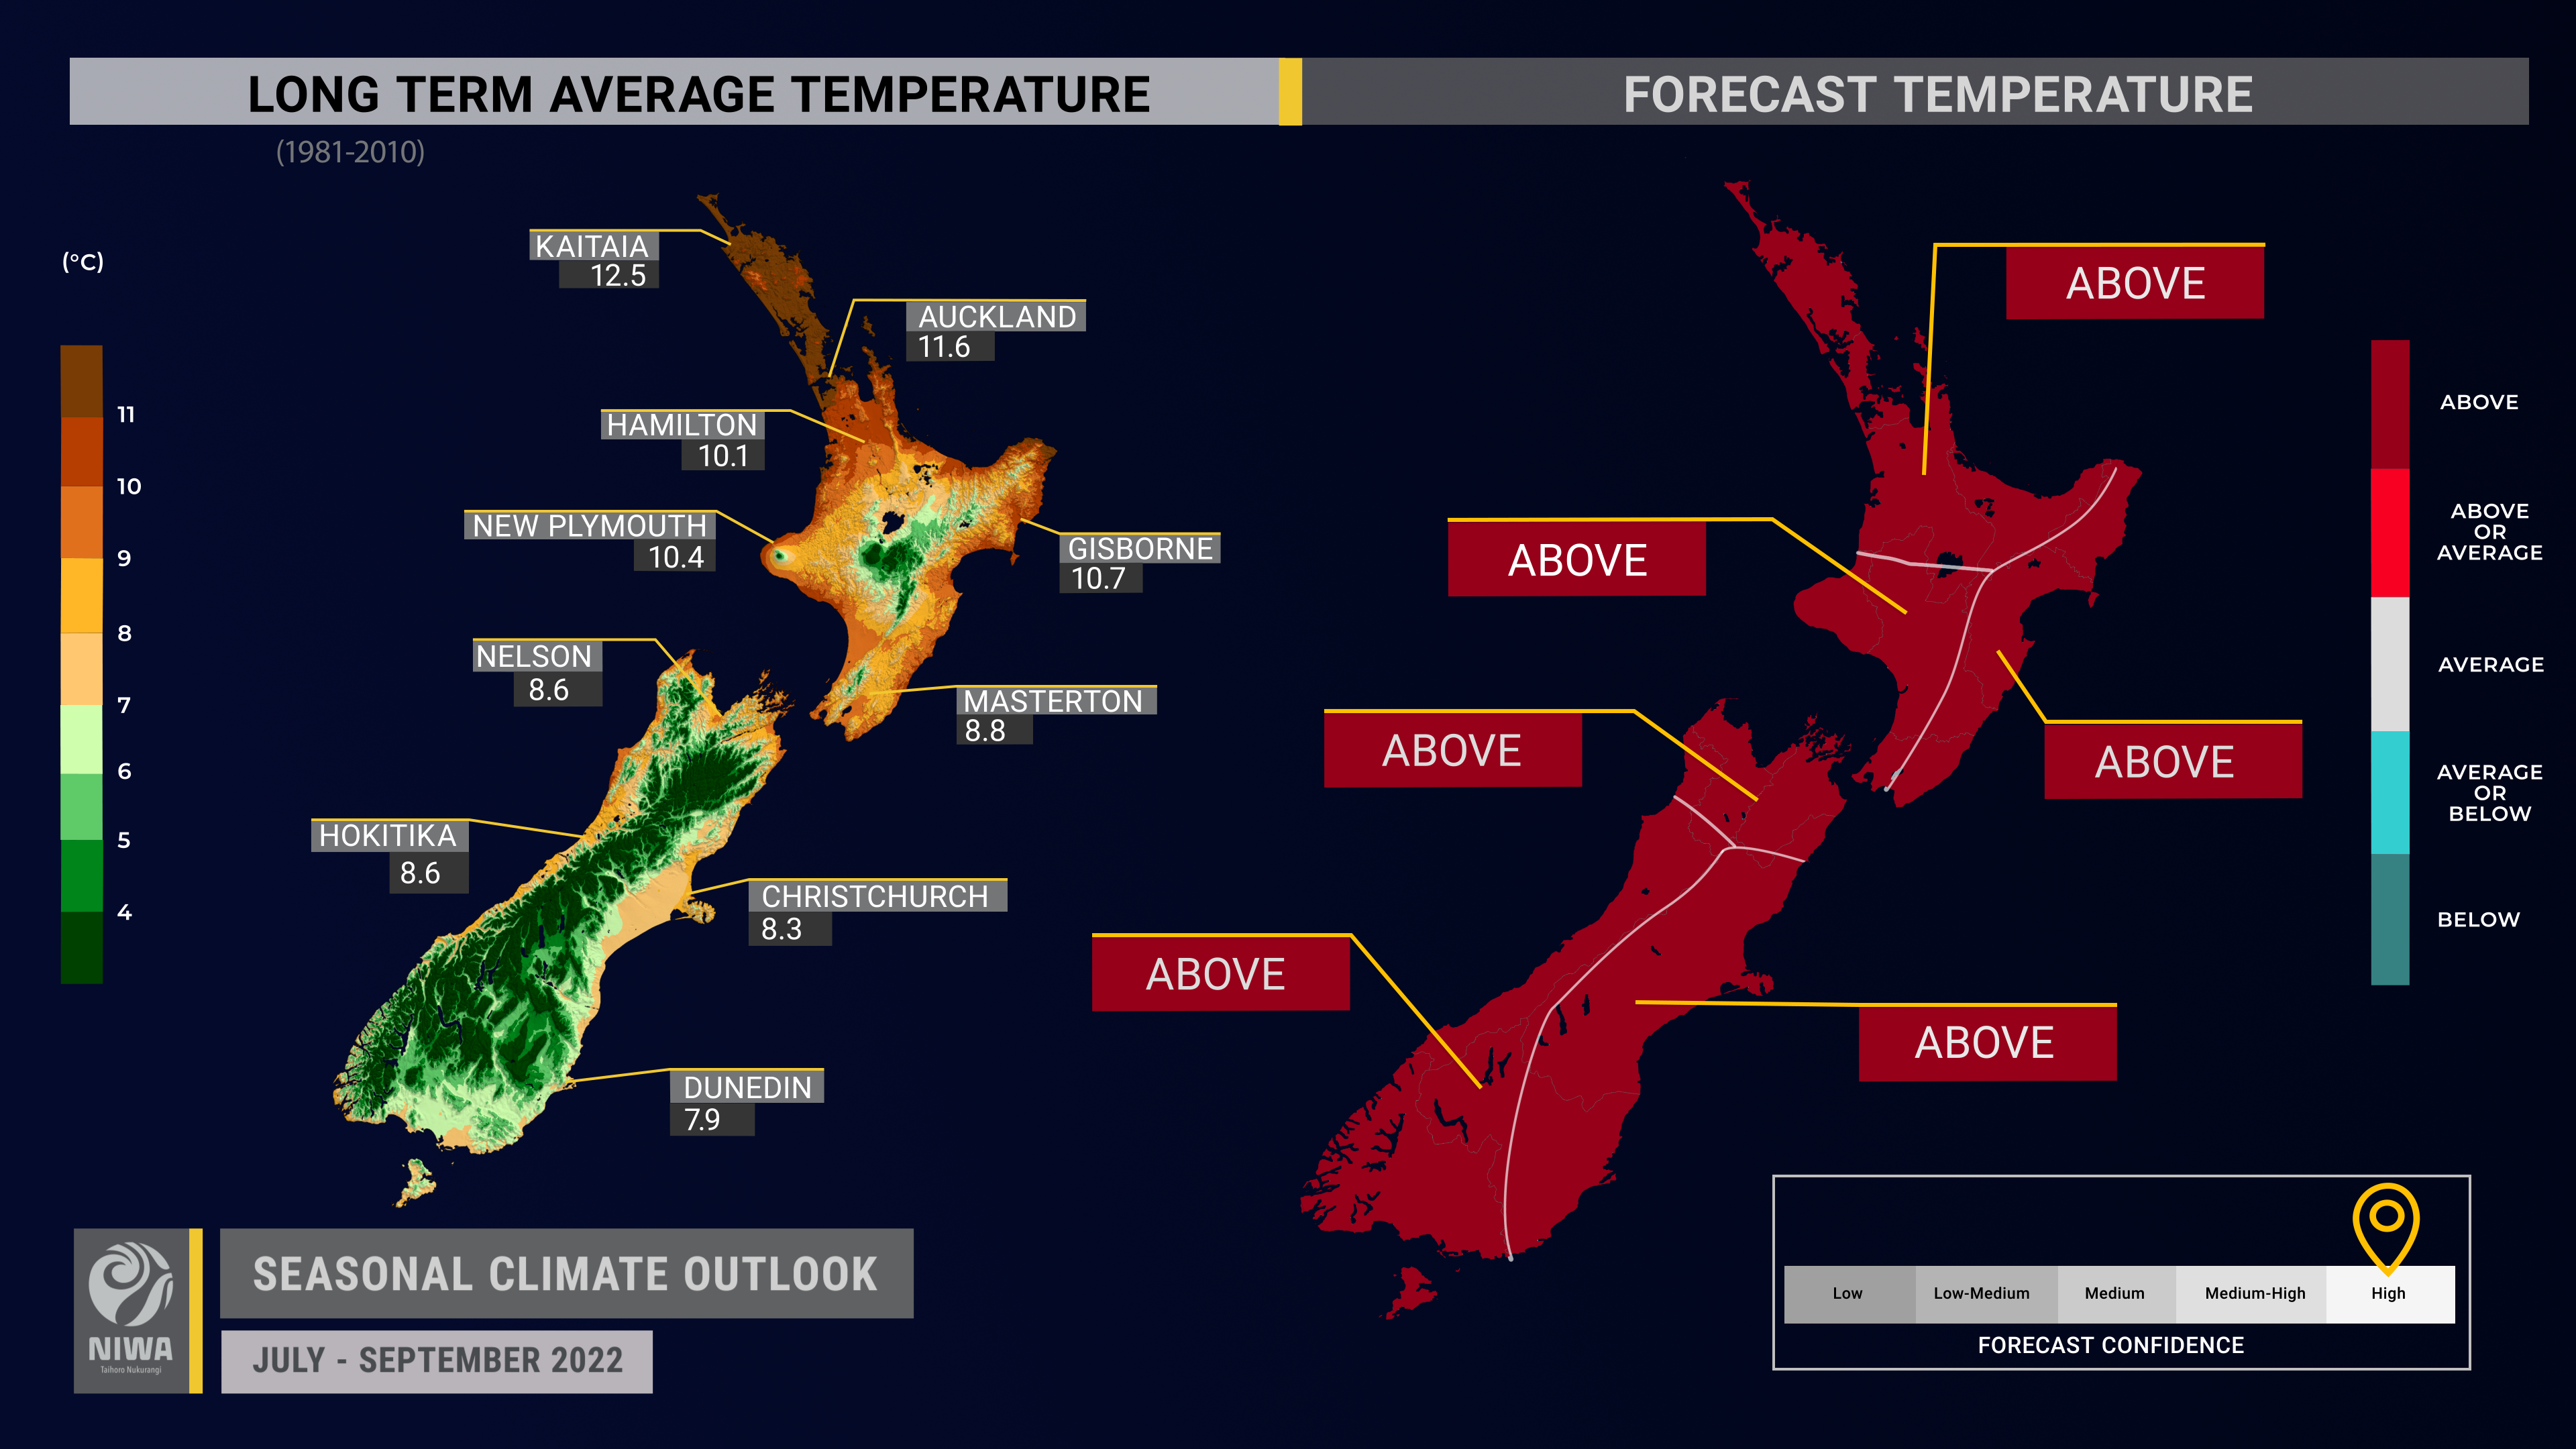
- Temperatures are most likely to be warmer than average across all regions of Aotearoa New Zealand. While cold snaps and frosts will occur, their duration and/or frequency may be reduced due to a lack of southerly air flows.
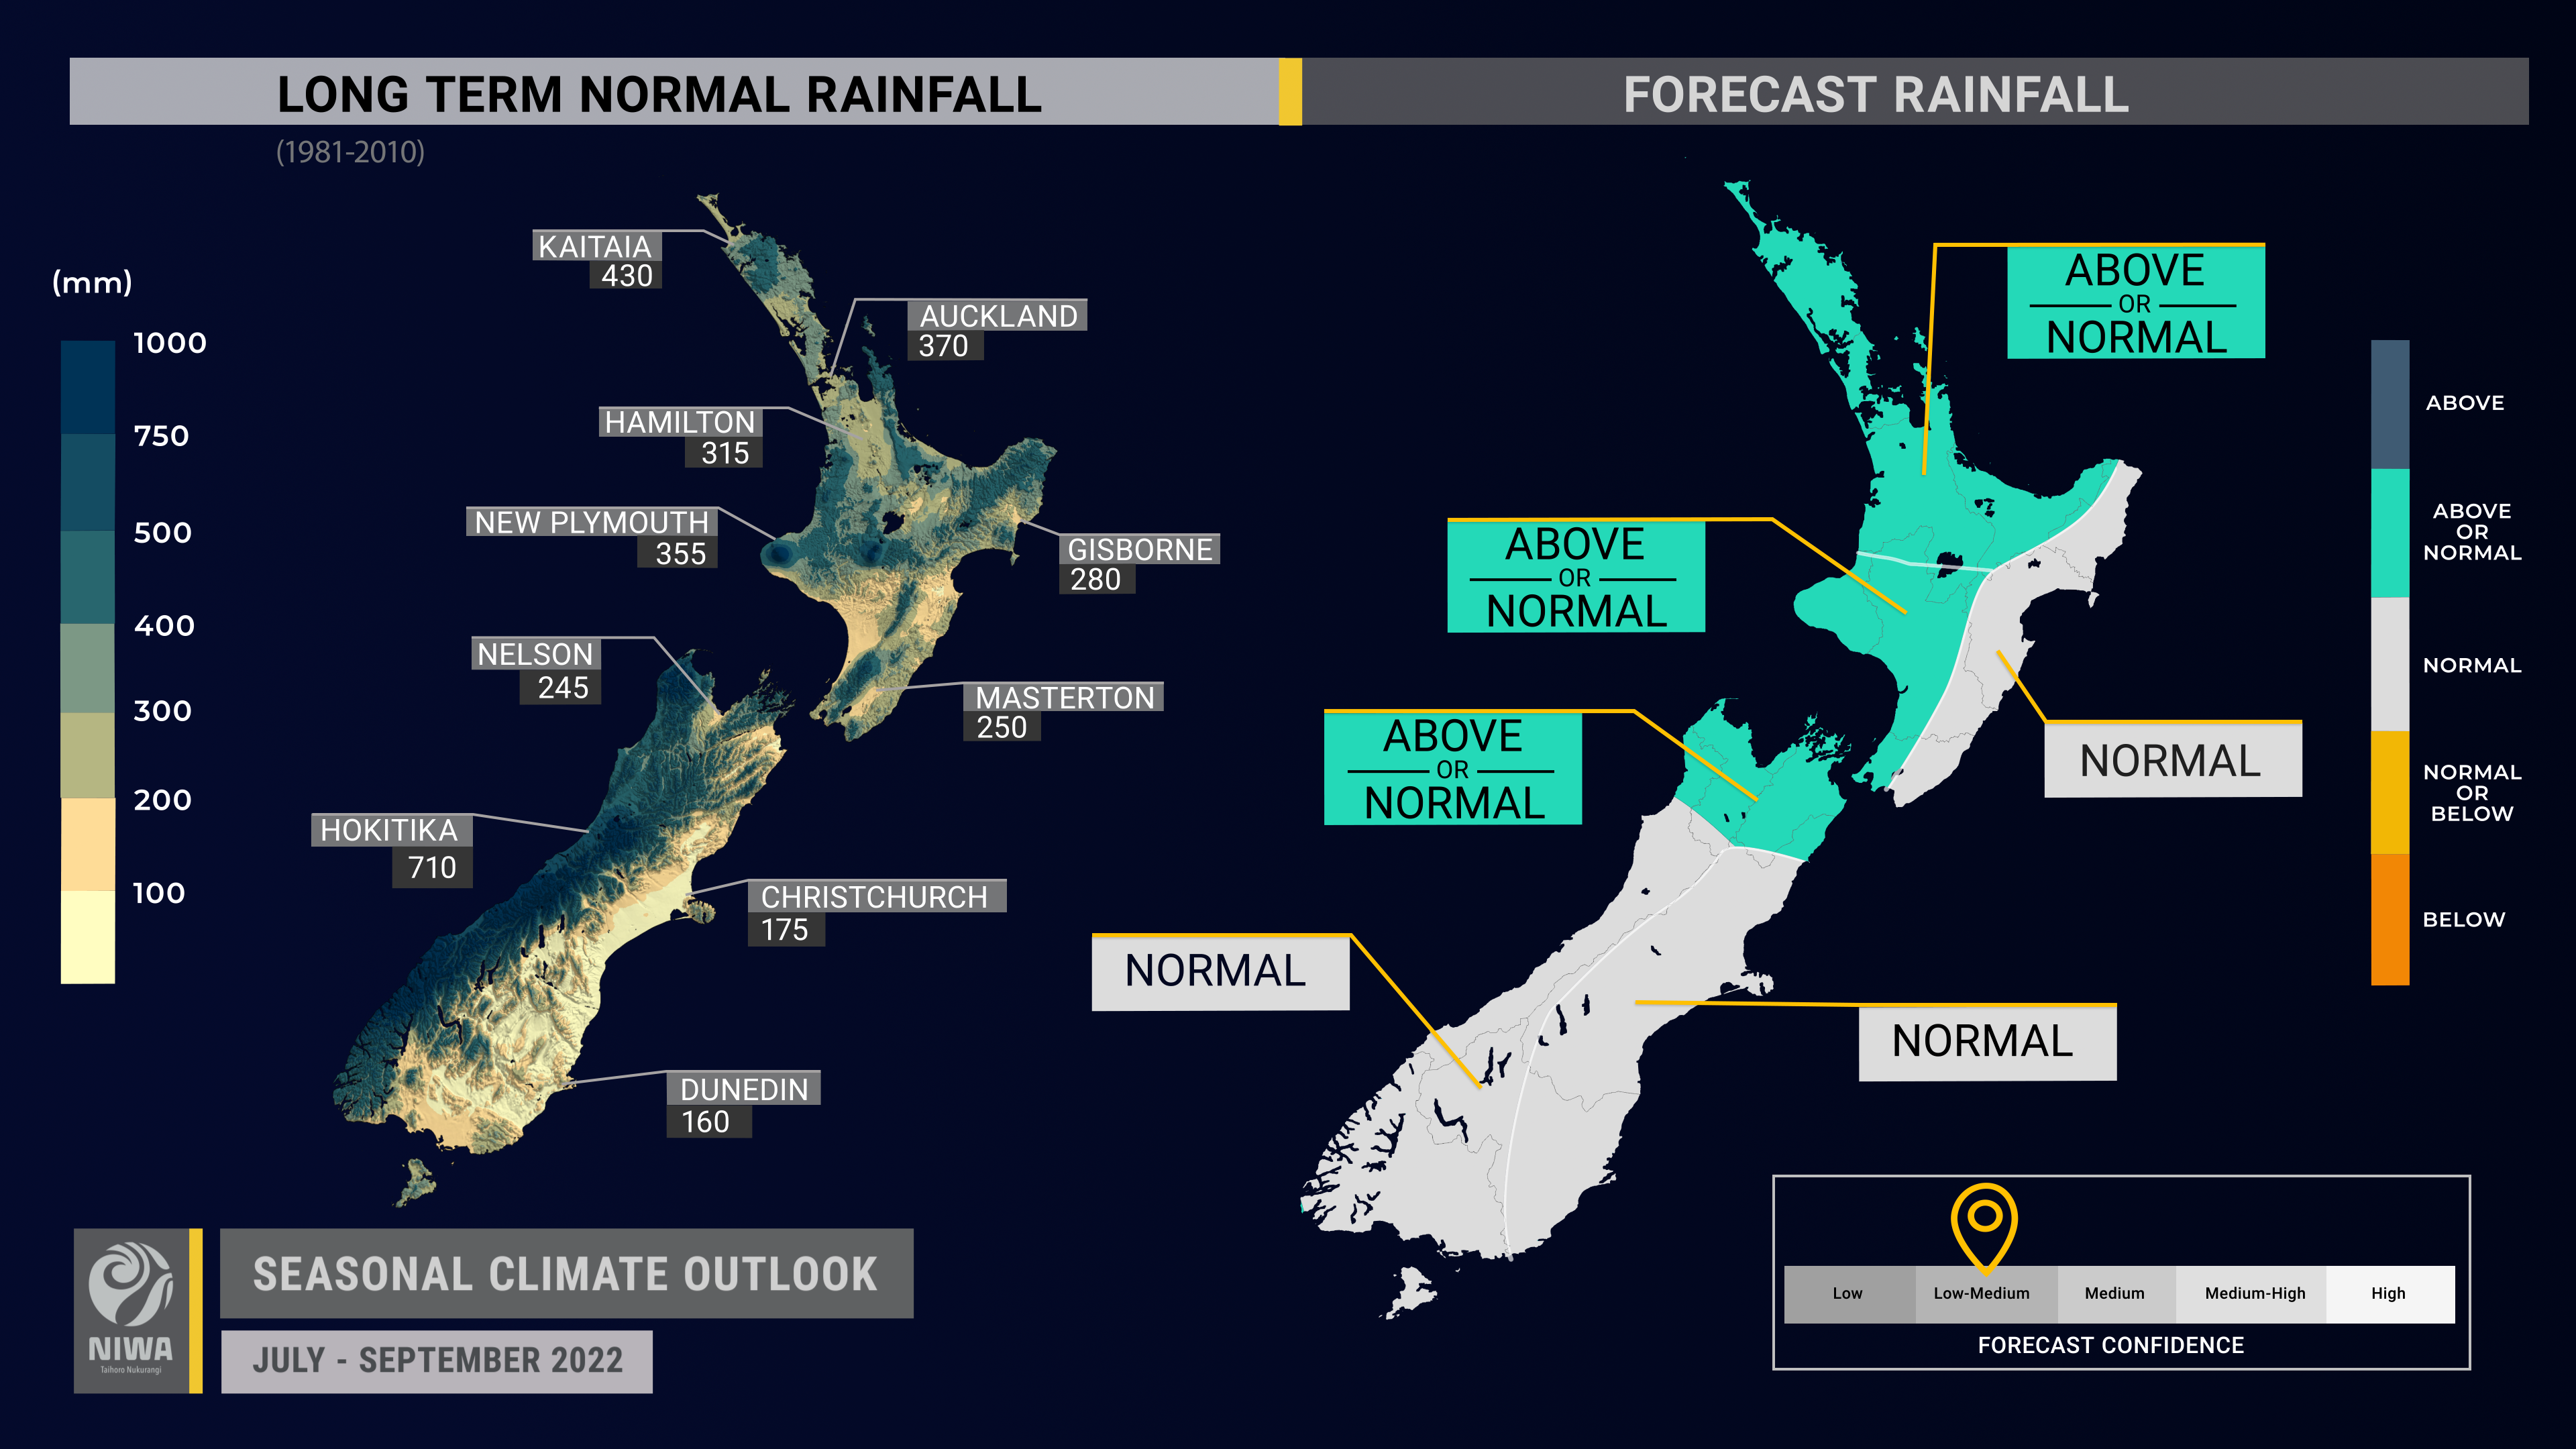
- Rainfall is about equally likely to be near normal or above normal in the north and west of the North Island and north of the South Island and most likely to be near normal in all other regions.
- Plumes of tropical moisture may increase the risk for flooding at times, with one such event possible during the second week of July. Fewer westerly winds during early spring could result in dry spells across western New Zealand.
- Air pressure is forecast to be higher than normal to the east of the country and lower than normal to the west of the country. This is expected to be associated with mixed westerly and northeasterly wind flow anomalies. The possibility for a more frequent Southern Ocean anticyclone (high pressure) during early spring could result in more easterly winds.
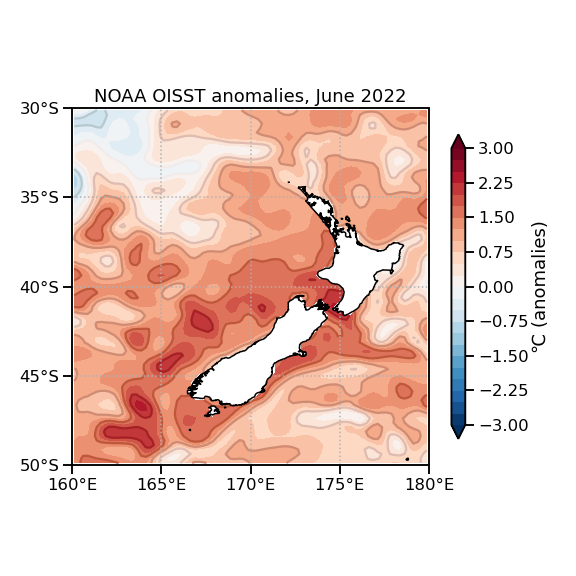
- Sea temperatures in the equatorial Pacific warmed during June. Despite this, the atmospheric imprint of La Niña, via the Southern Oscillation Index (SOI), remains strong. NIWA continues to acknowledge La Niña conditions. See the background for more info.
- Around New Zealand, sea surface temperatures (SSTs) ranged from 0.8˚C to 1.9˚C above average during June. Warmer than average SSTs are expected to continue to buffer the country from long-duration cold.
- Soil moisture levels and river flows are equally likely to be near normal or above normal in the north of the South Island. For all other regions, soil moisture levels and river flows are most likely to be near normal.
Regional predictions for July – September 2022
Northland, Auckland, Waikato, Bay of Plenty
The table below shows the probabilities (or percent chances) for each of three categories: above average, near average, and below average. In the absence of any forecast guidance there would be an equal likelihood (33% chance) of the outcome being in any one of the three categories. Forecast information from local and global guidance models is used to indicate the deviation from equal chance expected for the coming three-month period, with the following outcomes the most likely (but not certain) for this region:
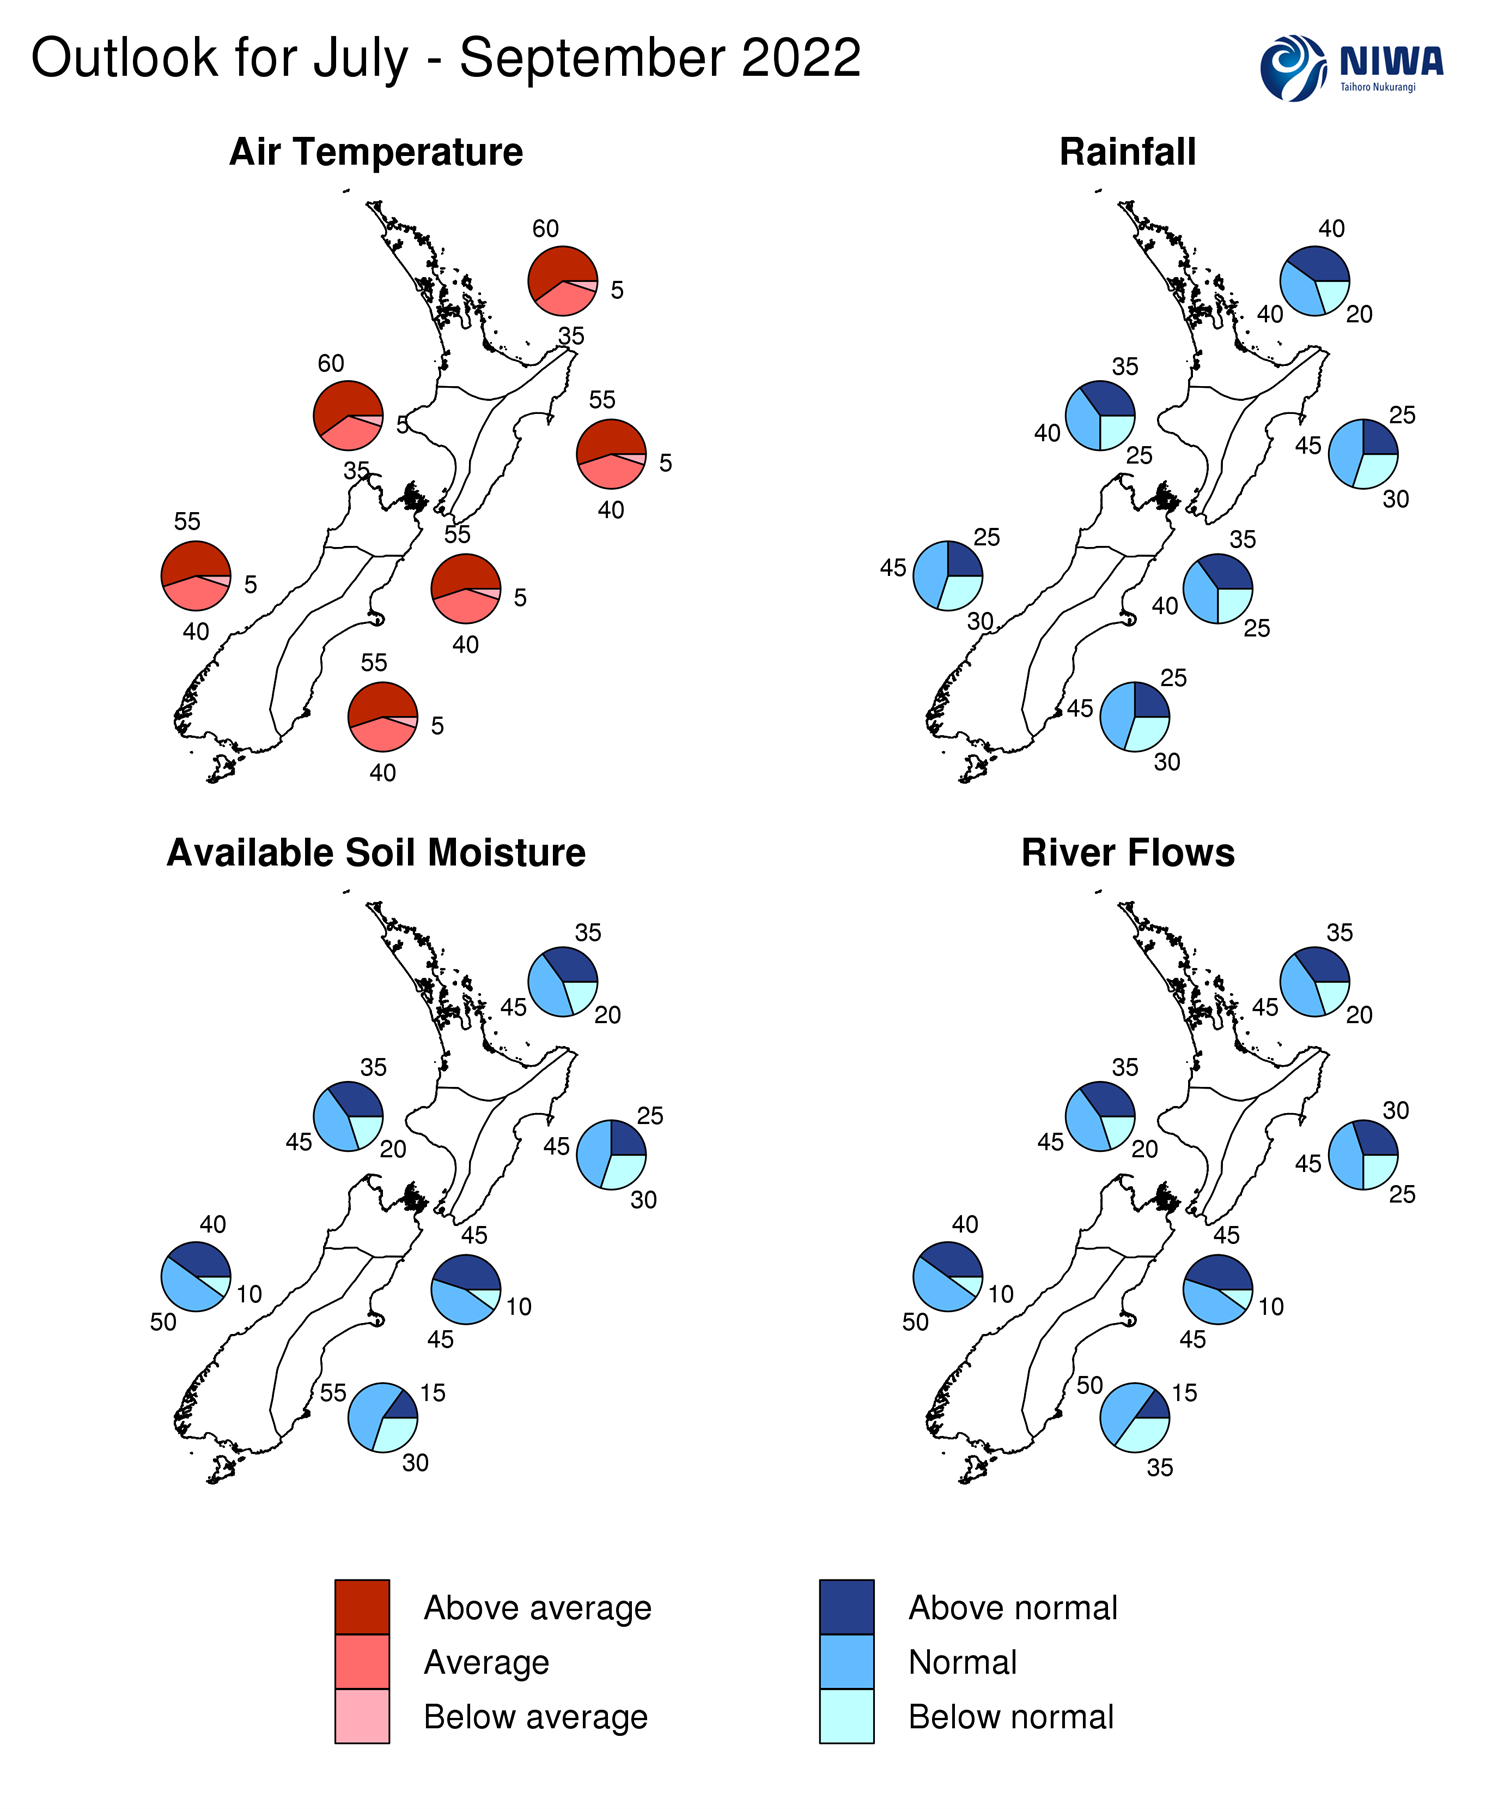
- Temperatures are very likely to be above average (60% chance). A predicted lack of southerly winds and warmer than average coastal seas will likely reduce the frequency and intensity of cold spells.
- Rainfall totals are about equally likely to be near normal (40% chance) or above normal (40% chance). Occasional air flows from the tropics will likely direct plumes of moisture toward the country at times, causing heavy rainfall and the potential for flooding.
- Soil moisture levels and river flows are most likely to be near normal (45% chance).
The full probability breakdown is:
|
Temperature |
Rainfall |
Soil moisture |
River flows |
|
|
Above average |
60 |
40 |
35 |
35 |
|
Near average |
35 |
40 |
45 |
45 |
|
Below average |
05 |
20 |
20 |
20 |
Central North Island, Taranaki, Whanganui, Manawatu, Wellington
Probabilities are assigned in three categories: above average, near average, and below average.
- Temperatures are very likely to be above average (60% chance). A predicted lack of southerly winds and warmer than average coastal seas will likely reduce the frequency and intensity of cold spells.
- Rainfall is about equally likely to be near normal (40% chance) or above normal (35% chance). Occasional air flows from the tropics will likely direct plumes of moisture toward the country at times, causing heavy rainfall and the potential for flooding.
- Soil moisture levels and river flows are most likely to be near normal (45% chance).
The full probability breakdown is:
|
Temperature |
Rainfall |
Soil moisture |
River flows |
|
|
Above average |
60 |
35 |
35 |
35 |
|
Near average |
35 |
40 |
45 |
45 |
|
Below average |
05 |
25 |
20 |
20 |
Gisborne, Hawke’s Bay, Wairarapa
Probabilities are assigned in three categories: above average, near average, and below average.
- Temperatures are most likely to be above average (55% chance). A predicted lack of southerly winds will likely reduce the frequency of cold spells.
- Rainfall totals are most likely (45% chance) to be near normal. Seasonal rainfall patterns may be irregular with longer dry spells interspersed with heavy rainfall events. The potential for more frequent onshore winds during early spring could lead to more wet days.
- Soil moisture levels and river flows are most likely to be near normal (45% chance).
The full probability breakdown is:
|
Temperature |
Rainfall |
Soil moisture |
River flows |
|
|
Above average |
55 |
25 |
25 |
30 |
|
Near average |
40 |
45 |
45 |
45 |
|
Below average |
05 |
30 |
30 |
25 |
Tasman, Nelson, Marlborough, Buller
Probabilities are assigned in three categories: above average, near average, and below average.
- Temperatures are most likely to be above average (55% chance). A predicted lack of southerly winds and warmer than average coastal seas will likely reduce the frequency and intensity of cold spells.
- Rainfall is about equally likely to be near normal (40% chance) or above normal (35% chance). Occasional air flows from the tropics will likely direct plumes of moisture toward the country at times, causing heavy rainfall and the potential for flooding.
- Soil moisture levels and river flows are equally likely to be near normal (45% chance) or above normal (45% chance).
The full probability breakdown is:
|
Temperature |
Rainfall |
Soil moisture |
River flows |
|
|
Above average |
55 |
35 |
45 |
45 |
|
Near average |
40 |
40 |
45 |
45 |
|
Below average |
05 |
25 |
10 |
10 |
West Coast, Alps and foothills, inland Otago, Southland
Probabilities are assigned in three categories: above average, near average, and below average.
- Temperatures are most likely to be above average (55% chance). A predicted lack of southerly winds and warmer than average coastal seas will likely reduce the frequency and intensity of cold spells.
- Rainfall totals are most likely to be near normal (45% chance). Seasonal rainfall patterns may be irregular with longer dry spells interspersed with heavy rainfall events. There is the potential for more frequent spring anticyclones near the South Island, which could contribute to more easterly air flows and dry spells.
- Soil moisture levels and river flows are most likely to be near normal (50% chance).
The full probability breakdown is:
|
Temperature |
Rainfall |
Soil moisture |
River flows |
|
|
Above average |
55 |
25 |
40 |
40 |
|
Near average |
40 |
45 |
50 |
50 |
|
Below average |
05 |
30 |
10 |
10 |
Coastal Canterbury, east Otago
Probabilities are assigned in three categories: above average, near average, and below average.
- Temperatures are most likely to be above average (55% chance). A predicted lack of southerly winds and warmer than average coastal seas will likely reduce the frequency and intensity of cold spells.
- Rainfall is most likely to be near normal (45% chance). Seasonal rainfall patterns may be irregular with longer dry spells interspersed with heavy rainfall events, the latter possible during mid-to-late July.
- Soil moisture levels and river flows are most likely to be near normal (50-55% chance).
The full probability breakdown is:
|
Temperature |
Rainfall |
Soil moisture |
River flows |
|
|
Above average |
55 |
25 |
15 |
15 |
|
Near average |
40 |
45 |
55 |
50 |
|
Below average |
05 |
30 |
30 |
35 |
Graphical representation of the regional probabilities
Background
The NINO3.4 Index anomaly (in the central equatorial Pacific) over the last month (through 26 June) was -0.40˚C, in the “cool-neutral range”. The three-monthly NINO3.4 Index remained near the La Niña threshold. The provisional June monthly SOI was +2.1, which continues to strongly signal La Niña.
In the subsurface equatorial Pacific, warmer than average water (+1˚C to +3˚C) was nearing the surface in the east at the end of June. This owed to a downwelling oceanic Kelvin Wave that moved across the Pacific over the last several months. Upper oceanic heat content increased in the central Pacific but remained below average in the east. Overall, this indicated a weakening of La Niña.
Trade winds across the equatorial Pacific were weaker than normal in the North Pacific and slightly stronger than normal in the South Pacific. This was associated with warming SSTs near and north of the equator in particular.
Of importance, a surge in trade winds during the first half of July may halt or reverse the recent warming trend. The trade wind surge may generate an upwelling oceanic Kelvin Wave, which could result in a cooling of the equatorial Pacific sub-surface and surface over the next three months.
Taking these factors into account, La Niña conditions are most likely to continue during July-September (60% chance). During October-December, there is a 60% chance for La Niña and a 35% chance for ENSO neutral. During January-March, there is around a 40% chance for La Niña and a 50% chance for ENSO neutral.
Should La Niña persist through or redevelop by summer 2022-23, the current event would qualify as a “triple-dip”. Since 1900, using an Oceanic Niño threshold of -0.5˚C from December-February (relative to the 1981-2010 average), the following would qualify as “triple-dip” events: 1998-2000, 1983-1985, 1973-1975, and 1908-1910.
A sea surface temperature seesaw in the Indian Ocean, called the Indian Ocean Dipole (IOD), was in its negative phase for much of June. There is a consensus for a moderate-to-strong negative IOD event during late winter, lasting into spring. This may be associated with heavier rainfall events in northern and eastern New Zealand as the IOD signal becomes superimposed with a La Niña-like base state. Conversely, a pattern of fewer westerly winds in early spring may increase the odds that western areas of both islands experience longer dry spells.
During June, convective forcing was influenced by a sequence of Kelvin Waves and the Madden-Julian Oscillation (MJO) over the Americas and Africa with a period of suppressed convection over the western Pacific for a time. The latter caused a period of destructive interference, which led to a general weakening of La Niña.
In July, tropical forcing is forecast to return to the Maritime Continent and western Pacific, displaying a more typical La Niña flavour. In mid-to-late July, the MJO may cross the Pacific and emerge over the Americas. This is expected to be associated with a tour across phases 4-5-6-7-8. This sequence has historically been associated with a period of wetter than normal conditions for much of New Zealand, which looks likely to begin in the second week of July.
A secondary pulse of the MJO in early August may be associated with low frequency forcing becoming more established in the Indian Ocean with the likely development of a negative IOD.
The long-term low frequency forcing from the negative IOD favours phases 1-3. For New Zealand, this has historically been associated with near or above average temperatures and relatively drier conditions, particularly in the west.
The Southern Annular Mode (SAM) was in its negative phase for much of June, with the 30-day running average becoming negative for the first time since early September 2021. A sharp trend toward the positive phase of the SAM occurred in late June and will most likely persist through the first week to 10 days of July, in association with more high pressure in the New Zealand region.
New Zealand’s coastal water temperatures remained above average during June. Anomaly values decreased in the northern North Island and around the South Island. Patchy marine heatwave conditions continued in New Zealand’s offshore waters, but the coverage was less dense than last month. Model guidance remains consistent in its expectation for above average sea surface temperatures over the next three to six months. For more information, see the NIWA Sea Surface Temperature Update.
NZ coastal SST anomalies (through 27 June)
|
North NI |
1.07˚C |
|
West NI |
1.93˚C |
|
East NI |
0.75˚C |
|
North SI |
1.68˚C |
|
West SI |
1.18˚C |
|
East SI |
1.64˚C |
Forecast Confidence
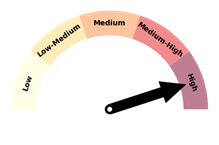
Temperature
|
Forecast confidence for temperatures is high. The prevalence of warmer than average coastal sea temperatures and an expected lack of southerly air flows support a lack of sustained colder than average air temperatures. Air flows from the tropics will transport warmth and humidity toward New Zealand at times. |
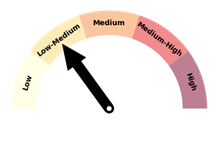
Rainfall
|
|
Forecast confidence for rainfall is low-medium. While occasional air flows from the tropics will likely contribute to some heavy rain events and possible flooding, a possible Southern Ocean anticyclone during spring could result in fewer westerly winds and the development of dry spells in western areas. |
