Outlook summary
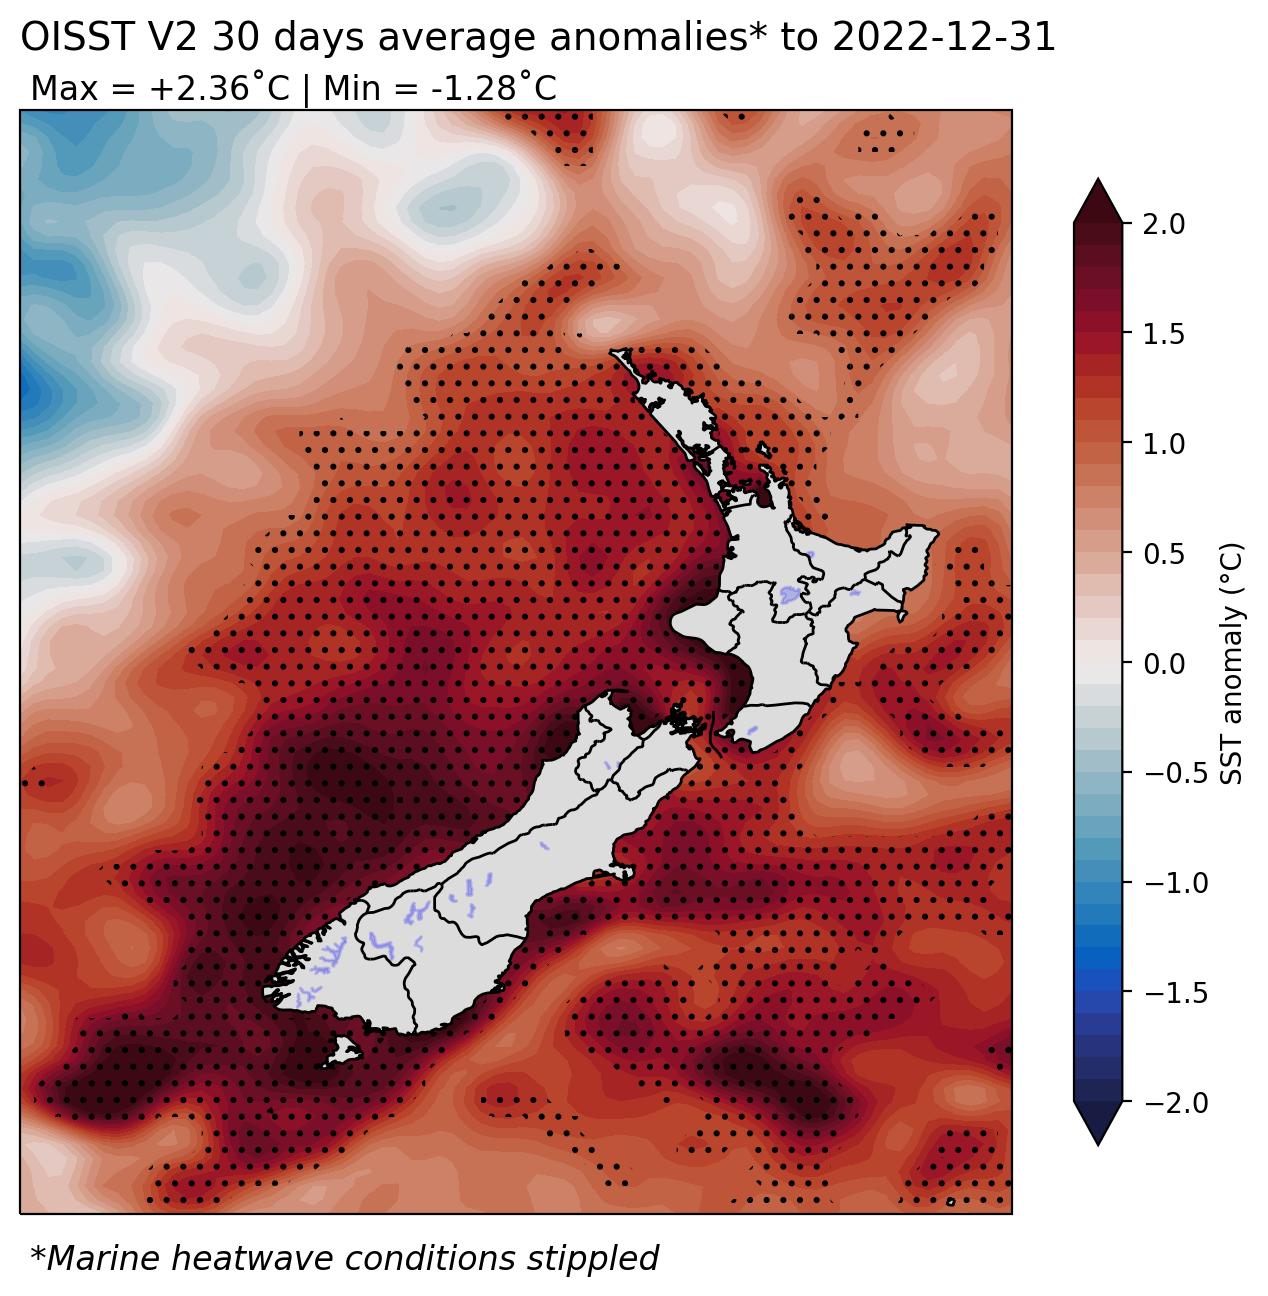
- La Niña continued during December and a marine heatwave intensified in Aotearoa New Zealand’s coastal waters with sea surface temperatures (SSTs) 1.1˚C to 1.8˚C above average. La Niña is most likely to ease to neutral by early autumn. [View more background information.]
- Air pressure is forecast to be higher than normal over and to the south of the South Island and lower than normal north of the country. This is expected to be associated with an easterly quarter air flow anomaly for the season as a whole.
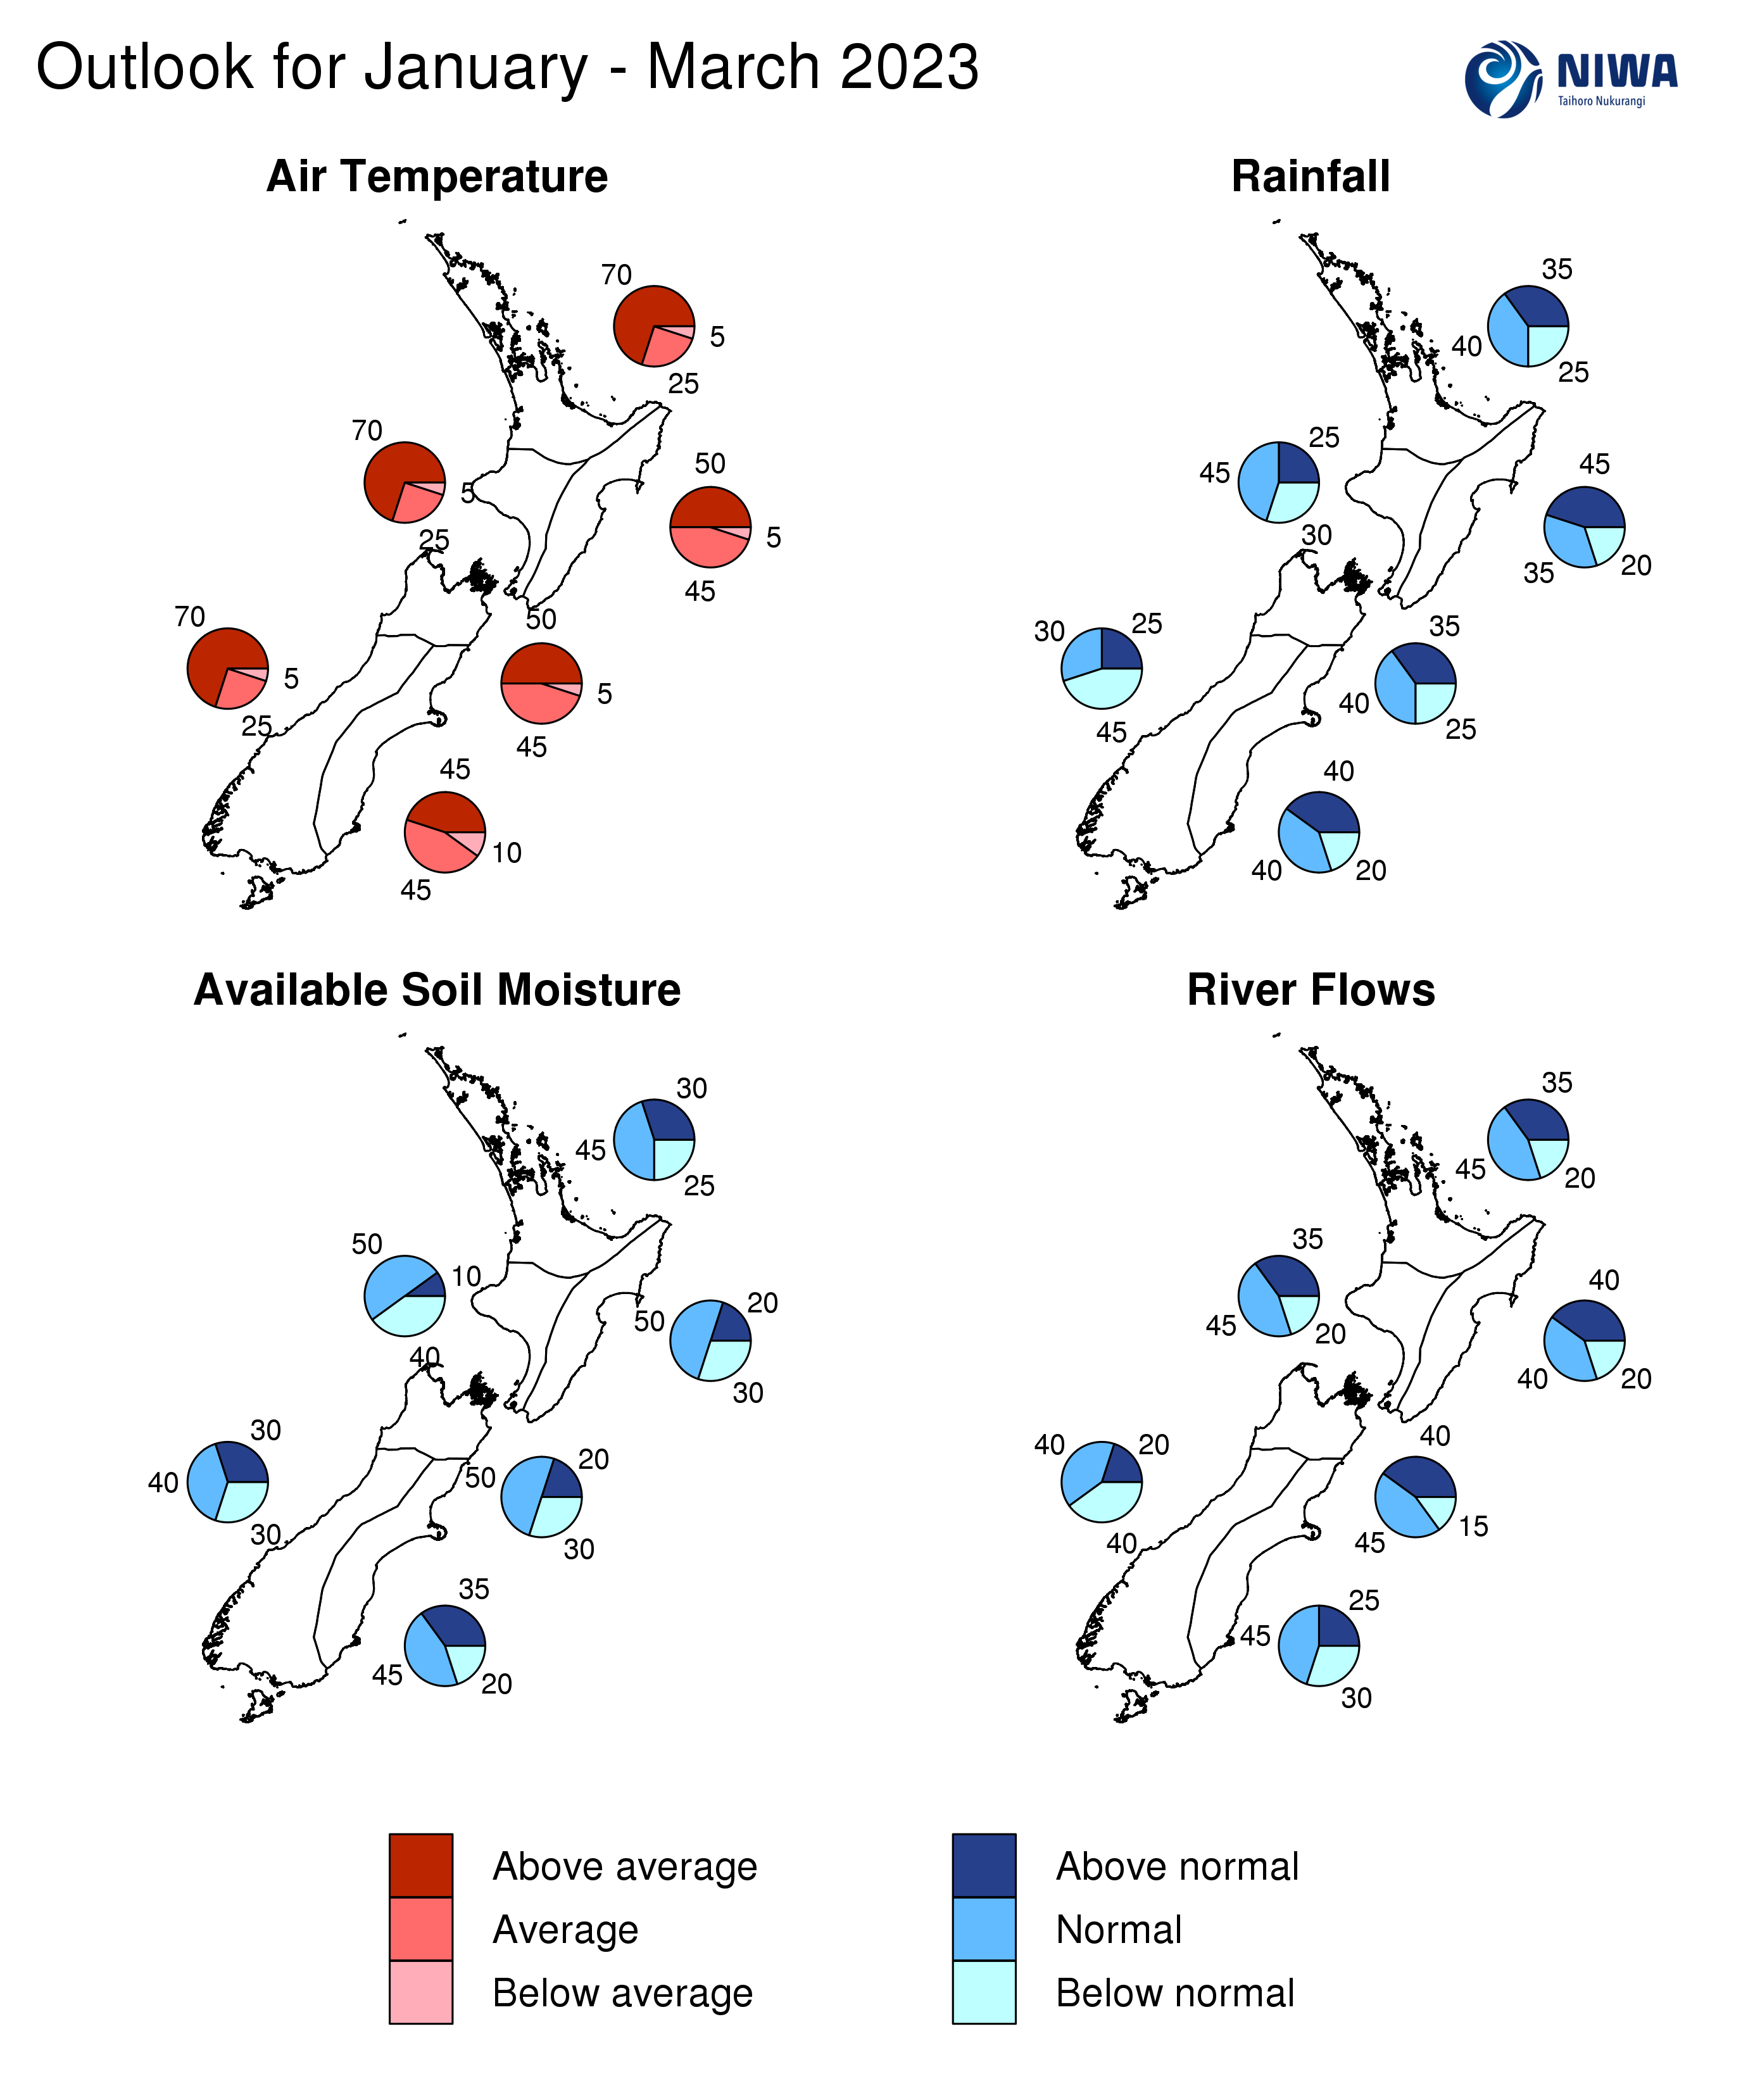
- Rainfall is most likely to be above normal in the east of the North Island, below normal in the west of the South Island, near normal in the west of the North Island, and about equally likely to be near normal or above normal across the remainder of the country.
- Warmer than average regional seas are expected to fuel occasional heavy rainfall, such as during early January; however, during periods of high pressure, dry spells will occur, particularly about inland and western parts of both islands. A dry spell is possible in the mid-to-late January period. The risk for dryness is elevated for Otago, Southland, and West Coast.
- Temperatures are about equally likely to be near average or above average in the north and east of the South Island and east of the North Island and very likely to be above average across the remainder of the country.
- A reduction in northwesterly “foehn” winds will likely mean fewer hot days for eastern areas in particular. Sub-tropical air masses, in conjunction with marine heatwave conditions, will likely keep overnight temperatures and humidity elevated across much of the country. However, this may also lead to more cloud, keeping daytime temperatures down.
- There is a medium risk for tropical cyclones in the Southwest Pacific during January. New Zealand’s risk for ex-tropical cyclone activity is normal-to-elevated through April. These systems can cause flooding rainfall, strong winds, and coastal hazards.
- Soil moisture levels are most likely to be near normal in all regions. River flows are equally likely to be near normal or below normal in the west of the South Island, about equally likely to be near normal or above normal in the east of the North Island and north of the South Island, and most likely to be near normal in all other regions.
Regional predictions for January – March 2023
Northland, Auckland, Waikato, Bay of Plenty
The table below shows the probabilities (or percent chances) for each of three categories: above average, near average, and below average. In the absence of any forecast guidance there would be an equal likelihood (33% chance) of the outcome being in any one of the three categories. Forecast information from local and global guidance models is used to indicate the deviation from equal chance expected for the coming three-month period, with the following outcomes the most likely (but not certain) for this region:
- Temperatures are very likely to be above average (70% chance). More sub-tropical winds and marine heatwave conditions will result in above average overnight temperatures and higher humidity in particular.
- Rainfall totals are about equally likely to be near normal (40% chance) or above normal (35% chance). Sub-tropical low pressure systems and/or atmospheric rivers are forecast to move south into the region with some regularity, such as during early January, which will increase the risk for occasional heavy rainfall and flooding.
- Soil moisture levels and river flows are most likely to be near normal (45% chance).
The full probability breakdown is:
|
Temperature |
Rainfall |
Soil moisture |
River flows |
|
|
Above average |
70 |
35 |
30 |
35 |
|
Near average |
25 |
40 |
45 |
45 |
|
Below average |
05 |
25 |
25 |
20 |
Central North Island, Taranaki, Whanganui, Manawatu, Wellington
Probabilities are assigned in three categories: above average, near average, and below average.
- Temperatures are very likely to be above average (70% chance). Marine heatwave conditions will result in above average warmth, especially at night, and humidity at times.
- Rainfall totals are most likely to be near normal (45% chance). There is an elevated risk for dry spells as fewer westerly winds are expected. One such dry spell is possible in mid-to-late January. However, low pressure systems from the north may bring occasional heavy rain, such as during early January.
- Soil moisture levels and river flows are most likely to be near normal (45-50% chance).
The full probability breakdown is:
|
Temperature |
Rainfall |
Soil moisture |
River flows |
|
|
Above average |
70 |
25 |
10 |
35 |
|
Near average |
25 |
45 |
50 |
45 |
|
Below average |
05 |
30 |
40 |
20 |
Gisborne, Hawke’s Bay, Wairarapa
Probabilities are assigned in three categories: above average, near average, and below average.
- Temperatures are about equally likely to be near average (45% chance) or above average (50% chance). More onshore winds and marine heatwave conditions may lead to higher humidity levels, more cloud cover, and warmer overnight temperatures. Fewer northwesterly winds will limit the number of hot days (above 25˚C).
- Rainfall totals are most likely to be above normal (45% chance). Sub-tropical low pressure systems and/or atmospheric rivers are forecast to occasionally move south into the region, such as during early January, increasing the risk for occasional heavy rainfall and flooding.
- Soil moisture levels are most likely to be near normal (50% chance) and river flows are equally likely to be near normal or above normal (40% chance each).
The full probability breakdown is:
|
Temperature |
Rainfall |
Soil moisture |
River flows |
|
|
Above average |
50 |
45 |
20 |
40 |
|
Near average |
45 |
35 |
50 |
40 |
|
Below average |
05 |
20 |
30 |
20 |
Tasman, Nelson, Marlborough, Buller
Probabilities are assigned in three categories: above average, near average, and below average.
- Temperatures are about equally likely to be near average (45% chance) or above average (50% chance). Marine heatwave conditions may lead to higher humidity levels and warmer overnight temperatures in particular; however, more easterly, onshore winds could lead to increased cloud and cooler daytime temperatures, especially in Marlborough.
- Rainfall totals are about equally likely to be near normal (40% chance) or above normal (35% chance). Sub-tropical low pressure systems and/or atmospheric rivers are forecast to move south into the region with some regularity, such as during early January, which will increase the risk for occasional heavy rainfall. However, more frequent easterly winds could result in dry spells for Nelson and Tasman, such as during mid-to-late January.
- Soil moisture levels are most likely to be near normal (50% chance) and river flows are about equally likely to be near normal (45% chance) or above normal (40% chance).
The full probability breakdown is:
|
Temperature |
Rainfall |
Soil moisture |
River flows |
|
|
Above average |
50 |
35 |
20 |
40 |
|
Near average |
45 |
40 |
50 |
45 |
|
Below average |
05 |
25 |
30 |
15 |
West Coast, Alps and foothills, inland Otago, Southland
Probabilities are assigned in three categories: above average, near average, and below average.
- Temperatures are very likely to be above average (70% chance). More easterly-quarter winds and marine heatwave conditions will result in high heat and humidity at times.
- Rainfall totals are most likely to be below normal (45% chance). Due to La Niña, more frequent offshore winds will likely result in extended dry spells, such as during mid-to-late January. Low rainfall may also occur around the hydro lakes. The region should remain aware of the potential for an ex-tropical cyclone or atmospheric river, particularly as La Niña eases over the next three months.
- Soil moisture levels are most likely to be near normal (40% chance) and river flows are equally likely to be near normal or below normal (40% chance each).
The full probability breakdown is:
|
Temperature |
Rainfall |
Soil moisture |
River flows |
|
|
Above average |
70 |
25 |
30 |
20 |
|
Near average |
25 |
30 |
40 |
40 |
|
Below average |
05 |
45 |
30 |
40 |
Coastal Canterbury, east Otago
Probabilities are assigned in three categories: above average, near average, and below average.
- Temperatures are equally likely to be near average or above average (45% chance each). Fewer northwesterly winds will lead to fewer hot days (above 25˚C), although more frequent onshore winds and marine heatwave conditions may contribute to more cloud cover, warmer overnight temperatures, and higher humidity.
- Rainfall totals are equally likely to be near normal (40% chance) or above normal (40% chance). More frequent onshore winds may lead to more wet days (more than 1 mm of rainfall). Occasional tropical moisture plumes are also possible, particularly for North Canterbury. Conversely, nearby anticyclones could increase the risk for dry spells, especially in the southern part of the region during mid-to-late January.
- Soil moisture levels and river flows are most likely to be near normal (45% chance).
The full probability breakdown is:
|
Temperature |
Rainfall |
Soil moisture |
River flows |
|
|
Above average |
45 |
40 |
35 |
25 |
|
Near average |
45 |
40 |
45 |
45 |
|
Below average |
10 |
20 |
20 |
30 |
Graphical representation of the regional probabilities
Background
The NINO3.4 Index anomaly (in the central equatorial Pacific) over the last month (through 31 December) was -0.83˚C (climatology: 1991-2020). While this was within the La Niña range, it marked a warming trend as compared to November, indicating that the event is past its peak.
The December monthly Southern Oscillation Index (SOI) was +1.7 and +1.3 from October-December (climatology: 1991-2020), both in the La Niña range.
Trade winds across the equatorial Pacific were stronger than normal during December. Thus, La Niña continued, despite the slight weakening. Periods of weaker trades are expected in January, particularly in the east-central part of the basin, although trade wind strength is forecast to persist in the west-central Pacific, preventing a hasty decay of La Niña.
In the subsurface equatorial Pacific, substantial changes took place between November and December as warmth associated with the West Pacific Warm Pool shifted eastward. Cooler than average waters contracted toward the central part of the basin while warmer than average waters at depth pushed from the central to the eastern equatorial Pacific. The setup was reflective of a decaying La Niña. Any substantial relaxation or reversal in trade winds over the next three months will move the system toward ENSO-neutral.
NIWA’s analysis indicates that La Niña will most likely transition to ENSO-neutral during January-March (60-65% chance), probably later in the three month period. During April-June, ENSO-neutral is favoured at around a 65% chance. The odds for El Niño have risen to 60% for winter 2023. August-October has a 65-70% chance for El Niño conditions. The last time El Niño conditions were observed during winter and spring was 2015.
Of the three “triple dip” La Niña episodes (three consecutive La Niña events) since 1900, two were followed by El Niño conditions in the following winter/spring and one was followed by neutral conditions.
A sea surface temperature seesaw in the Indian Ocean called the Indian Ocean Dipole (IOD) eased during December, evidenced by an increase in the outgoing longwave radiation (a proxy for decreasing cloud) compared to November.
During October-December, convective forcing was dominated by the low frequency signal of the negative Indian Ocean Dipole and La Niña, superimposed with pulses of the Madden-Julian Oscillation (MJO). This was associated with anomalous rising air from the eastern tropical Indian Ocean into the Coral Sea with sinking air over the central and eastern Pacific.
During January, a pulse of the MJO will move across the Pacific to start the month before re-emerging over the Indian Ocean late, consistent with a tour through phases 7-8-1-2. Phase 7 is historically associated with lower than normal pressure north of the country and a tendency for unsettled conditions in the sub-tropics and tropics, as well as above normal rainfall in the North Island and upper half of the South Island during January. This is consistent with the wet weather conditions early in the month. Phase 8 is associated with drier conditions for much of the country, while phase 1 is associated with very wet conditions. Phase 2 is associated with wetter conditions in the eastern South Island and is drier elsewhere. Phase 7 favours above average temperatures while 8-2 are generally near or cooler than average.
Tropical forcing favours the Indian Ocean and Maritime Continent during February, roughly corresponding to phases 2-5. This is historically associated with above average temperatures and mixed rainfall patterns. Phase 5 tends to be much wetter than normal during February.
La Niña’s low frequency forcing pattern will continue to be an important driver of variability over the period. La Niña’s typical impacts for New Zealand include more easterly quarter winds, warmer temperatures and lower rainfall about inland and western parts of both islands, and less frequent hot days in the east of both islands. However, as La Niña gradually eases, more climatic variability will become possible.
The Southern Annular Mode (SAM) was positive every day during December. The SAM will likely continue to spend more time in its positive phase, similar to the previous two January-March periods which also featured La Niña conditions.
New Zealand’s coastal water temperatures became more unusually warm in all regions except the north of the North Island during December. Marine heatwave (MHW) conditions were widespread, with local anomalies of more than 4˚C off the West Coast and greater than 3˚C near Waikato. MHW conditions were classified as “strong” near the western and lower South Island and northern North Island and locally “severe” around Auckland. During January, continued above average air temperatures are favoured near the west of both islands, although periods of relatively stronger winds may prevent the event from more significant intensification. Ocean warmth near the western South Island between October-December 2022 was very consistent with what was observed during the same period in 2017, New Zealand’s most severe MHW on record. Overall, spring/summer 2022-23 is in a class with 2017-18 and 2021-22 in terms of anomalous coastal warmth. The NIWA Sea Surface Temperature Update suggests that MHW conditions may last into autumn and may delay the seasonal transition to cooler temperatures.
NZ 30-day coastal SST anomalies (to 31 December 2023)
|
North NI |
+1.24˚C |
|
West NI |
+1.84˚C |
|
East NI |
+1.12˚C |
|
North SI |
+1.68˚C |
|
West SI |
+1.83˚C |
|
East SI |
+1.56˚C |
Forecast Confidence
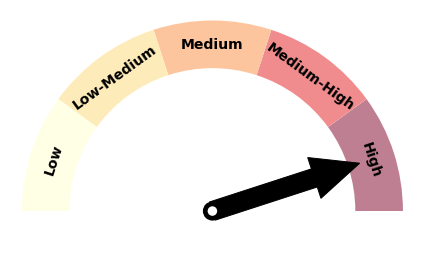
Temperature
|
Forecast confidence for temperatures is high. The combination of La Niña and marine heatwave conditions will greatly elevate the chance for above average seasonal temperatures. However, more easterly air flows and cloud will likely reduce the number of hot days in the east. |
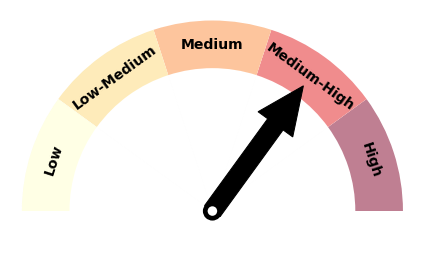
Rainfall
|
Forecast confidence for rainfall is medium-to-high. There is above average model agreement on rainfall outcomes, owing to a continued La Niña signature in the Pacific. A likelihood of more easterly winds will increase the odds of wetter than normal conditions in the north and east of both islands, although there will be some inter-regional exceptions. This will also reduce the frequency of rain events about the inland and western South Island, increasing the odds for dryness. |
