Outlook Summary
- September – November 2020 air pressure is forecast to be higher than normal to the east and lower than normal to the northwest of New Zealand. This is expected to be associated with La Niña-like northeasterly air flow anomalies.
- The probability for oceanic La Niña conditions is 57%. The majority of NIWA’s criteria for “La Niña Alert” have now been met, including increased trade winds in the equatorial Pacific, an atmospheric response that is La Niña-like, and an expectation for these conditions to continue. This is consistent with other international agencies.
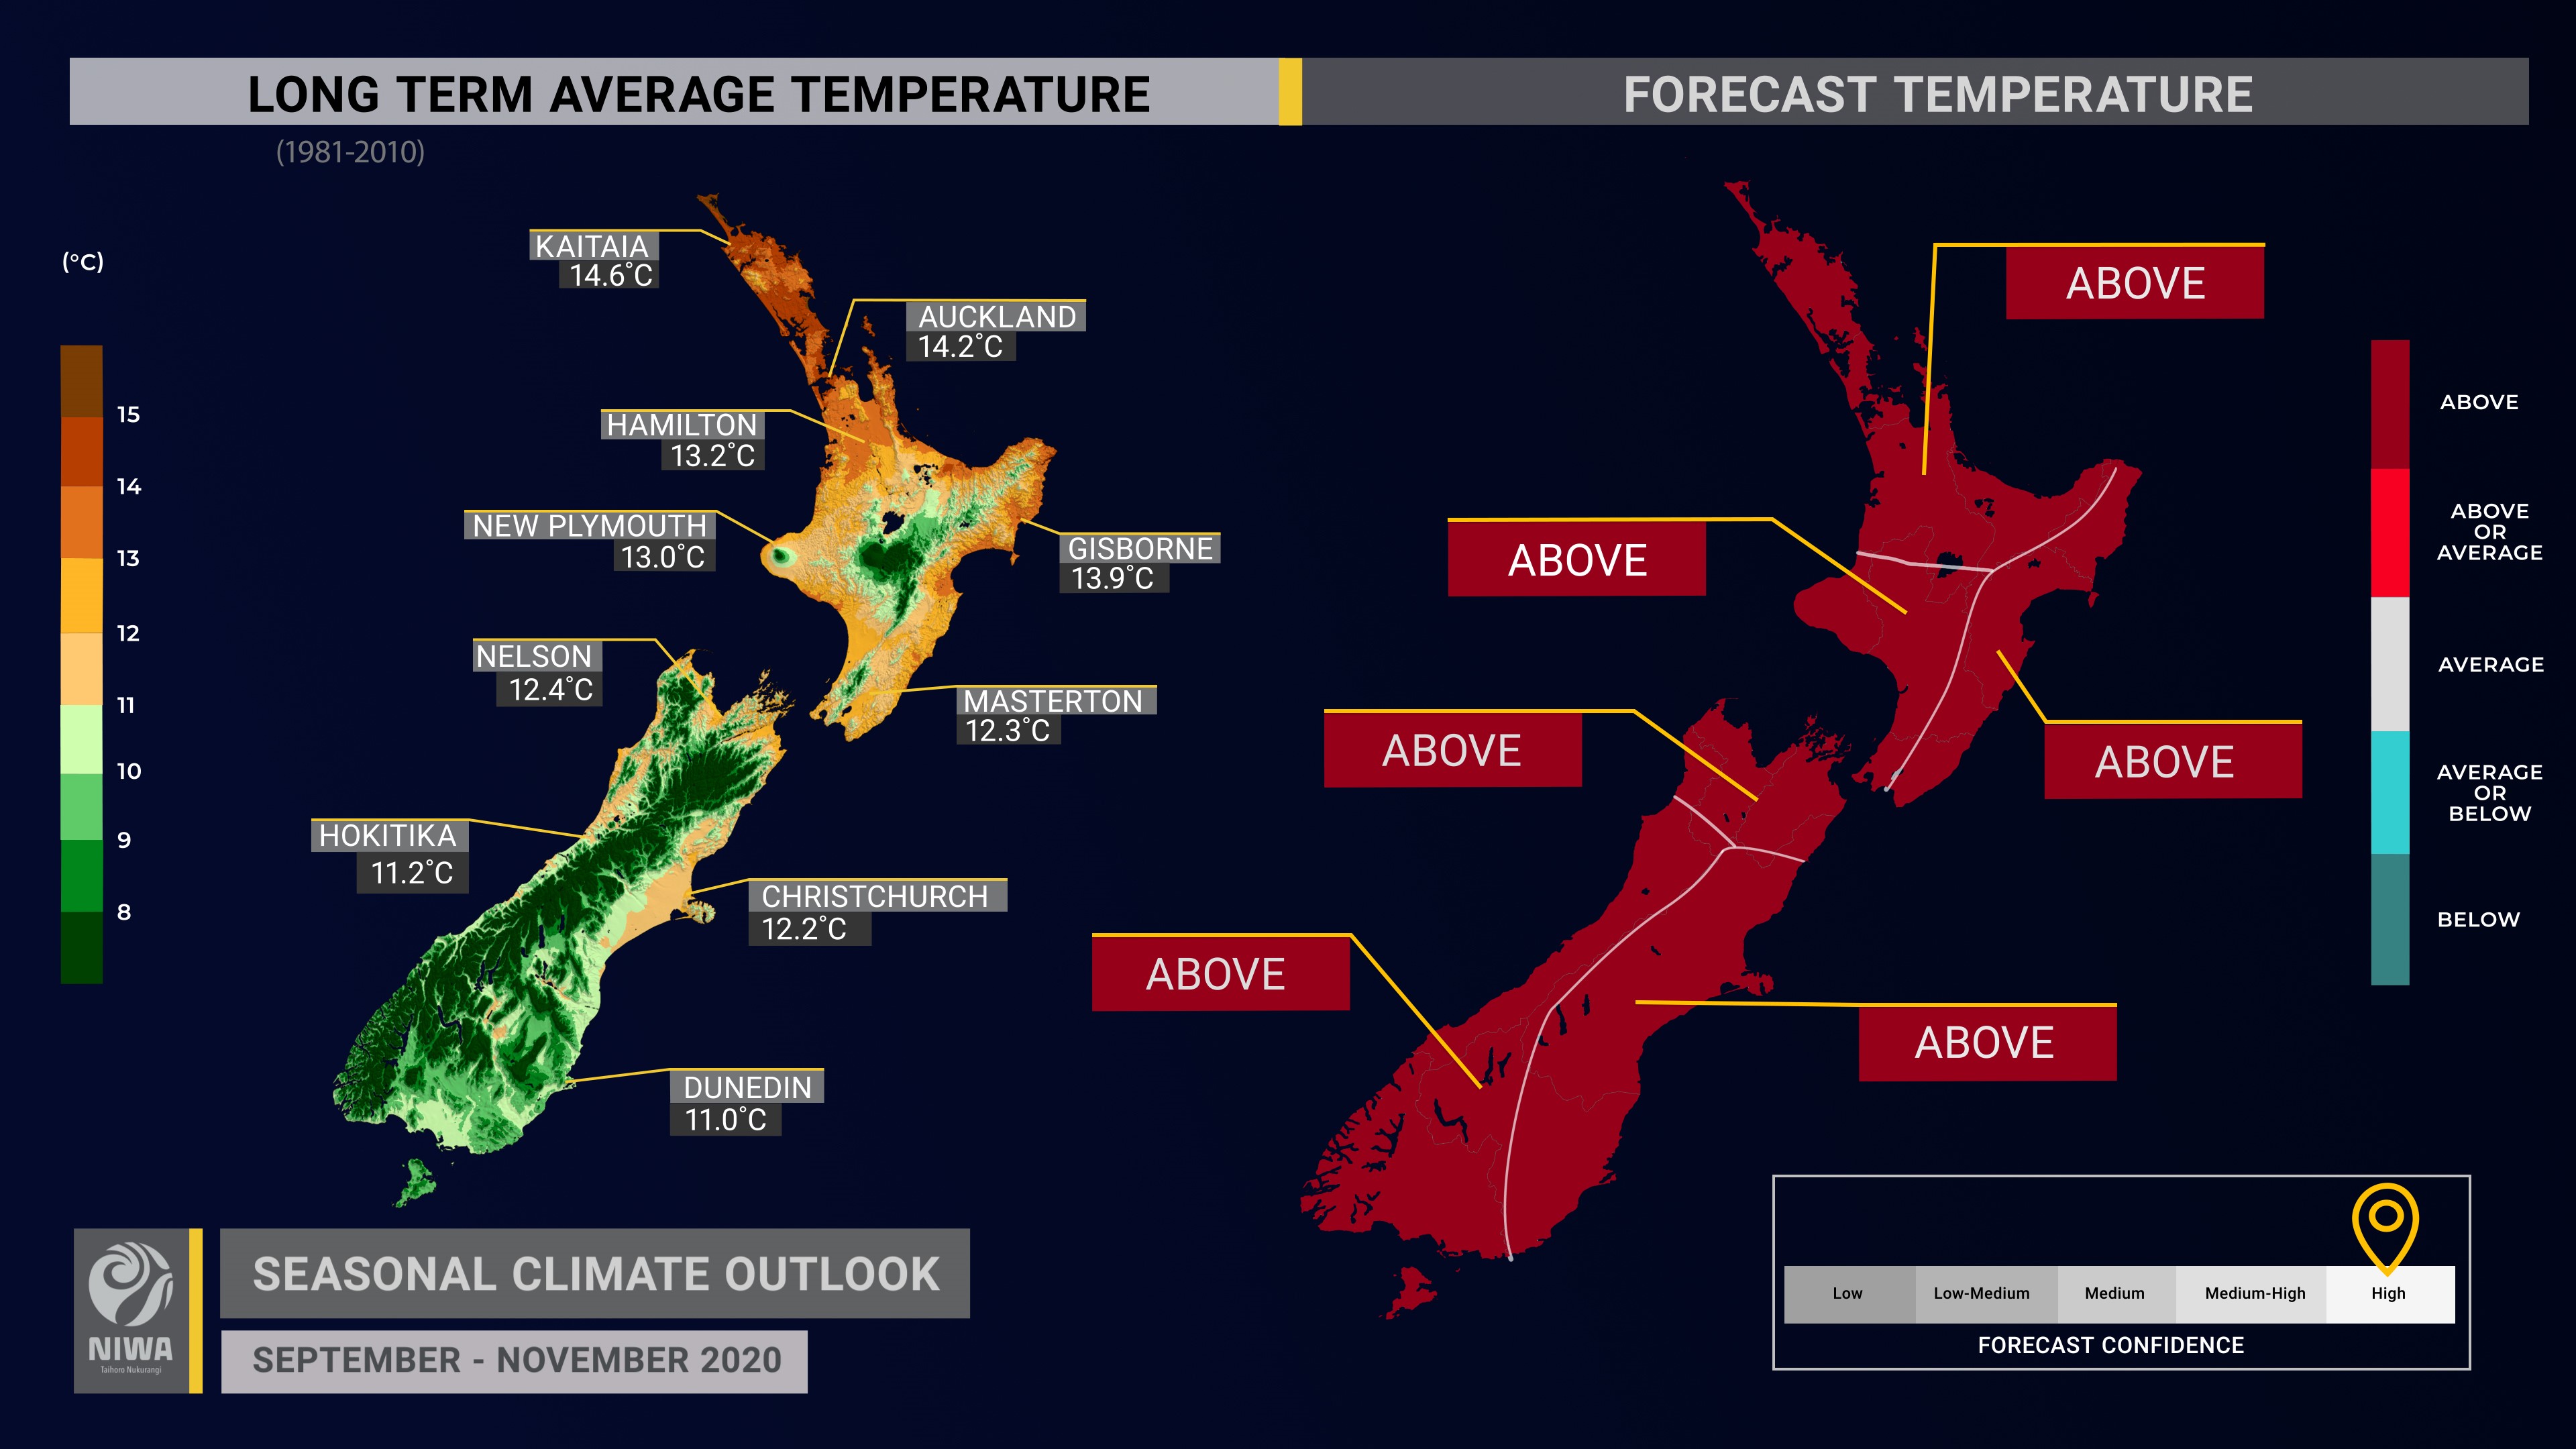
- New Zealand’s coastal water temperatures are well above average for the time of year and are expected to have an upward influence on air temperatures through spring.
- Air temperatures are most likely to be above average in all regions of New Zealand.
- Cold snaps and frosts can be expected in typically colder locations early in the season.
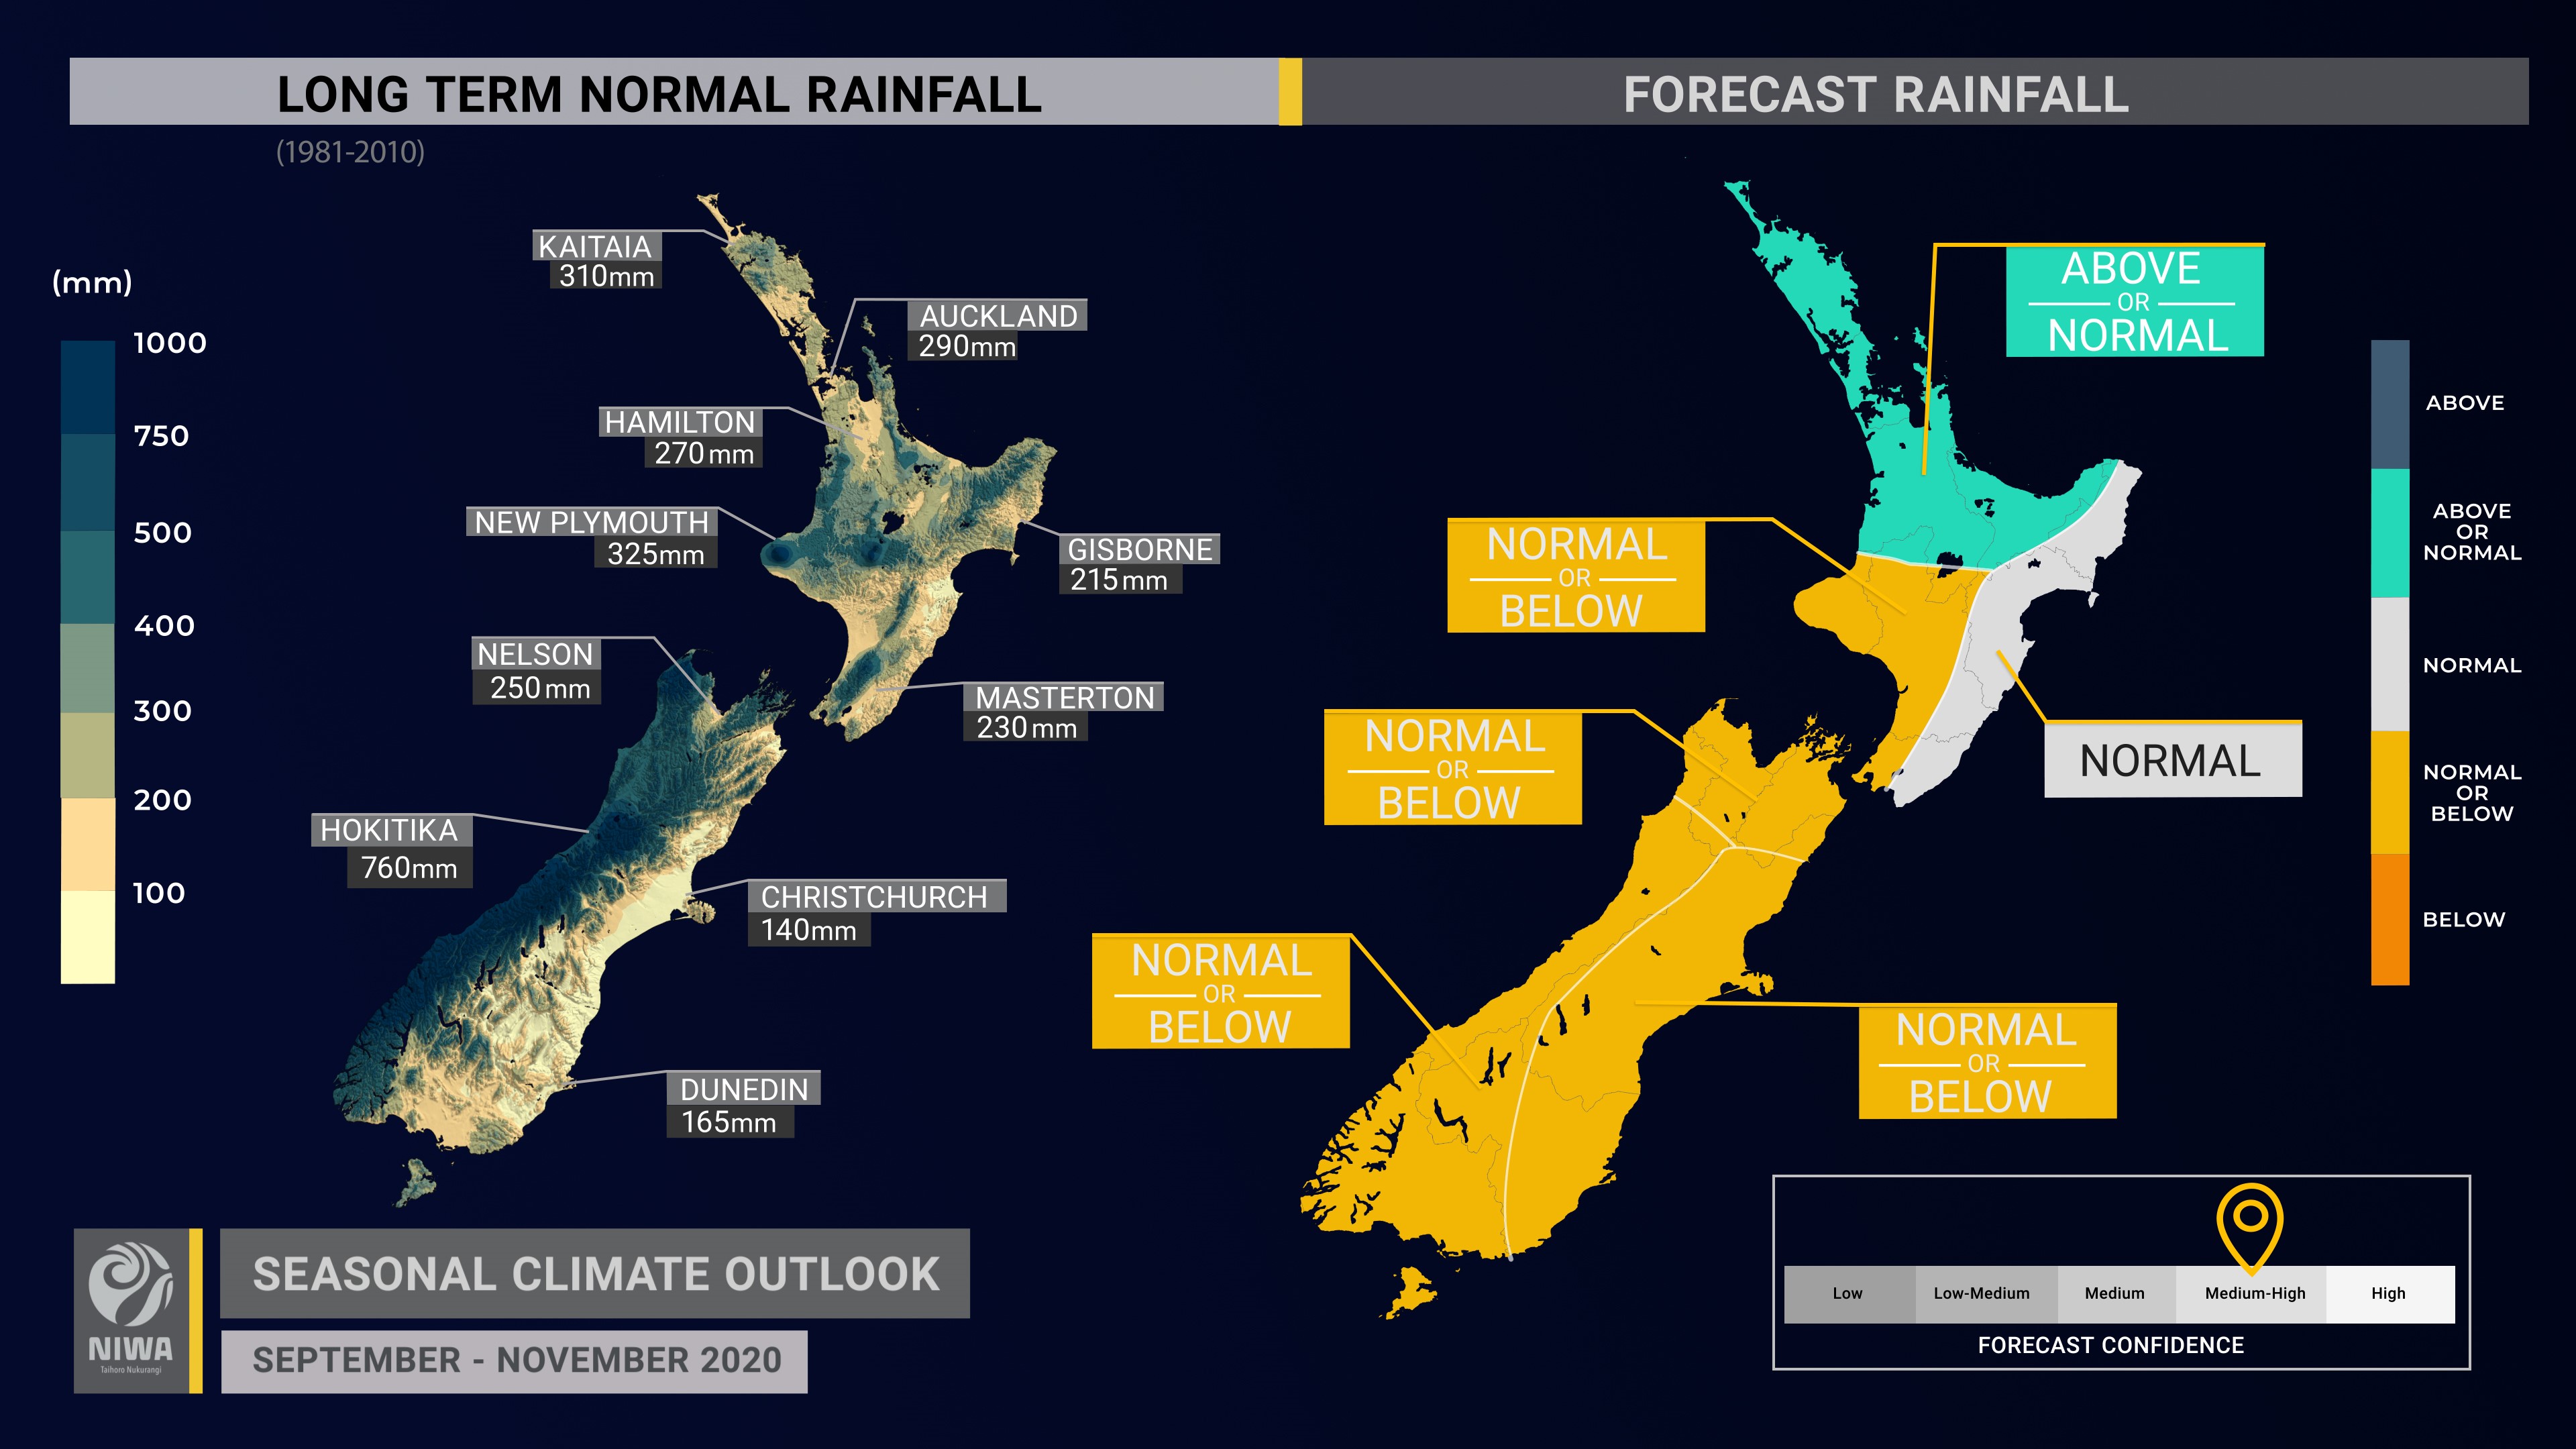
- Rainfall is about equally likely to be near normal or above normal in the north of the North Island, most likely to be near normal in the east of the North Island, and about equally likely to be near normal or below normal in all other regions.
- Northeasterly winds are expected to continue to leave northern areas, such as Northland, the Coromandel Peninsula, and the East Cape, exposed to sub-tropical rain storms while interior and western areas of the both islands remain sheltered from moisture, particularly in South Canterbury, Otago, the West Coast, and Southland.
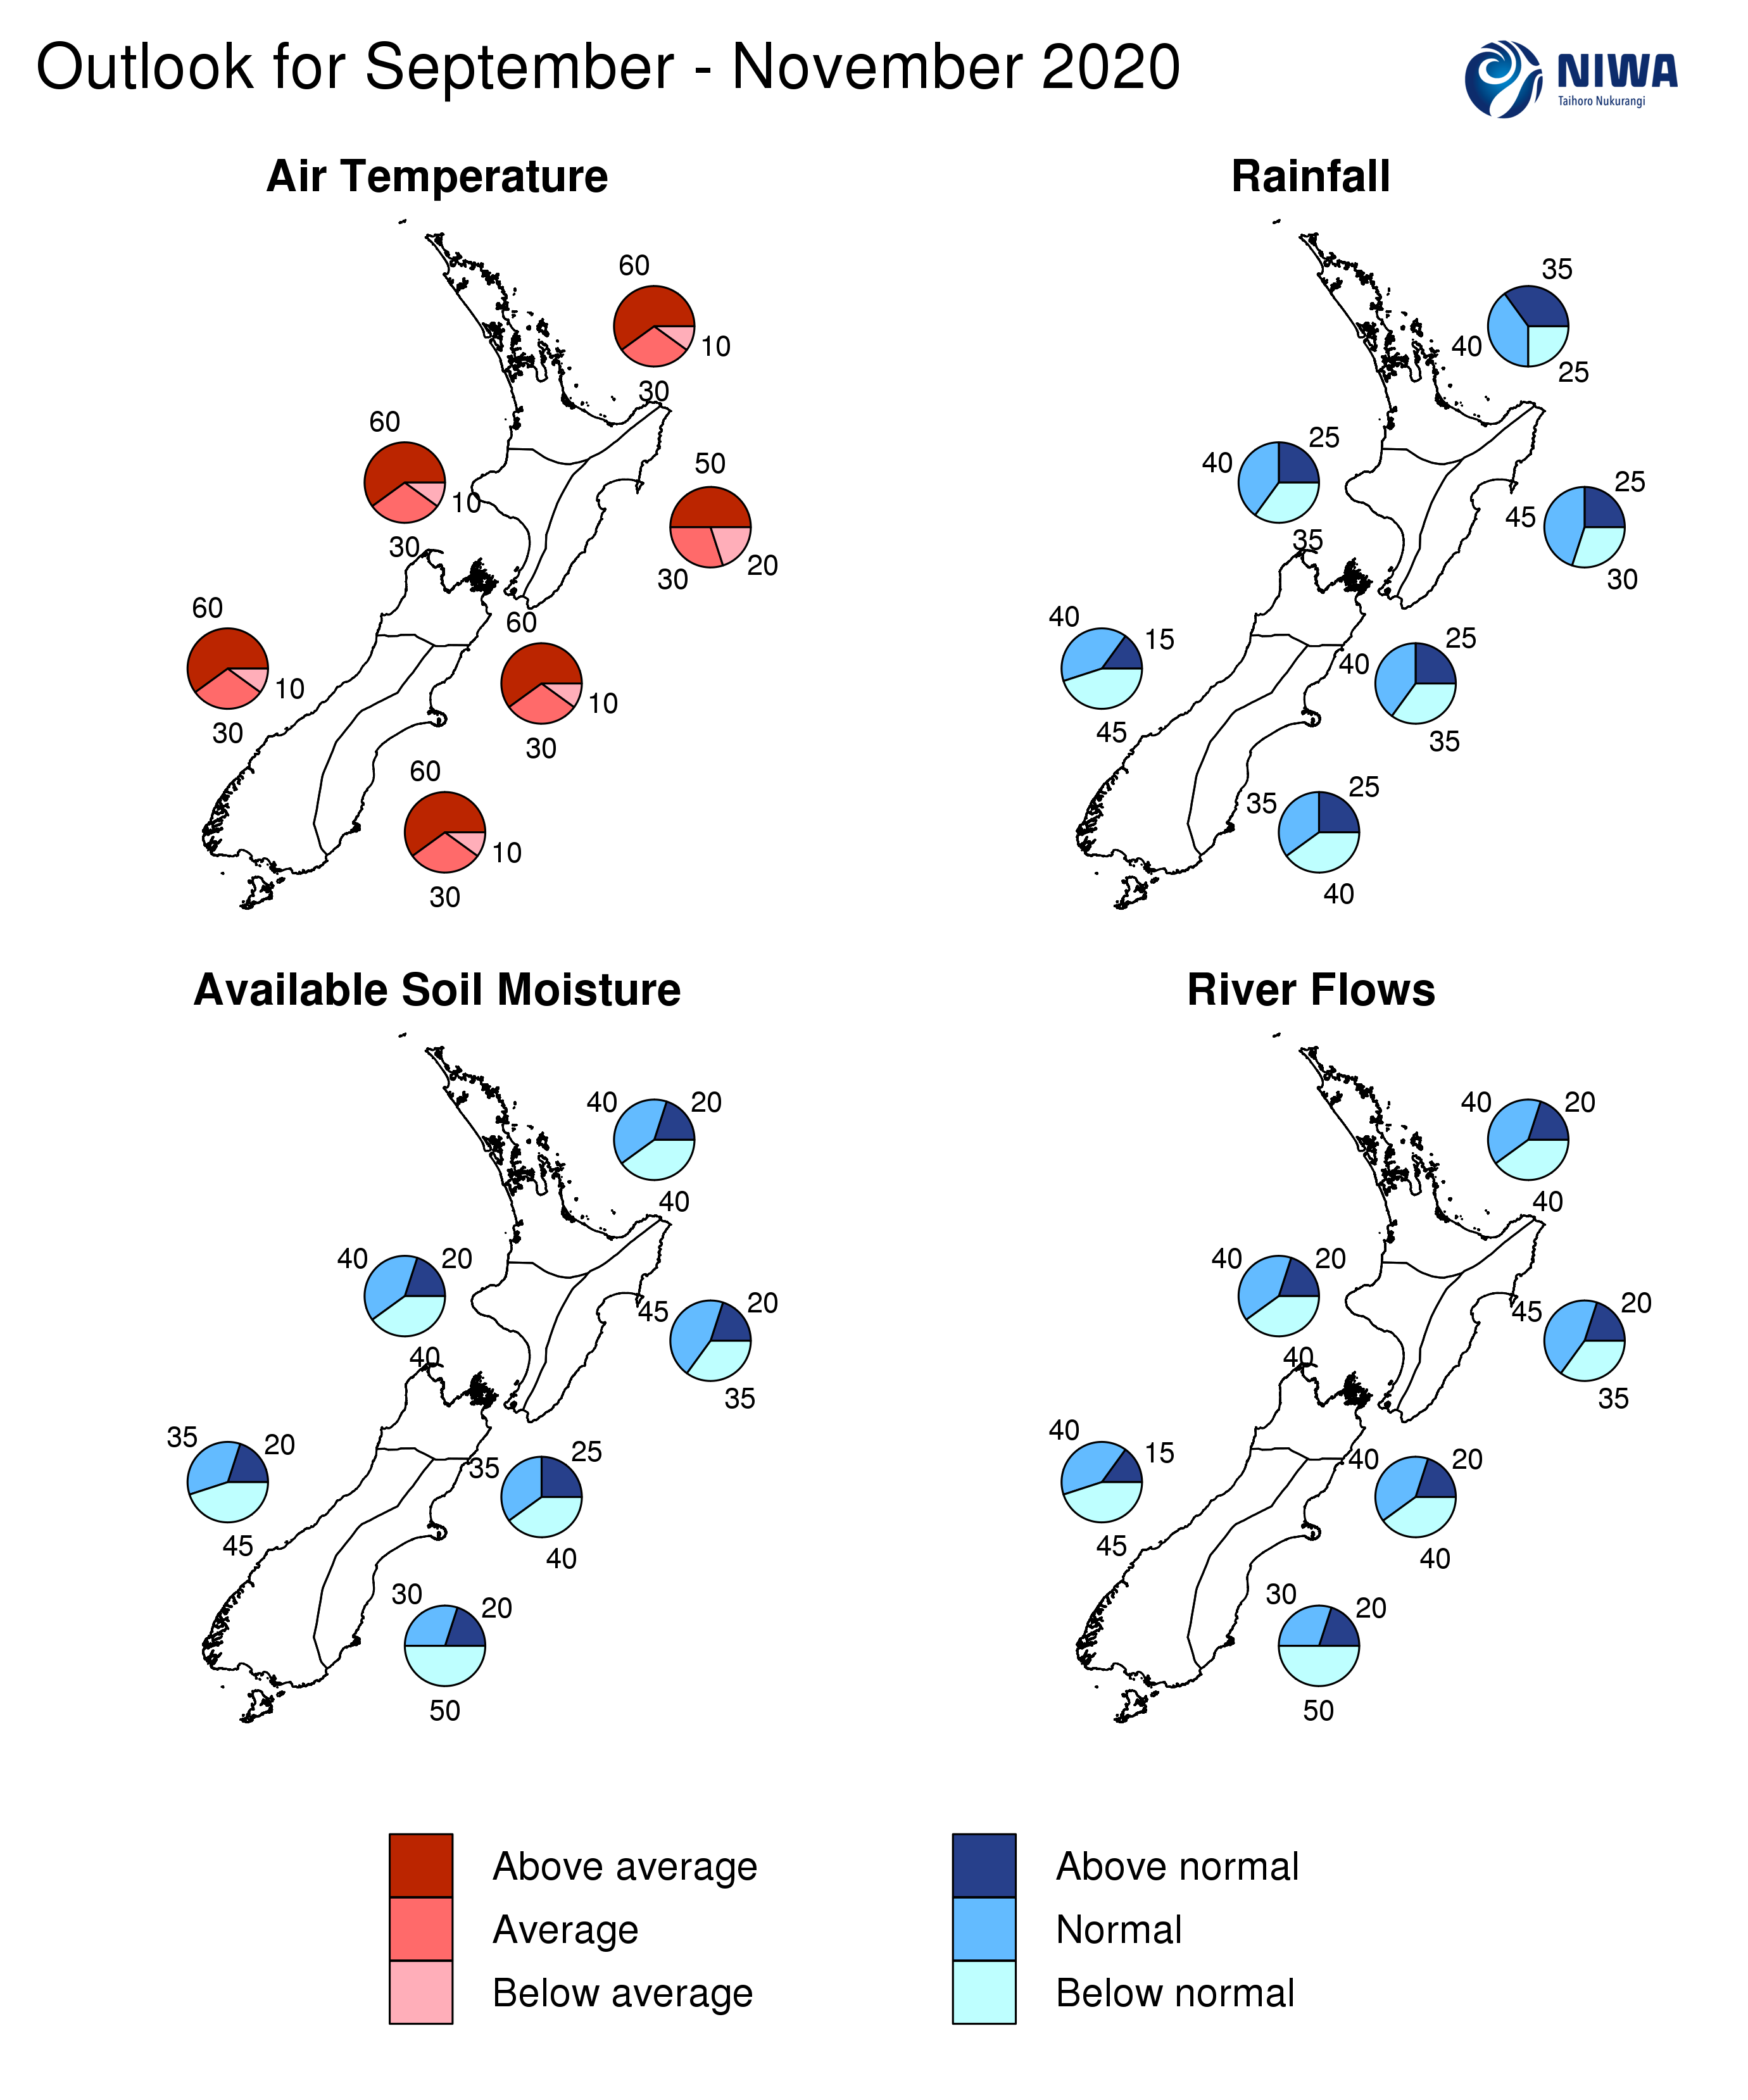
- Soil moisture levels are most likely to be below normal in the west and east of the South Island with river flows in the east most likely to be below normal. Near normal soil moisture levels and river flows are most likely in the east of the North Island. For all other regions, soil moisture levels and river flows are about equally likely to be near normal or below normal.
Regional predictions for September – November 2020
Northland, Auckland, Waikato, Bay of Plenty
The table below shows the probabilities (or percent chances) for each of three categories: above average, near average, and below average. In the absence of any forecast guidance there would be an equal likelihood (33% chance) of the outcome being in any one of the three categories. Forecast information from local and global guidance models is used to indicate the deviation from equal chance expected for the coming three-month period, with the following outcomes the most likely (but not certain) for this region:
- Temperatures are very likely to be above average (60% chance).
- Rainfall totals are about equally likely to be near normal (40% chance) or above normal (35% chance).
- Soil moisture levels and river flows are about equally likely to be near normal (40% chance) or below normal (40% chance).
The full probability breakdown is:
|
Temperature |
Rainfall |
Soil moisture |
River flows |
|
|
Above average |
60 |
35 |
20 |
20 |
|
Near average |
30 |
40 |
40 |
40 |
|
Below average |
10 |
25 |
40 |
40 |
Central North Island, Taranaki, Whanganui, Manawatu, Wellington
Probabilities are assigned in three categories: above average, near average, and below average.
- Temperatures are very likely to be above average (60% chance).
- Rainfall totals are about equally likely to be near normal (40% chance) or below normal (35% chance).
- Soil moisture levels and river flows are about equally likely to be near normal (40% chance) or below normal (40% chance).
The full probability breakdown is:
|
Temperature |
Rainfall |
Soil moisture |
River flows |
|
|
Above average |
60 |
25 |
20 |
20 |
|
Near average |
30 |
40 |
40 |
40 |
|
Below average |
10 |
35 |
40 |
40 |
Gisborne, Hawke’s Bay, Wairarapa
Probabilities are assigned in three categories: above average, near average, and below average.
- Temperatures are most likely to be above average (50% chance).
- Rainfall totals are most likely to be near normal (45% chance).
- Soil moisture levels and river flows are most likely to be near normal (45% chance).
The full probability breakdown is:
|
Temperature |
Rainfall |
Soil moisture |
River flows |
|
|
Above average |
50 |
25 |
20 |
20 |
|
Near average |
30 |
45 |
45 |
45 |
|
Below average |
20 |
30 |
35 |
35 |
Tasman, Nelson, Marlborough, Buller
Probabilities are assigned in three categories: above average, near average, and below average.
- Temperatures are very likely to be above average (60% chance).
- Rainfall totals are about equally likely to be near normal (40% chance) or below normal (35% chance).
- Soil moisture levels and river flows are about equally likely to be near normal (35-40% chance) or below normal (40% chance).
The full probability breakdown is:
|
Temperature |
Rainfall |
Soil moisture |
River flows |
|
|
Above average |
60 |
25 |
25 |
20 |
|
Near average |
30 |
40 |
35 |
40 |
|
Below average |
10 |
35 |
40 |
40 |
West Coast, Alps and foothills, inland Otago, Southland
Probabilities are assigned in three categories: above average, near average, and below average.
- Temperatures are very likely to be above average (60% chance).
- Rainfall totals are about equally likely to be near normal (40% chance) or below normal (45% chance).
- Soil moisture levels are most likely to be below normal (45% chance) while river flows are about equally likely to be near normal (40% chance) or below normal (45% chance).
The full probability breakdown is:
|
Temperature |
Rainfall |
Soil moisture |
River flows |
|
|
Above average |
60 |
15 |
20 |
15 |
|
Near average |
30 |
40 |
35 |
40 |
|
Below average |
10 |
45 |
45 |
45 |
Coastal Canterbury, east Otago
Probabilities are assigned in three categories: above average, near average, and below average.
- Temperatures are very likely to be above average (60% chance).
- Rainfall totals are about equally likely to be near normal (35% chance) or below normal (40% chance).
- Soil moisture levels and river flows are most likely to be below normal (50% chance).
The full probability breakdown is:
|
Temperature |
Rainfall |
Soil moisture |
River flows |
|
|
Above average |
60 |
25 |
20 |
20 |
|
Near average |
30 |
35 |
30 |
30 |
|
Below average |
10 |
40 |
50 |
50 |
Graphical representation of the regional probabilities
Background
The NINO3.4 Index anomaly (in the central Pacific) for the month of August (through the 23rd) was -0.39˚C, decreasing from +0.04˚C last month. The NINO 1+2 Index posted a value of -0.89˚C, decreasing from -0.72˚C last month. The SOI (Southern Oscillation Index) value for the month of August (through the 25th) was +0.9 (near the La Niña threshold).
Upper-oceanic heat content remained lower than normal in the eastern and central equatorial Pacific with a substantial decrease observed in the east-central part of the basin. Heat content was moderately higher than normal in the west. Overall, this pattern is well aligned with a developing La Niña event.
In the subsurface ocean, an upwelling Kelvin wave resulted in a decrease of ocean temperatures at depth (to 200 m) in the central equatorial Pacific. This feature will likely surface in the east-central equatorial Pacific during the next three months, solidifying an oceanic La Niña state.
Trade winds during August were stronger than normal across the equatorial Pacific, particularly in the central part of the basin. This contributed to upwelling, which led to cooling sea surface temperatures, representing an oceanic trend in the La Niña direction. This pattern is expected to continue into spring, with enhanced trade winds focusing on the central equatorial Pacific – this may mean that the coolest ocean temperatures, with respect to average, end up occurring there.
According to the consensus from international models, the probability for La Niña conditions is 57% for September – November, an increase of 3% from last month. For the December 2020 -February 2021 period, the probability for La Niña is 46% and 43% for neutral.
New Zealand’s coastal water temperature anomalies became more anomalously warm during August. This is expected to continue to have an upward influence on air temperatures through the spring season. Of note is the forecast by several models for well above average Tasman Sea surface temperatures by the end of the season. The last La Niña event (2017-18) saw marine heatwave conditions develop around New Zealand in November-December 2017.
New Zealand Coastal Sea Surface Temperatures during August 2020 (to the 25th):
|
North NI |
West NI |
East NI |
North SI |
West SI |
East SI |
|
+0.67˚C |
+0.97˚C |
+0.60˚C |
+0.92˚C |
+1.01˚C |
+0.84˚C |
Southern Annular Mode (SAM)
The Southern Annular Mode (SAM) was briefly positive at the start of August, then turned negative for two weeks. The SAM is predicted to turn positive during the first week of September, associated with the development a large ridge of high pressure and a lack of rainfall in the New Zealand region.
The Madden-Julian Oscillation (MJO) was convectively active over Indonesia early in August, then over Africa and the western Indian Ocean late in the month. The pattern triggered a La Niña-like atmospheric response, but there has been enough variability to suggest the ocean-atmosphere system has yet to fully couple.
Overall, the La Niña-like response is expected to continue through the spring season and the existence of a meaningful ENSO signal should help with climate predictability in New Zealand. A classical La Niña spring involves more northeasterly quarter winds than normal. La Niña springs have historically been associated with below normal rainfall for swaths of the South Island and lower North Island as well as above average temperatures for much of the country.
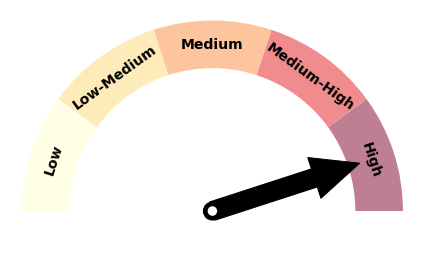
Forecast Confidence
Temperature
|
Forecast confidence for temperatures is high. Guidance is in strong agreement for a warmer than average spring across New Zealand, owing to more northeasterly winds than normal and warmer than average coastal sea temperatures. |
Rainfall
|
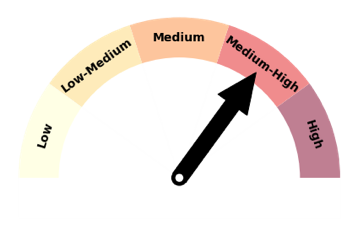
|
Forecast confidence for rainfall is medium to high. A signal for La Niña-like conditions in the tropical Pacific helps with predictability. La Niña tends to bring more northeasterly winds to New Zealand, which lends confidence to the distinctive rainfall pattern described in this outlook. |
