Outlook Summary
- Moderate La Niña conditions continued during October. La Niña will have a meaningful influence on Aotearoa New Zealand’s climate in the coming months. See the background for more information.
- Air pressure is forecast to be higher than normal over and to the south of the South Island and lower than normal north of the country. This will likely result in an easterly quarter air flow anomaly and fewer westerly winds over the three months as a whole.
- Early November is expected to have a period of strong northwesterly winds and heavy rain in the western South Island. This marks a period of intraseasonal variability when weather patterns briefly diverge from the typical La Niña regime; this is expected to occur at times over the next three months.
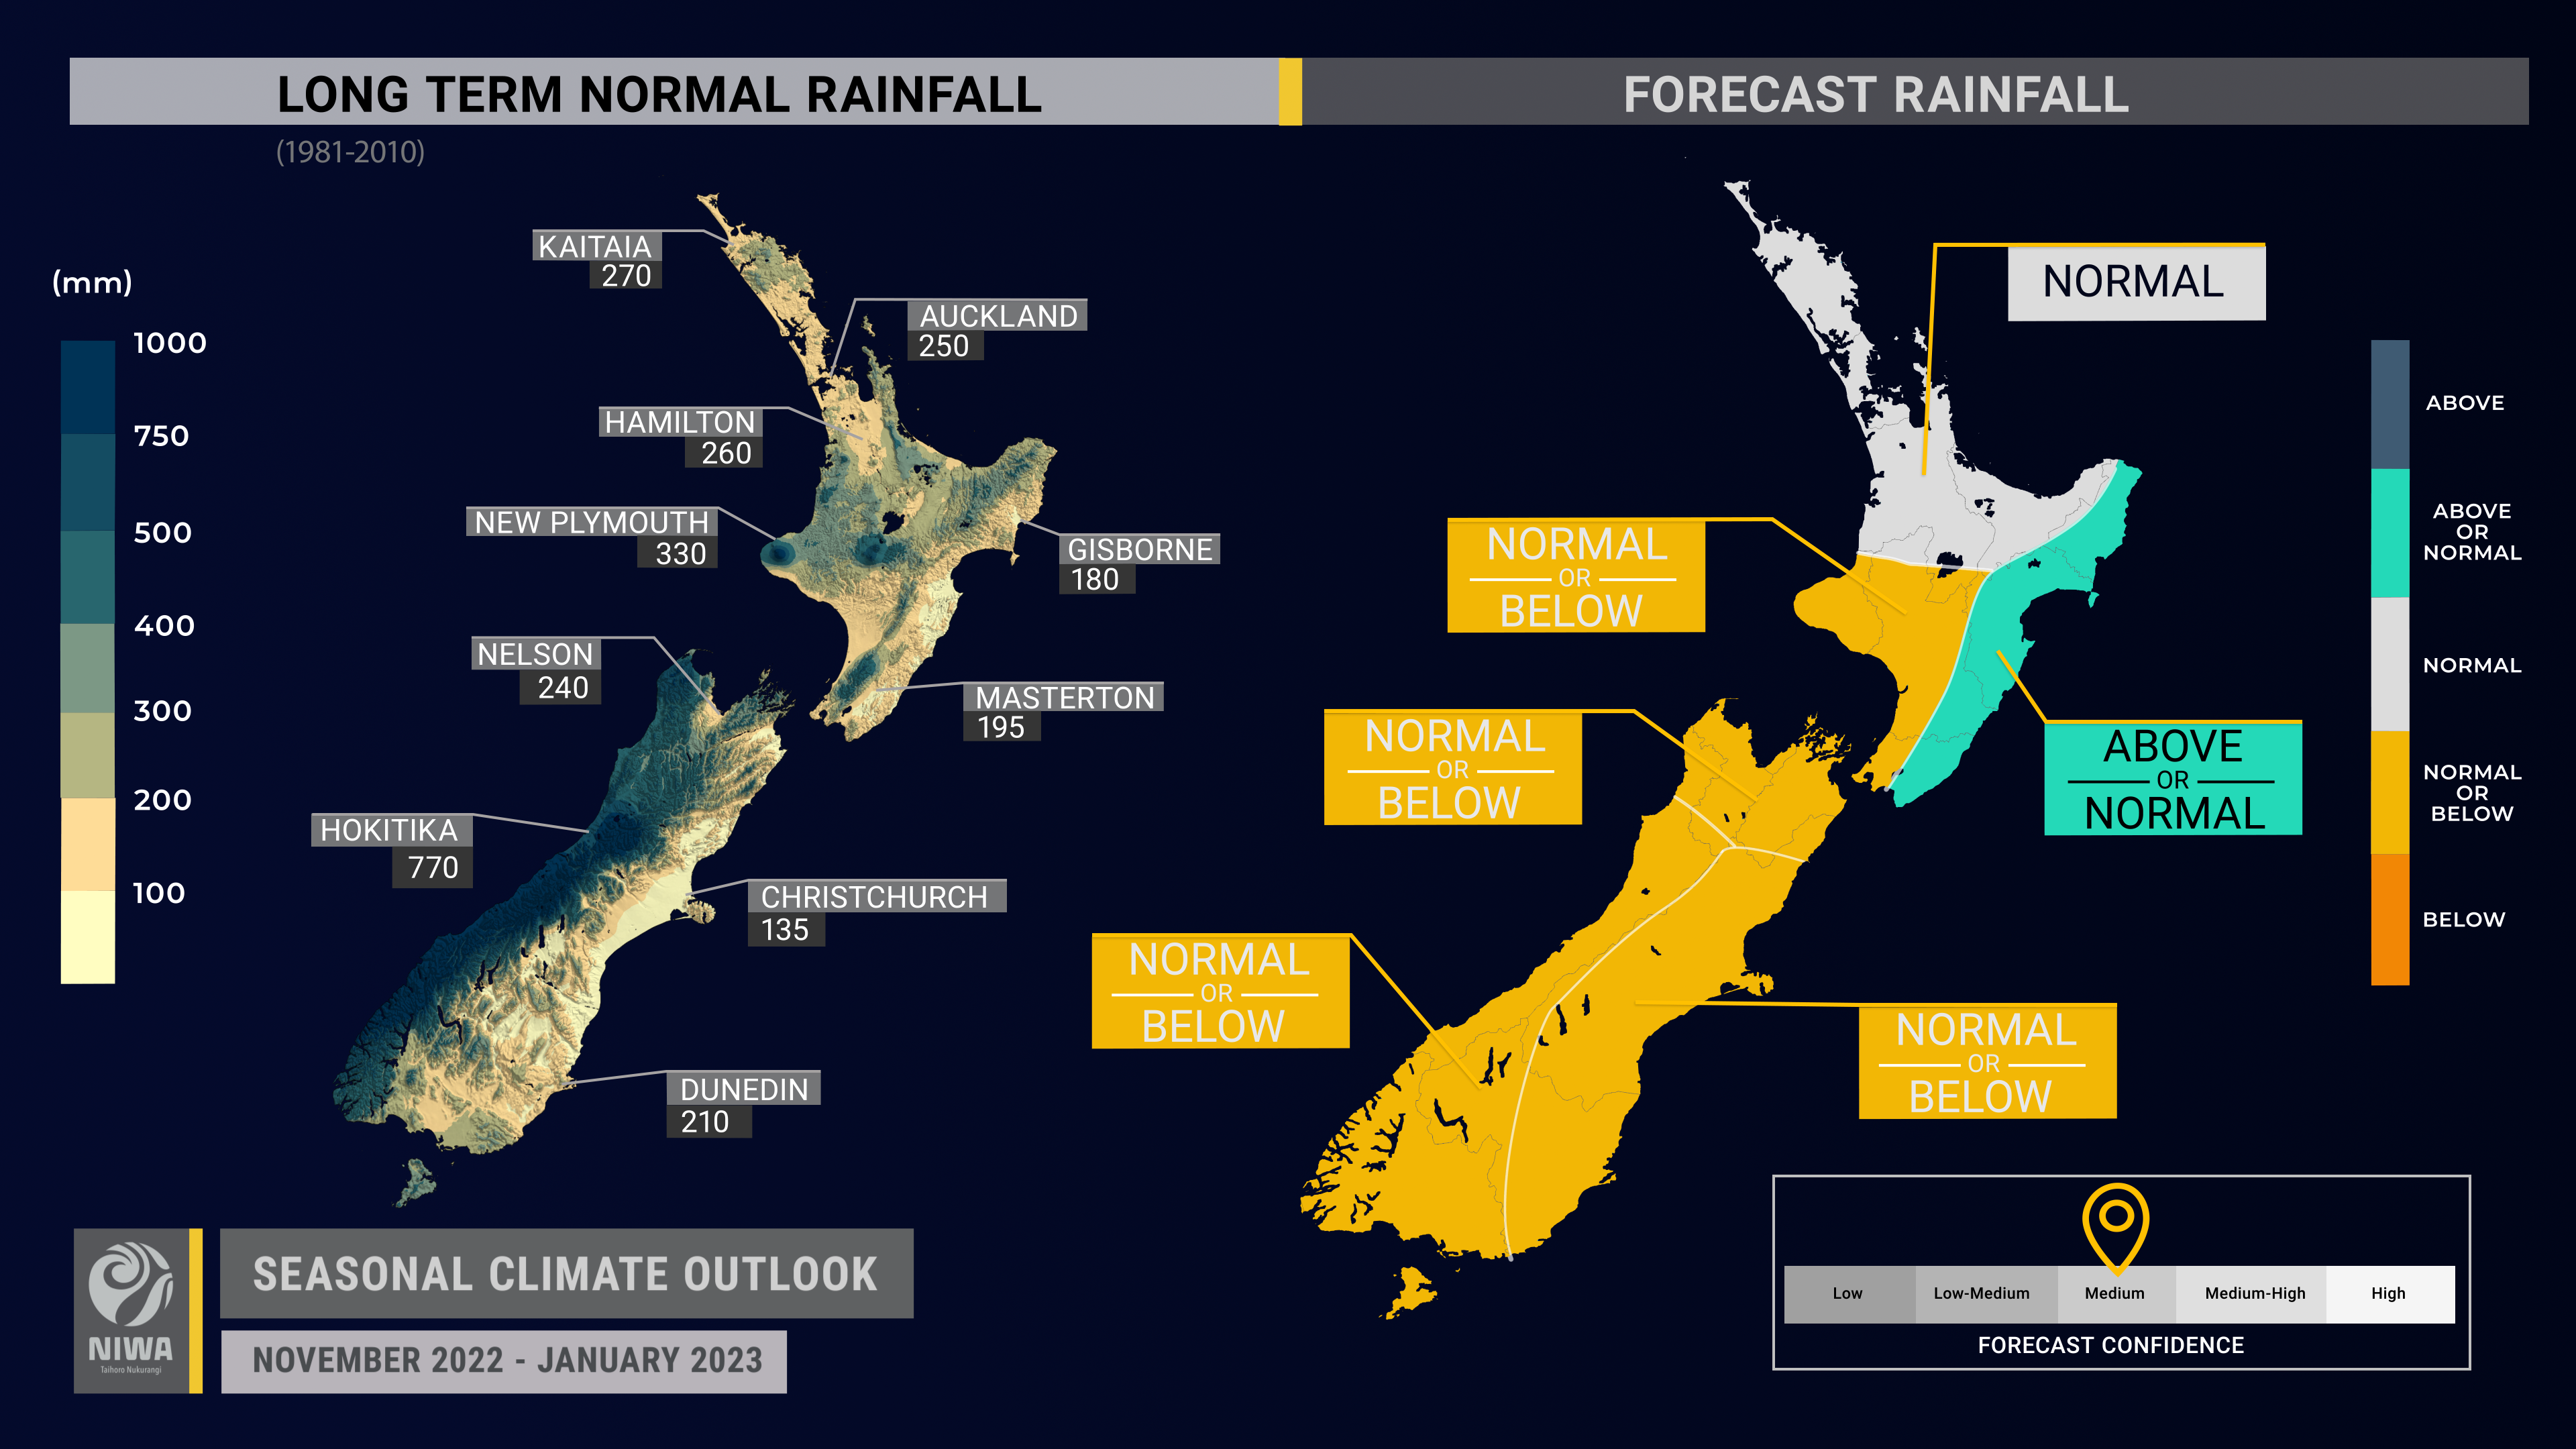
- Rainfall is about equally likely to be near normal or above normal in the east of the North Island, most likely to be near normal in the north of the North Island, and equally likely to be near normal or below normal in all other regions.
- A dry spell may develop during the second week of November. Such periods will occur occasionally through the season, increasing the risk for lower than normal soil moisture. These dry periods may be occasionally interspersed with tropical downpours, especially in the north.
- There is an increased risk for early-season tropical cyclone activity in the Southwest Pacific, however it is not possible to predict where they might form or track months in advance. Follow this link for NIWA’s tropical cyclone outlook.
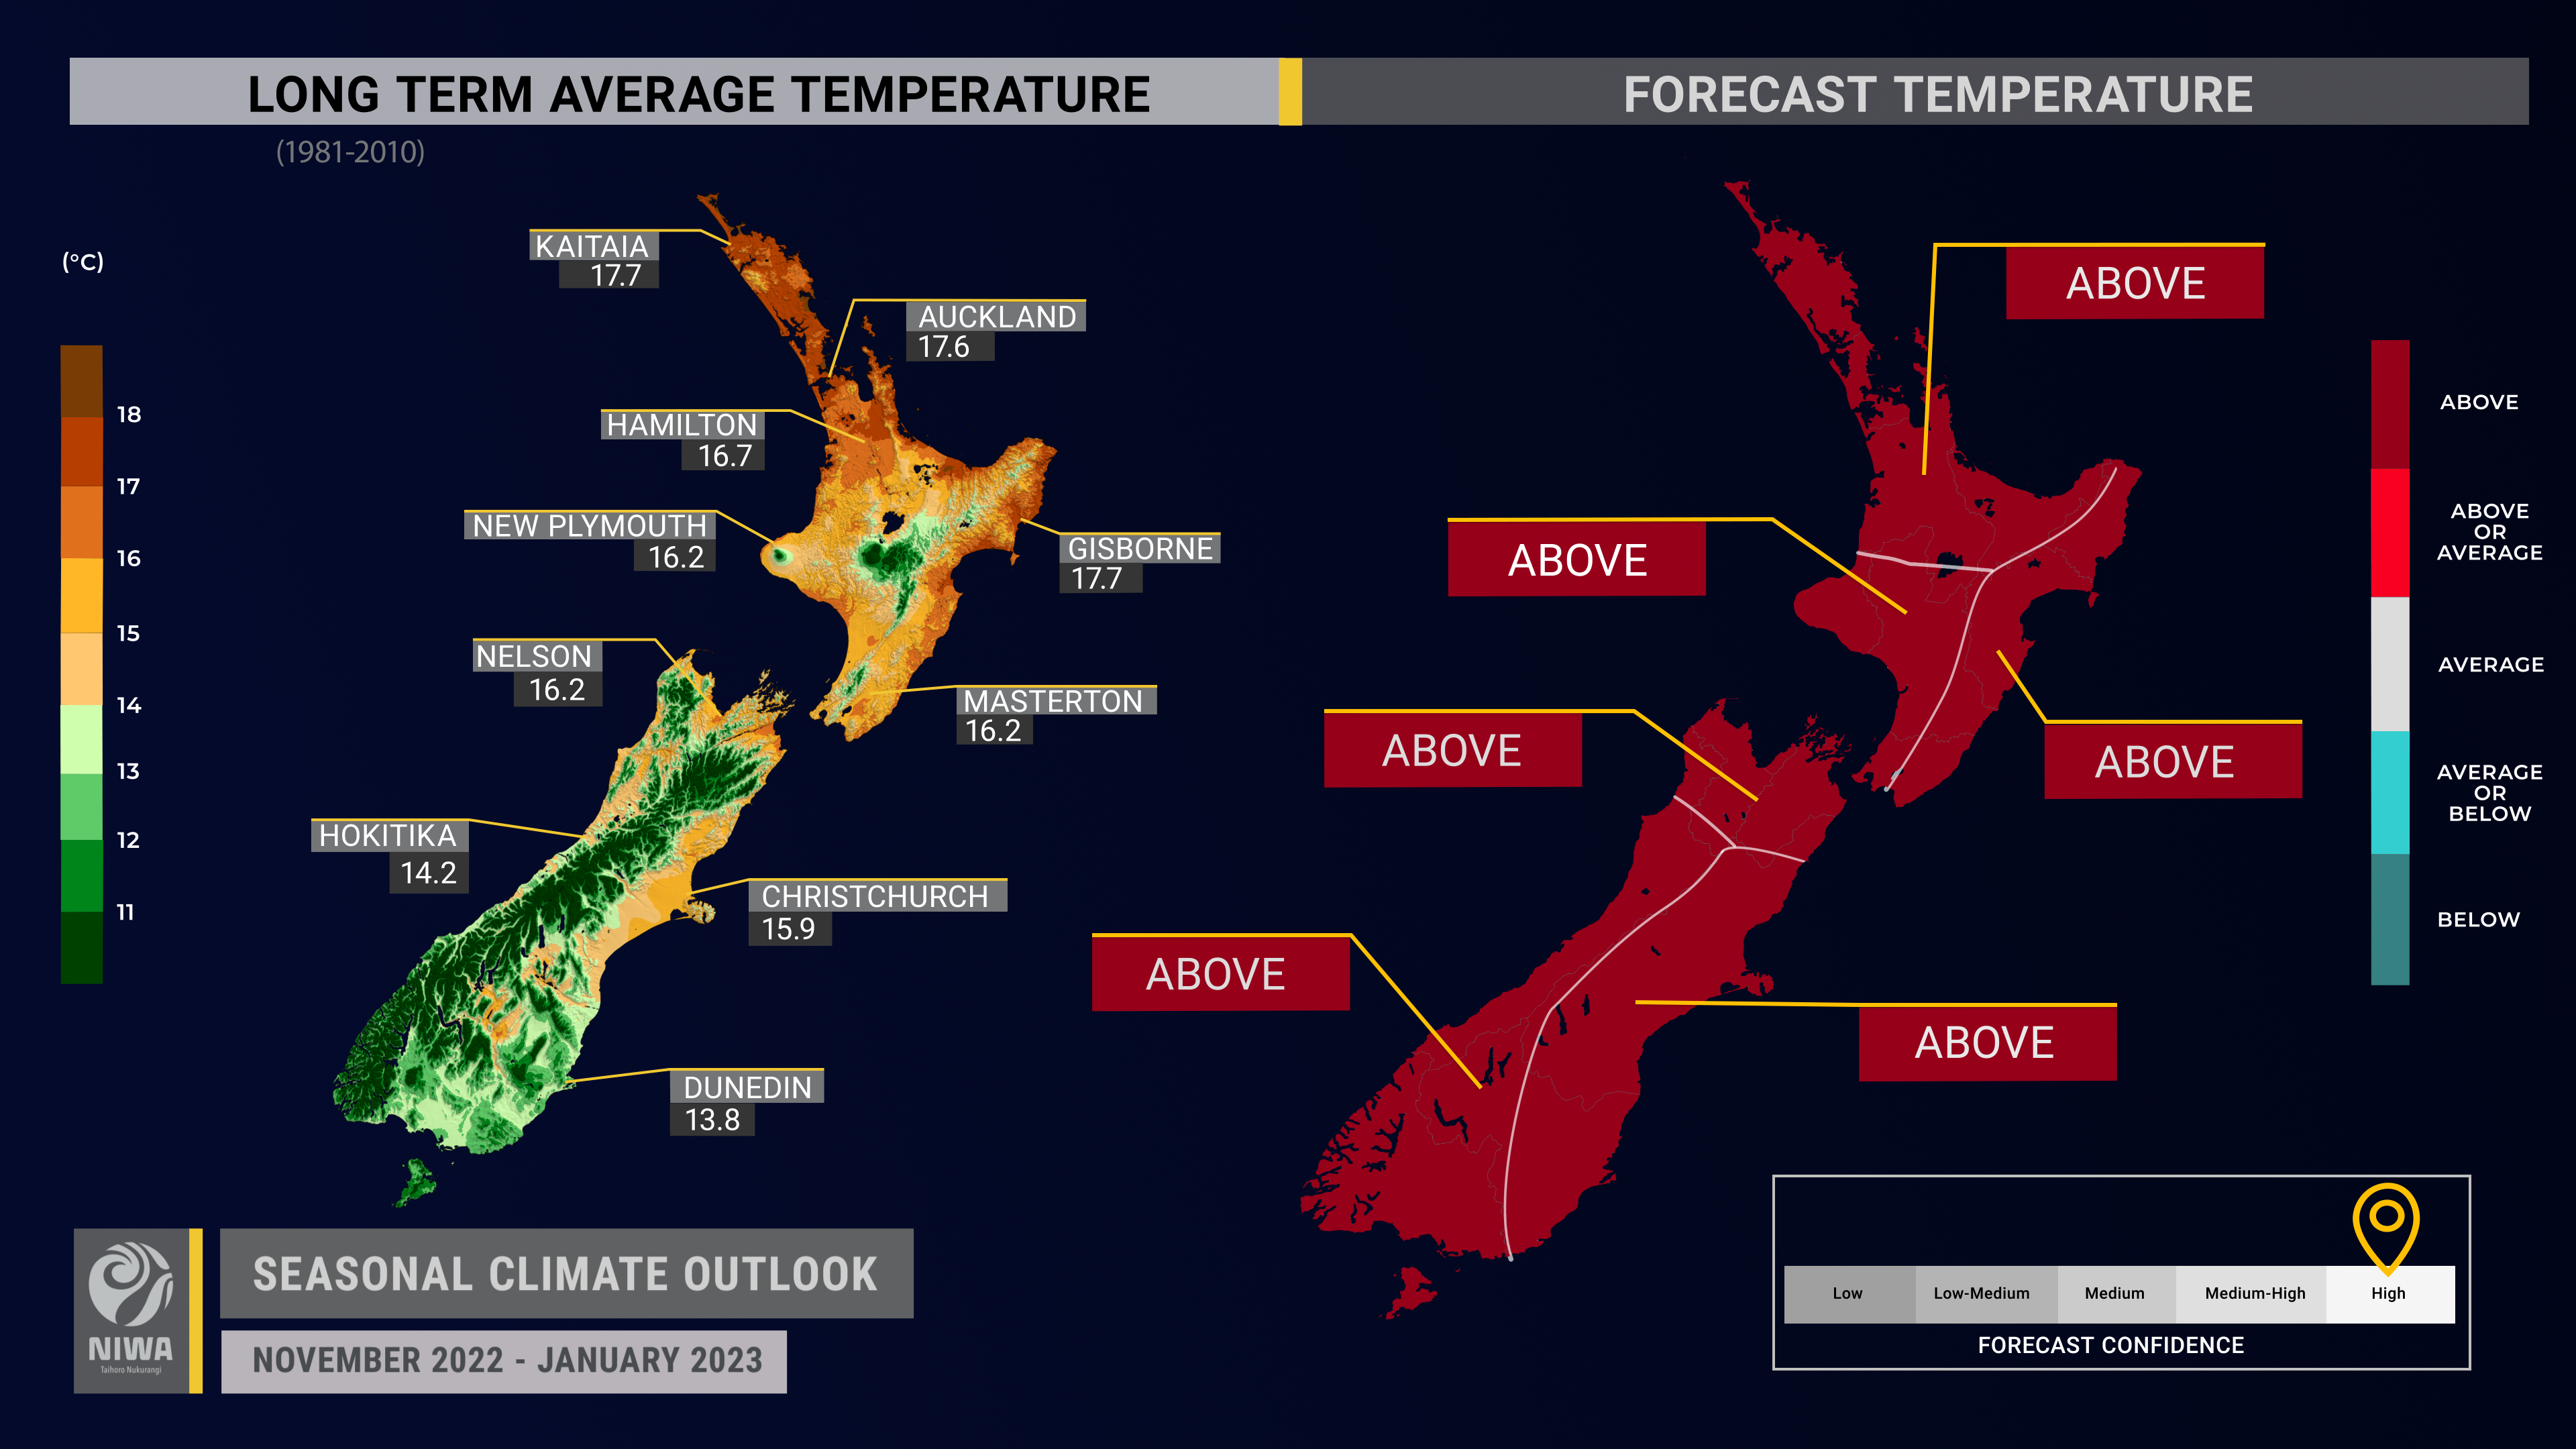
- Temperatures are very likely to be warmer than average in the north of the North Island and the west of both islands. Above average warmth and periodic humidity is expected from November, a change from the relatively cooler conditions experienced during October.
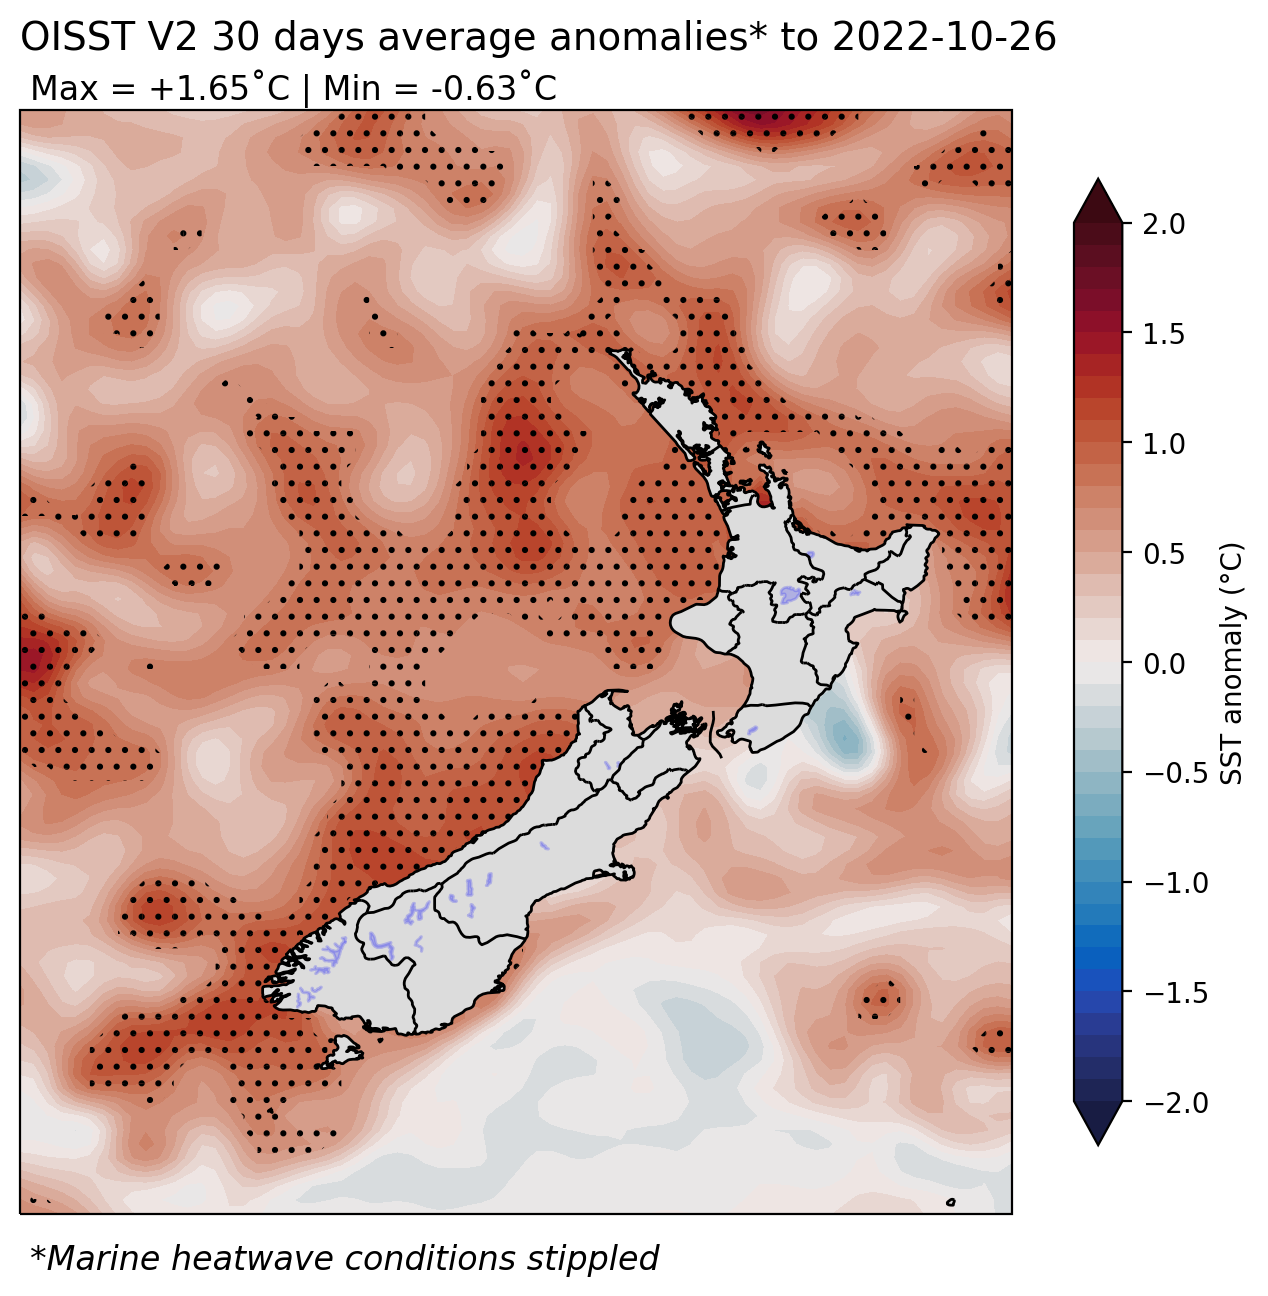
- Coastal sea surface temperatures (SSTs) ranged from 0.3˚C to 1.0˚C above average during October. Conditions became less unusually warm in all regions except the west of the South Island during the month due to frequent south-east winds. Warm conditions during November may see SSTs increase notably. For more information, see the NIWA SST Update.
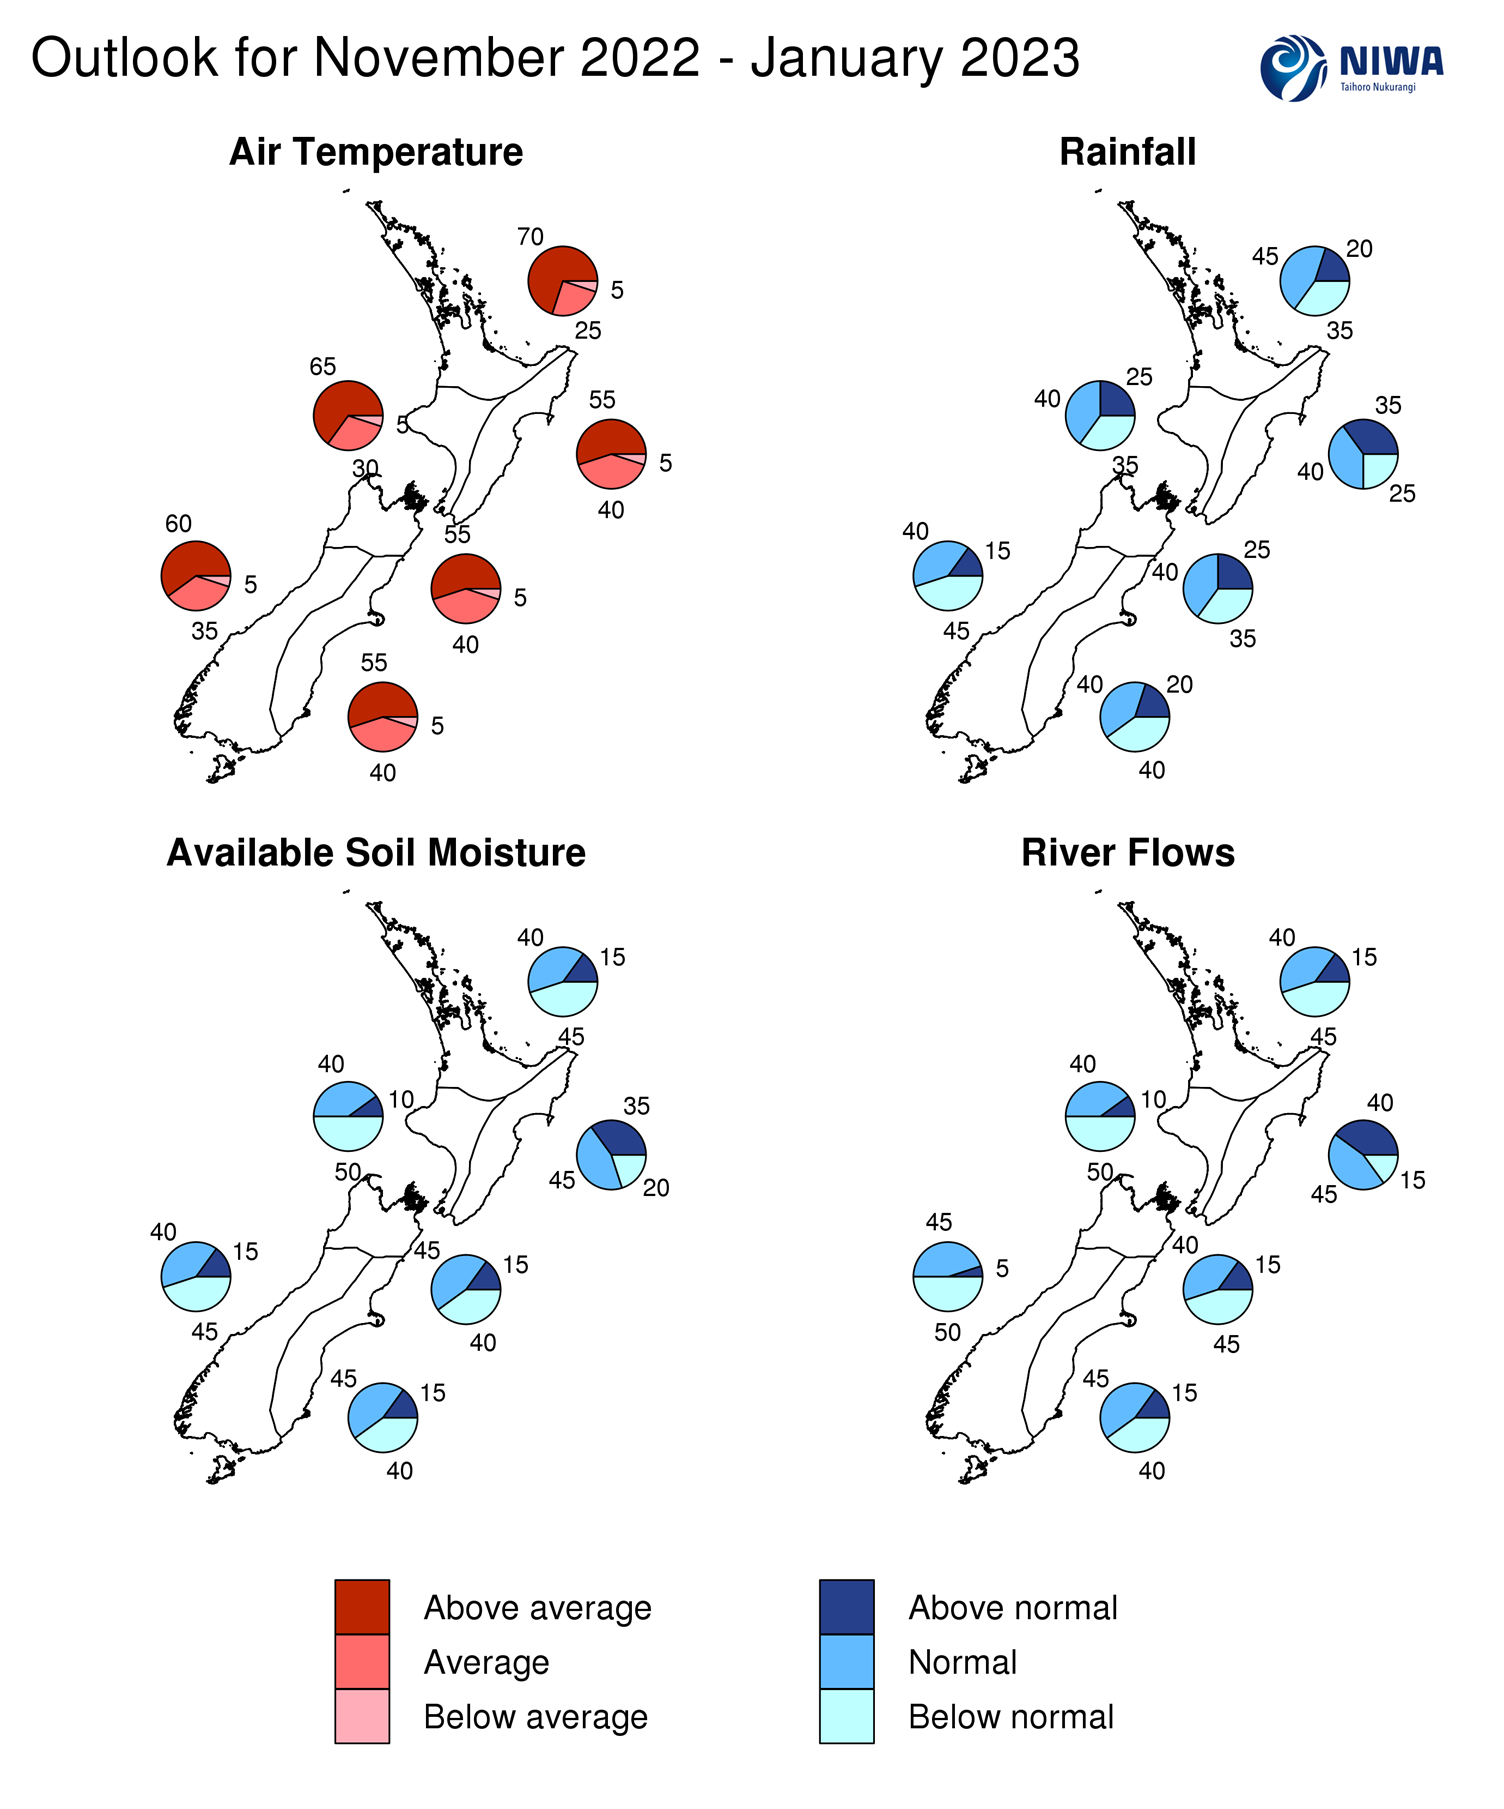
- Soil moisture levels and river flows are most likely to be below normal in the west of the North Island and about equally likely to be near normal or below normal in all other regions except the east of the North Island where soil moisture is most likely to be near normal and river flows near normal or above normal.
Regional predictions for November 2022 – January 2023
Northland, Auckland, Waikato, Bay of Plenty
The table below shows the probabilities (or percent chances) for each of three categories: above average, near average, and below average. In the absence of any forecast guidance there would be an equal likelihood (33% chance) of the outcome being in any one of the three categories. Forecast information from local and global guidance models is used to indicate the deviation from equal chance expected for the coming three-month period, with the following outcomes the most likely (but not certain) for this region:
- Temperatures are very likely to be above average (70% chance). More northeasterly winds and marine heatwave conditions will result in high heat and humidity at times.
- Rainfall totals are most likely to be near normal (45% chance) for the season as a whole. However, note that there is a 35% chance for below normal rainfall. There is an increased risk for dry spells over the period, like what was experienced in 2020-21 and 2021-22. Occasional tropical moisture plumes are also possible.
- Soil moisture levels and river flows are about equally likely to be below normal (45% chance) or near normal (40% chance).
The full probability breakdown is:
|
Temperature |
Rainfall |
Soil moisture |
River flows |
|
|
Above average |
70 |
20 |
15 |
15 |
|
Near average |
25 |
45 |
40 |
40 |
|
Below average |
05 |
35 |
45 |
45 |
Central North Island, Taranaki, Whanganui, Manawatu, Wellington
Probabilities are assigned in three categories: above average, near average, and below average.
- Temperatures are very likely to be above average (65% chance). More northeasterly winds and warmer than average coastal seas will result in high heat and humidity at times.
- Rainfall totals are about equally likely to be near normal (40% chance) or below normal (35% chance). Fewer westerly winds will likely increase the risk for dry spells.
- Soil moisture levels and river flows are most likely to be below normal (50% chance).
The full probability breakdown is:
|
Temperature |
Rainfall |
Soil moisture |
River flows |
|
|
Above average |
65 |
25 |
10 |
10 |
|
Near average |
30 |
40 |
40 |
40 |
|
Below average |
05 |
35 |
50 |
50 |
Gisborne, Hawke’s Bay, Wairarapa
Probabilities are assigned in three categories: above average, near average, and below average.
- Temperatures are most likely to be above average (55% chance). More northeasterly winds may lead to higher humidity levels, more cloud cover, and warmer overnight temperatures. Fewer northwesterly winds may limit the number of hot days (above 25˚C).
- Rainfall totals are about equally likely to be near normal (40% chance) or above normal (35% chance). More frequent onshore winds could lead to more wet days (more than 1 mm of rain). Occasional tropical moisture plumes are also possible, particularly for northern Hawke’s Bay and Gisborne.
- Soil moisture levels are most likely to be near normal (45% chance) and river flows are about equally likely to be near normal or above normal (40-45% chance).
The full probability breakdown is:
|
Temperature |
Rainfall |
Soil moisture |
River flows |
|
|
Above average |
55 |
35 |
35 |
40 |
|
Near average |
40 |
40 |
45 |
45 |
|
Below average |
05 |
25 |
20 |
15 |
Tasman, Nelson, Marlborough, Buller
Probabilities are assigned in three categories: above average, near average, and below average.
- Temperatures are most likely to be above average (55% chance). More northeasterly winds and warmer than average coastal seas will result in high heat and humidity at times.
- Rainfall is about equally likely to be near normal (40% chance) or below normal (35% chance). Fewer westerly winds will likely increase the risk for dry spells, particularly in Tasman and Buller. More easterly winds could lead to more wet days (more than 1 mm of rain) in Marlborough.
- Soil moisture levels and river flows are about equally likely to be near normal or below normal (40-45% chance).
The full probability breakdown is:
|
Temperature |
Rainfall |
Soil moisture |
River flows |
|
|
Above average |
55 |
25 |
15 |
15 |
|
Near average |
40 |
40 |
45 |
40 |
|
Below average |
05 |
35 |
40 |
45 |
West Coast, Alps and foothills, inland Otago, Southland
Probabilities are assigned in three categories: above average, near average, and below average.
- Temperatures are very likely to be above average (60% chance). More northeasterly winds and marine heatwave conditions will result in high heat at times.
- Rainfall totals are about equally likely to be below normal (45% chance) or near normal (40% chance). Early November will feature a band of heavy rain with the potential for flooding. However, over the season as a whole, more offshore winds will likely result in extended dry spells. Low rainfall may also occur around the hydro lakes.
- Soil moisture levels and river flows are about equally likely to be near normal (40-45% chance) or below normal (45-50% chance).
The full probability breakdown is:
|
Temperature |
Rainfall |
Soil moisture |
River flows |
|
|
Above average |
60 |
15 |
15 |
05 |
|
Near average |
35 |
40 |
40 |
45 |
|
Below average |
05 |
45 |
45 |
50 |
Coastal Canterbury, east Otago
Probabilities are assigned in three categories: above average, near average, and below average.
- Temperatures are most likely to be above average (55% chance). Fewer northwesterly winds may lead to fewer hot days (above 25˚C), although more frequent northeasterly winds may contribute to more cloud cover and warmer overnight temperatures.
- Rainfall totals are equally likely to be near normal (40% chance) or below normal (40% chance). Frequent anticyclones may contribute to long dry spells, increasing the risk for lower than normal soil moisture. These may be interspersed with moisture plumes that bring rain from the north, particularly for North Canterbury.
- Soil moisture levels and river flows are about equally likely to be near normal or below normal (40-45% chance).
The full probability breakdown is:
|
Temperature |
Rainfall |
Soil moisture |
River flows |
|
|
Above average |
55 |
20 |
15 |
15 |
|
Near average |
40 |
40 |
45 |
45 |
|
Below average |
05 |
40 |
40 |
40 |
Graphical representation of the regional probabilities
Background
The NINO3.4 Index anomaly (in the central equatorial Pacific) over the last month (through 26 October) was -0.80˚C (climatology: 1991-2020), in the La Niña range for the third consecutive month.
The NINO 1+2 Index (near the west coast of South America) cooled substantially to -1.86˚C. In the last four decades, only 2013, 2007, and 1985 had cooler 30-day anomalies than 2022 in this region.
The provisional October monthly Southern Oscillation Index (SOI) was +1.8 and +1.6 from August-October (climatology: 1991-2020), both well within the La Niña range.
Trade winds were much stronger than normal across the central and western equatorial Pacific during October, maintaining a moderate La Niña strength.
In the subsurface central equatorial Pacific, October conditions mirrored those of September. Sub-surface anomalies of -3˚C to -5˚C spanned from just below the surface in the east to 150 m depth in the central. This was juxtaposed by a particularly strong West Pacific warm pool.
The odds for La Niña’s continuation during November-January is around 85%. NIWA’s analysis indicates that a moderate La Niña event is ongoing and is expected to last through the first half of summer with an easing possible during late summer and/or autumn. This is the first “triple dip” La Niña (three consecutive La Niña events from 2020-2022) since 1998-2000.
A SST seesaw in the Indian Ocean, called the Indian Ocean Dipole (IOD), continued in its negative phase during October, contributing to lower air pressure around Australia and the wider Maritime Continent along with greater moisture availability. New Zealand was largely shielded from these moisture plumes due to high pressure. Forcing from the IOD is expected to last through most of November. Historical occurrences of a negative IOD during November resulted in wetter than normal conditions in the eastern North Island and drier conditions in the South Island, particularly in the south and west. As the negative IOD eases after November, La Niña will become the main driver of seasonal climate variability in the tropics, with typical impacts for New Zealand including more easterly to northeasterly winds, warmer temperatures, lower rainfall about inland and western parts of both islands, and less frequent hot days in the east of both islands.
However, the La Niña-like influence on New Zealand’s patterns will ebb and flow – the first week of November will see a pulse of intraseasonal variability in the tropical eastern Pacific and Africa, steering the prevailing pattern away from a typical La Niña setup. This will result in more northwesterly winds for a time, with a likelihood for heavy rainfall in the western South Island. This will ease after about 5 November, with the remainder of the month seeing a more classical La Niña and IOD forcing pattern over the Indian Ocean and Maritime Continent.
During late November and early December, another period of intraseasonal variability is possible, with a convective pulse moving across the tropical Pacific Ocean. This may increase the odds for heavy rainfall in parts of New Zealand and/or tropical cyclone activity in the region. The associated Madden-Julian Oscillation phases (6-7) have historically been associated with drier than normal conditions in the eastern and lower South Island, such as across Canterbury and Otago.
The Southern Annular Mode (SAM) spent most of the first three weeks of October in its positive phase, in association with higher than normal air pressure in the New Zealand region and lower than normal pressure across Antarctica. The SAM turned negative at the end of October, coinciding with an increase in Tasman Sea storminess. The SAM will likely continue to spend more time in its positive phase over the next season, similar to the last two summers which also featured La Niña conditions.
New Zealand’s coastal water temperatures became less unusually warm in all regions except the west of the South Island during October. This was linked to more south-east winds than normal. Despite this, marine heatwave (MHW) conditions were still occurring near the northern North Island and western South Island. A warm and humid end to October and start to November will likely see SSTs rise notably. Sub-seasonal guidance indicates another unusually warm period after 10 November. The NIWA Sea Surface Temperature Update suggests that seas will warm appreciably from November-December with the potential for MHW conditions to last well into the new year. Given the high-impact nature of recent summer marine heatwaves, the marine sector should monitor this situation closely.
NZ 30-day coastal SST anomalies (to 26 October)
|
North NI |
+0.88˚C |
|
West NI |
+0.57˚C |
|
East NI |
+0.29˚C |
|
North SI |
+0.56˚C |
|
West SI |
+0.95˚C |
|
East SI |
+0.40˚C |
Forecast Confidence
Temperature
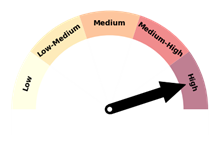
|
Forecast confidence for temperatures is high. All of the climate models that NIWA surveys expect a warmer than average November-January. However, it is worth acknowledging that the seasonal guidance was biased warm (too warm) during September-October, however now short-to-medium term guidance is picking up on a transition to warmer than average temperatures. |
Rainfall
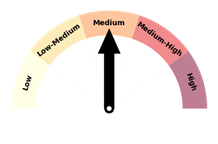
|
Forecast confidence for rainfall is medium. The existence of strong climate drivers like La Niña and the Indian Ocean Dipole is expected to enhance seasonal climate predictability. While the climate models that NIWA surveys are in relatively good agreement, the potential for occasional tropical rainmakers can make seasonal rainfall expectations challenging to synthesise. |
