Overview
Weak La Niña conditions persisted in the tropical Pacific during December 2017. Below average sea surface temperatures (SSTs) are present across the central and eastern Equatorial Pacific Ocean, and have cooled further compared to November 2017, with the strongest anomalies currently measured off the coast of Ecuador and Peru. Subsurface temperature anomalies are also consistent with weak La Niña conditions, however atmospheric signals have become less consistent over the course of December 2017: the enhanced trade winds that were present in the western Pacific Ocean earlier on have weakened, and in December 2017 the Southern Oscillation Index (SOI) weakened and is currently in the neutral range.
The consensus from international models is that weak La Niña conditions are likely (72% chance) to continue over the next 3 months (January – March 2018). Thereafter, the models agree, that La Niña will decay rapidly and a return to ENSO-neutral conditions is most likely (74% chance) over the April – June 2018 period.
Aside from these weak La Niña conditions, New Zealand’s regional climate over the next three month period is anticipated to be dominated by the very warm ocean waters present around the country and in the Tasman sea, which will influence surface air temperatures and the likelihood of significant rainfall events.
For January – March 2018, the atmospheric circulation around New Zealand is forecast to be characterized by higher pressures than normal east and south of the country, while lower pressure than normal is forecast over the Tasman Sea area, extending over the country. This pressure pattern is expected to be associated with unsettled conditions with periods of north-easterly quarter flow anomalies.
For the current tropical cyclone season (November 2017 to April 2018), NIWA's Southwest Pacific Tropical Cyclone Outlook indicates that the risk for New Zealand is normal or above normal. On average, at least one ex-tropical cyclone passes within 550km of New Zealand each year. If an ex-tropical cyclone comes close to the country, it has equal probability of passing east or west of Auckland and the North Island. Significant rainfall, damaging winds and coastal damage can occur leading up to and during these events.
Outlook Summary
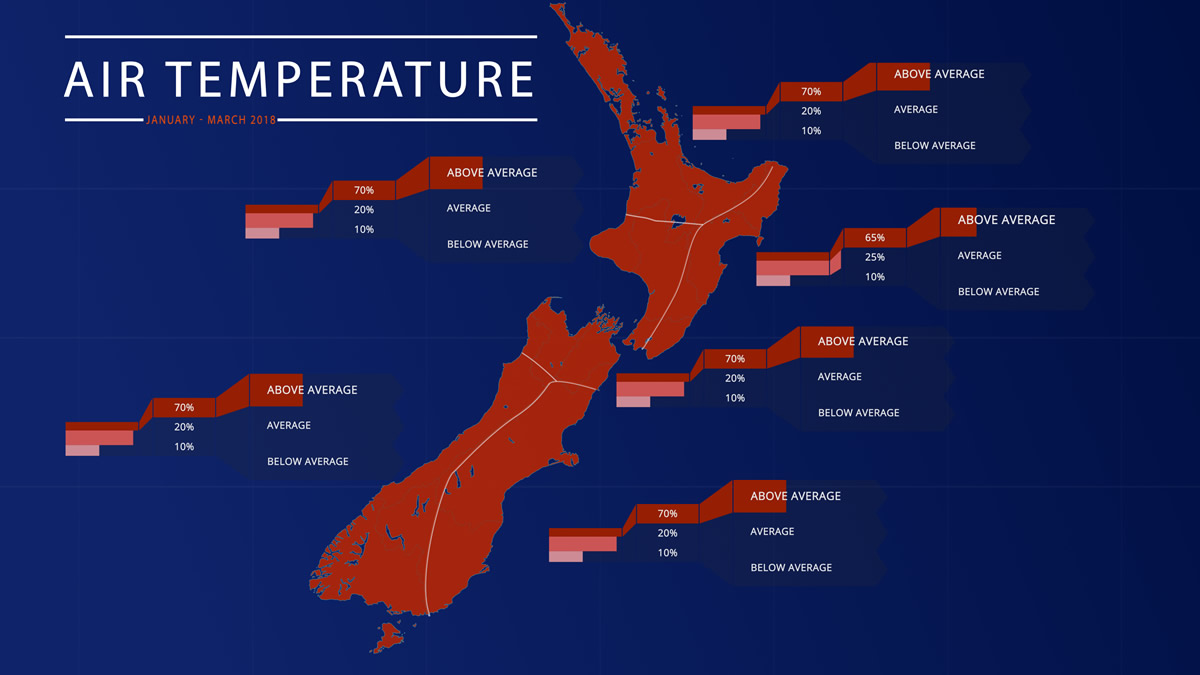
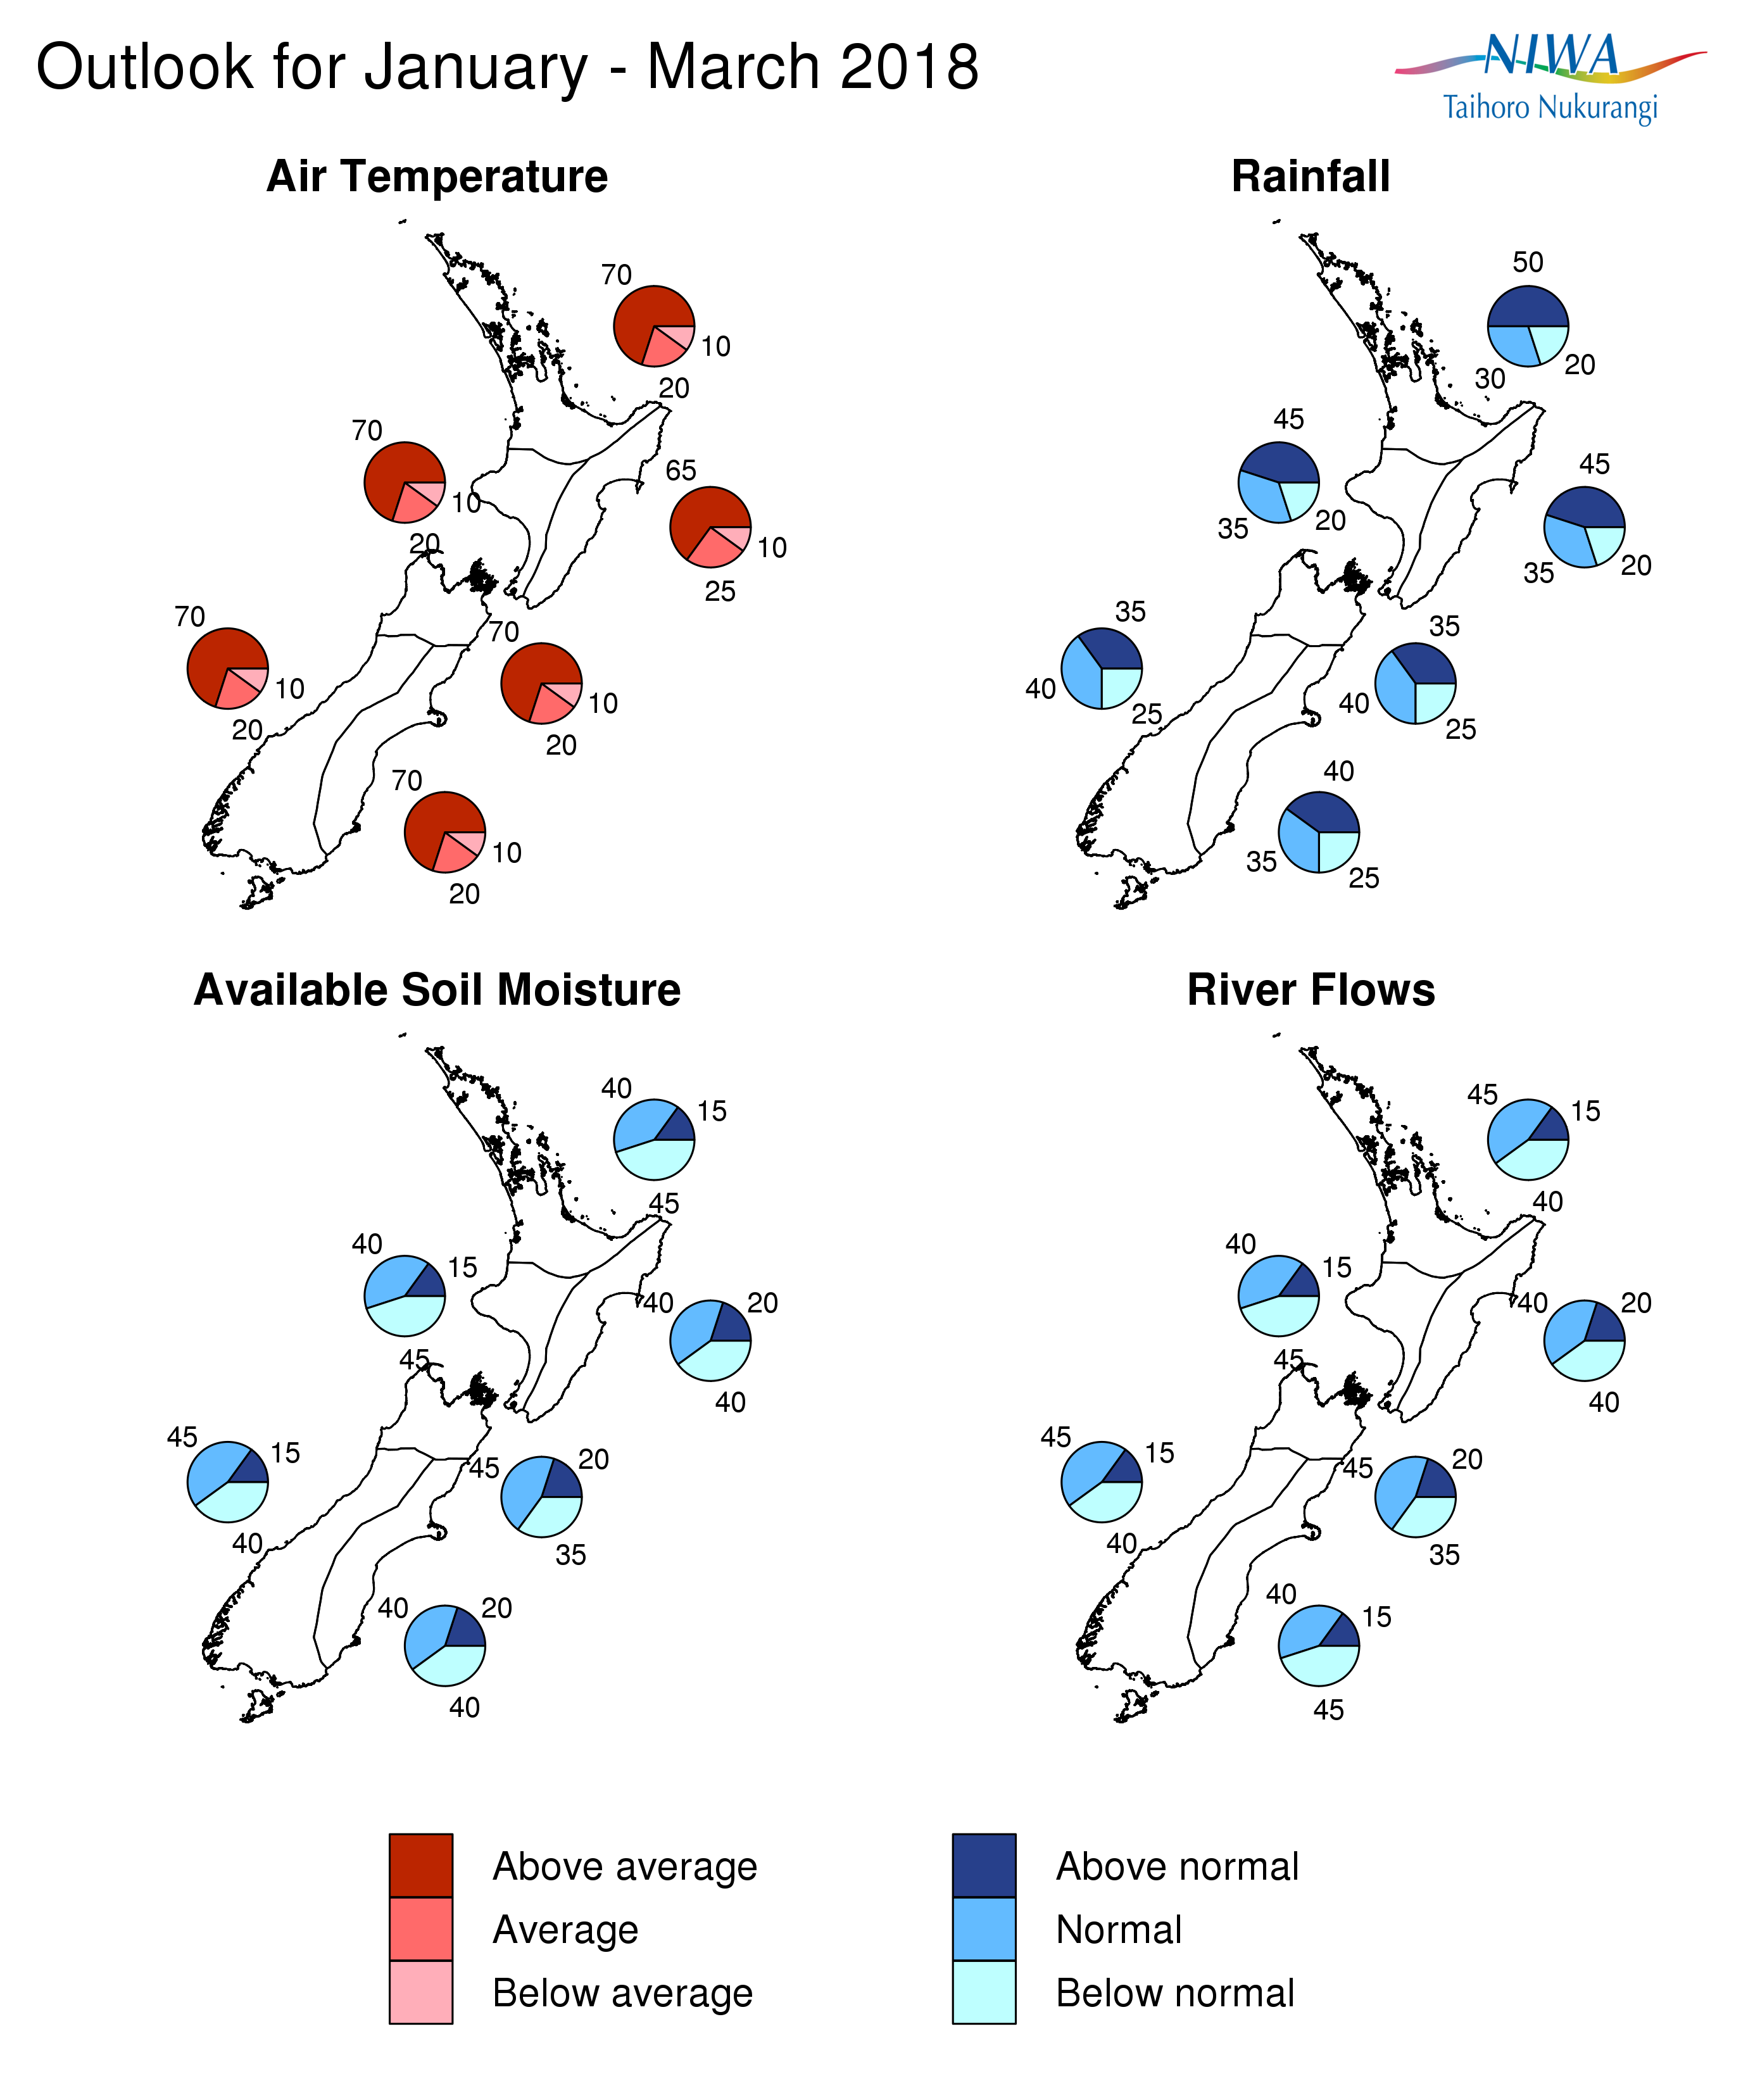
January – March 2018 temperatures are forecast to be above average, with high confidence (65% to 70% chance) for all regions of New Zealand. Coastal water temperatures around New Zealand and further offshore in the Tasman Sea are forecast to remain above average over the next three-month period.
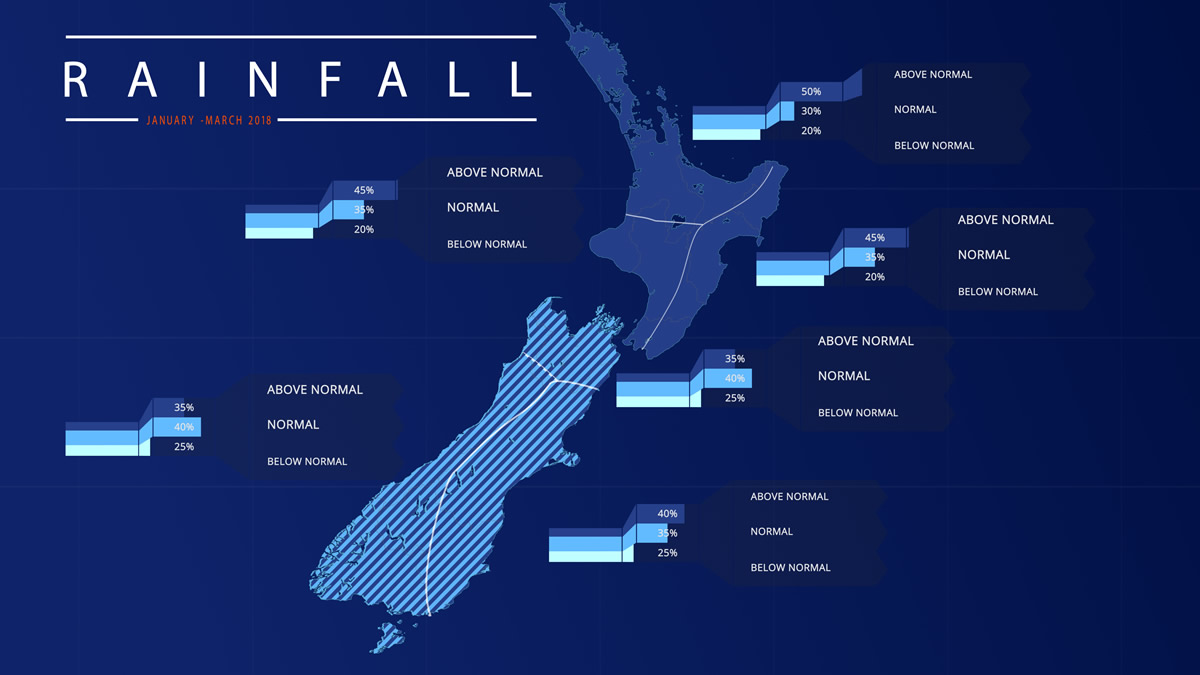
For January – March 2018 rainfall totals are most likely (45 to 50% chance) to be in the above normal range in the North Island and about equally likely to be near normal (35 to 40% chance) or above normal (35 to 40% chance) in the South Island.
January – March 2018 soil moisture levels and river flows are most likely (45% chance) to be near normal in the north of the South Island. For all remaining regions of the country, soil moisture levels and river flows are about equally likely to be in the below normal (35 to 45% chance) or near normal range (40 to 45% chance).
Regional predictions for the January – March 2018 season
Northland, Auckland, Waikato, Bay of Plenty
The table below shows the probabilities (or percent chances) for each of three categories: above average, near average, and below average. In the absence of any forecast guidance there would be an equal likelihood (33% chance) of the outcome being in any one of the three categories. Forecast information from local and global guidance models is used to indicate the deviation from equal chance expected for the coming three-month period, with the following outcomes the most likely (but not certain) for this region:
- Temperatures are very likely to be above average (70% chance).
- Rainfall totals are most likely to be in the above normal range (50% chance).
- Soil moisture levels and river flows are about equally likely to be in the near normal range (40-45% chance) or below normal range (40-45% chance) .
The full probability breakdown is:
|
Temperature |
Rainfall |
Soil moisture |
River flows |
|
|
Above average |
70 |
50 |
15 |
15 |
|
Near average |
20 |
30 |
40 |
45 |
|
Below average |
10 |
20 |
45 |
40 |
Central North Island, Taranaki, Whanganui, Manawatu, Wellington
Probabilities are assigned in three categories: above average, near average, and below average.
- Temperatures are very likely to be above average (70% chance).
- Rainfall totals are most likely to be above normal (45% chance).
- Soil moisture levels and river flows are about equally likely to be in the below normal range (45% chance) or near normal range (40% chance).
The full probability breakdown is:
|
Temperature |
Rainfall |
Soil moisture |
River flows |
|
|
Above average |
70 |
45 |
15 |
15 |
|
Near average |
20 |
35 |
40 |
40 |
|
Below average |
10 |
20 |
45 |
45 |
Gisborne, Hawke’s Bay, Wairarapa
Probabilities are assigned in three categories: above average, near average, and below average.
- Temperatures are very likely to be above average (65% chance).
- Rainfall totals are most likely to above normal (45% chance).
- Soil moisture levels and river flows are equally likely to be in the near normal range (40% chance) or below normal range (40% chance).
The full probability breakdown is:
|
Temperature |
Rainfall |
Soil moisture |
River flows |
|
|
Above average |
65 |
45 |
20 |
20 |
|
Near average |
25 |
35 |
40 |
40 |
|
Below average |
10 |
20 |
40 |
40 |
Tasman, Nelson, Marlborough, Buller
Probabilities are assigned in three categories: above average, near average, and below average.
- Temperatures are very likely to be above average (70% chance).
- Rainfall totals are about equally likely to be near normal (40% chance) or above normal (35% chance).
- Soil moisture levels and river flows are most likely to be in the near normal range (45% chance).
The full probability breakdown is:
|
Temperature |
Rainfall |
Soil moisture |
River flows |
|
|
Above average |
70 |
35 |
20 |
20 |
|
Near average |
20 |
40 |
45 |
45 |
|
Below average |
10 |
25 |
35 |
35 |
West Coast, Alps and foothills, inland Otago, Southland
Probabilities are assigned in three categories: above average, near average, and below average.
- Temperatures are very likely to be above average (70% chance).
- Rainfall totals are about equally likely to be near normal (40% chance) or above normal (35% chance).
- Soil moisture levels and river flows are about equally likely to be in the near normal range (45% chance) or below normal range (40% chance).
The full probability breakdown is:
|
Temperature |
Rainfall |
Soil moisture |
River flows |
|
|
Above average |
70 |
35 |
15 |
15 |
|
Near average |
20 |
40 |
45 |
45 |
|
Below average |
10 |
25 |
40 |
40 |
Coastal Canterbury, east Otago
Probabilities are assigned in three categories: above average, near average, and below average.
- Temperatures are very likely to be above average (70% chance).
- Rainfall totals are about equally likely to be in the above normal range (40% chance) or near normal range (35% chance).
- Soil moisture levels are equally likely to be near normal (40% chance) or below normal (40% chance).
- River flows are about equally likely to be in the below normal range (45% chance) or near normal range (40% chance).
The full probability breakdown is:
|
Temperature |
Rainfall |
Soil moisture |
River flows |
|
|
Above average |
70 |
40 |
20 |
15 |
|
Near average |
20 |
35 |
40 |
40 |
|
Below average |
10 |
25 |
40 |
45 |
Graphical representation of the regional probabilities
Background
Weak La Niña conditions persisted in the tropical Pacific during December 2017. Sea surface temperatures (SSTs) in the central and eastern equatorial Pacific Ocean have continued to cool during December 2017. Below average SSTs are present across the central and eastern equatorial Pacific, with the maximum anomalies found in the far eastern Pacific off the coasts of Ecuador and Peru. The NINO3.4 index is negative at -0.7oC (and therefore in the La Niña category), the NINO3 index is at -0.9 oC and the NINO4 index is only very weakly negative (-0.2 oC for the month of December 2017 as a whole). The NINO1 index (near the coast of Peru) is currently the most negative with a value below -1.0 oC for December 2017.
Cooler than normal subsurface ocean waters (within the first 150 meters of the ocean) in the central and eastern equatorial Pacific (east of about 150°W) have persisted during the month of December 2017, with anomalies locally reaching below -2.0 oC. The positive subsurface temperature anomalies present in the western Pacific Ocean (west of ~ 150oW and at about 150m deep) have intensified and expanded significantly, and now exceed +3.0oC about the International Dateline. The upper ocean (first 300 meters) heat content anomalies remain negative east of about 160oW, and consistently with the increased subsurface temperature anomalies in the western Equatorial Pacific – intensified between the International Dateline and ~ 160oE.
While the ocean (surface and subsurface) signals are fully consistent with a weak La Niña state, some atmospheric patterns have become less consistent during December 2017: The Southern Oscillation Index (SOI) weakened rapidly during the course of the month and is now in the neutral range (-0.2 for December 2017 as a whole). Similarly, the negative zonal wind anomalies that were present in November in the western Pacific Ocean, signalling enhanced trade wind circulation, have weakened significantly.
On the other hand rainfall and convection anomalies are generally consistent with La Niña conditions in the central and eastern Pacific, where reduced convection and rainfall is present along the Equator. The ENSO Precipitation Index (ESPI) remains negative (i.e. indicative of La Niña) in December 2017, with a value of -1.1 (last 30 days to the 2nd of January 2018).
In summary, weak La Niña conditions are currently present in the Pacific Ocean, despite weakened atmospheric signals during the course of last month (December 2017). The international consensus is that La Niña conditions are likely (72% chance) to persist over the next 3 month period (January – March 2018). The models agree however that La Niña is likely to decay rapidly during the following three month period, and a return to ENSO-neutral conditions is most likely (74% chance) over the April – June 2018 period.
Coastal waters remain much warmer than average all around New Zealand and in the Tasman Sea, with anomalies currently exceeding +1.5oC for all coastal areas around the country. According to the dynamical models’ forecasts, this “Marine Heat Wave” is likely to persist for at least part of the next 3 months (January – March 2018), although the anomalies are expected to ease off slightly over the same period.
Contact
Chris Brandolino, Principal Scientist – Forecasting, NIWA National Climate Centre
Tel (09) 375 6335, Mobile (027) 886 0014
Dr Brett Mullan, Principal Scientist, NIWA National Climate Centre
Tel (04) 386 0508, Mobile (027) 294 1169
Notes to reporters and editors
- NIWA’s outlooks indicate the likelihood of climate conditions being at, above, or below average for the season as a whole. They are not ‘weather forecasts’. It is not possible to forecast precise weather conditions three months ahead of time.
- The outlooks are the result of the expert judgment of NIWA’s climate scientists. They take into account observations of atmospheric and ocean conditions and output from global and local climate models. The presence of El Niño or La Niña conditions and the sea surface temperatures around New Zealand can be a useful indicator of likely overall climate conditions for a season.
- The outlooks state the probability for above average conditions, near average conditions, and below average conditions for rainfall, temperature, soil moisture, and river flows. For example, for winter (June–July–August) 2007, for all the North Island, we assigned the following probabilities for temperature: · Above average: 60 per cent · Near average: 30 per cent · Below average: 10 per cent We therefore concluded that above average temperatures were very likely.
- This three-way probability means that a random choice would be correct only 33 per cent (or one-third) of the time. It would be like randomly throwing a dart at a board divided into three equal parts, or throwing a dice with three numbers on it. An analogy with coin tossing (a two-way probability) is not correct.
- A 50 per cent ‘hit rate’ is substantially better than guesswork, and comparable with the skill level of the best overseas climate outlooks. See, for example, analysis of global outlooks issued by the International Research Institute for Climate and Society based in the US published in the Bulletin of the American Meteorological Society (Goddard, L., A. G. Barnston, and S. J. Mason, 2003: Evaluation of the IRI’s “net assessment” seasonal climate forecasts 1997–2001. Bull. Amer. Meteor. Soc., 84, 1761–1781).
- Each month, NIWA publishes an analysis of how well its outlooks perform. This is available online and is sent to about 3500 recipients of NIWA’s newsletters, including many farmers.
- All outlooks are for the three months as a whole. There will inevitably be wet and dry days, and hot and cold days, within a season. The exact range in temperature and rainfall within each of the three categories varies with location and season. However, as a guide, the “near average” or middle category for the temperature predictions includes deviations up to ±0.5°C for the long-term mean, whereas for rainfall the “near normal” category lies between approximately 80 per cent and 115 per cent of the long-term mean.
- The seasonal climate outlooks are an output of a scientific research programme, supplemented by NIWA’s Capability Funding. NIWA does not have a government contract to produce these outlooks.
- Where probabilities are within 5% of one another, the term “about equally” is used.