Outlook summary
- ENSO neutral conditions continued during December 2019. Both the Southern Oscillation Index (SOI) and sea surface temperatures (SSTs) remained on the El Niño side of neutral but weakened compared to previous months.
- Oceanic ENSO neutral will most likely persist (53% chance) over the next three months.
- The Indian Ocean Dipole (IOD) has weakened further compared to the peak reached in October 2019 and is expected to dissipate in January 2020.
- The Southern Annular Mode (SAM) is also expected to return closer to a neutral state after having been persistently negative in November – December.
- The weakening of these climate modes and the forecast for ENSO to remain neutral over the next three months indicate the absence of strong, persistent climate drivers for New Zealand.
- January – March 2020 air pressure is forecast to be lower than normal to the west and south of New Zealand with higher than normal air pressure north of the country. This is expected to be associated with a westerly to south-westerly air flow anomaly on average, but the dissipation of the above-mentioned climate drivers suggests that westerlies might become less robust and even give way to periodic northeasterly winds, particularly during February.
- Temperatures are expected to be near or above average in the North Island, and near or below average for the west of the South Island. The north and east of the South Island are expected to have near average temperatures for the January – March 2020 period.
- For January – March 2020 period, rainfall is projected to be near or below normal for the north of the North Island and above normal to normal for the west of the South Island. Near normal rainfall is expected elsewhere.
- The tropics to the north of New Zealand are expected to become more active during the next several weeks. For the current tropical cyclone season (November 2019 to April 2020), NIWA has indicated that the risk for New Zealand is near normal. On average, one ex-tropical cyclone passes near the country each year. Significant rainfall, damaging winds, and coastal damage can occur during these events.
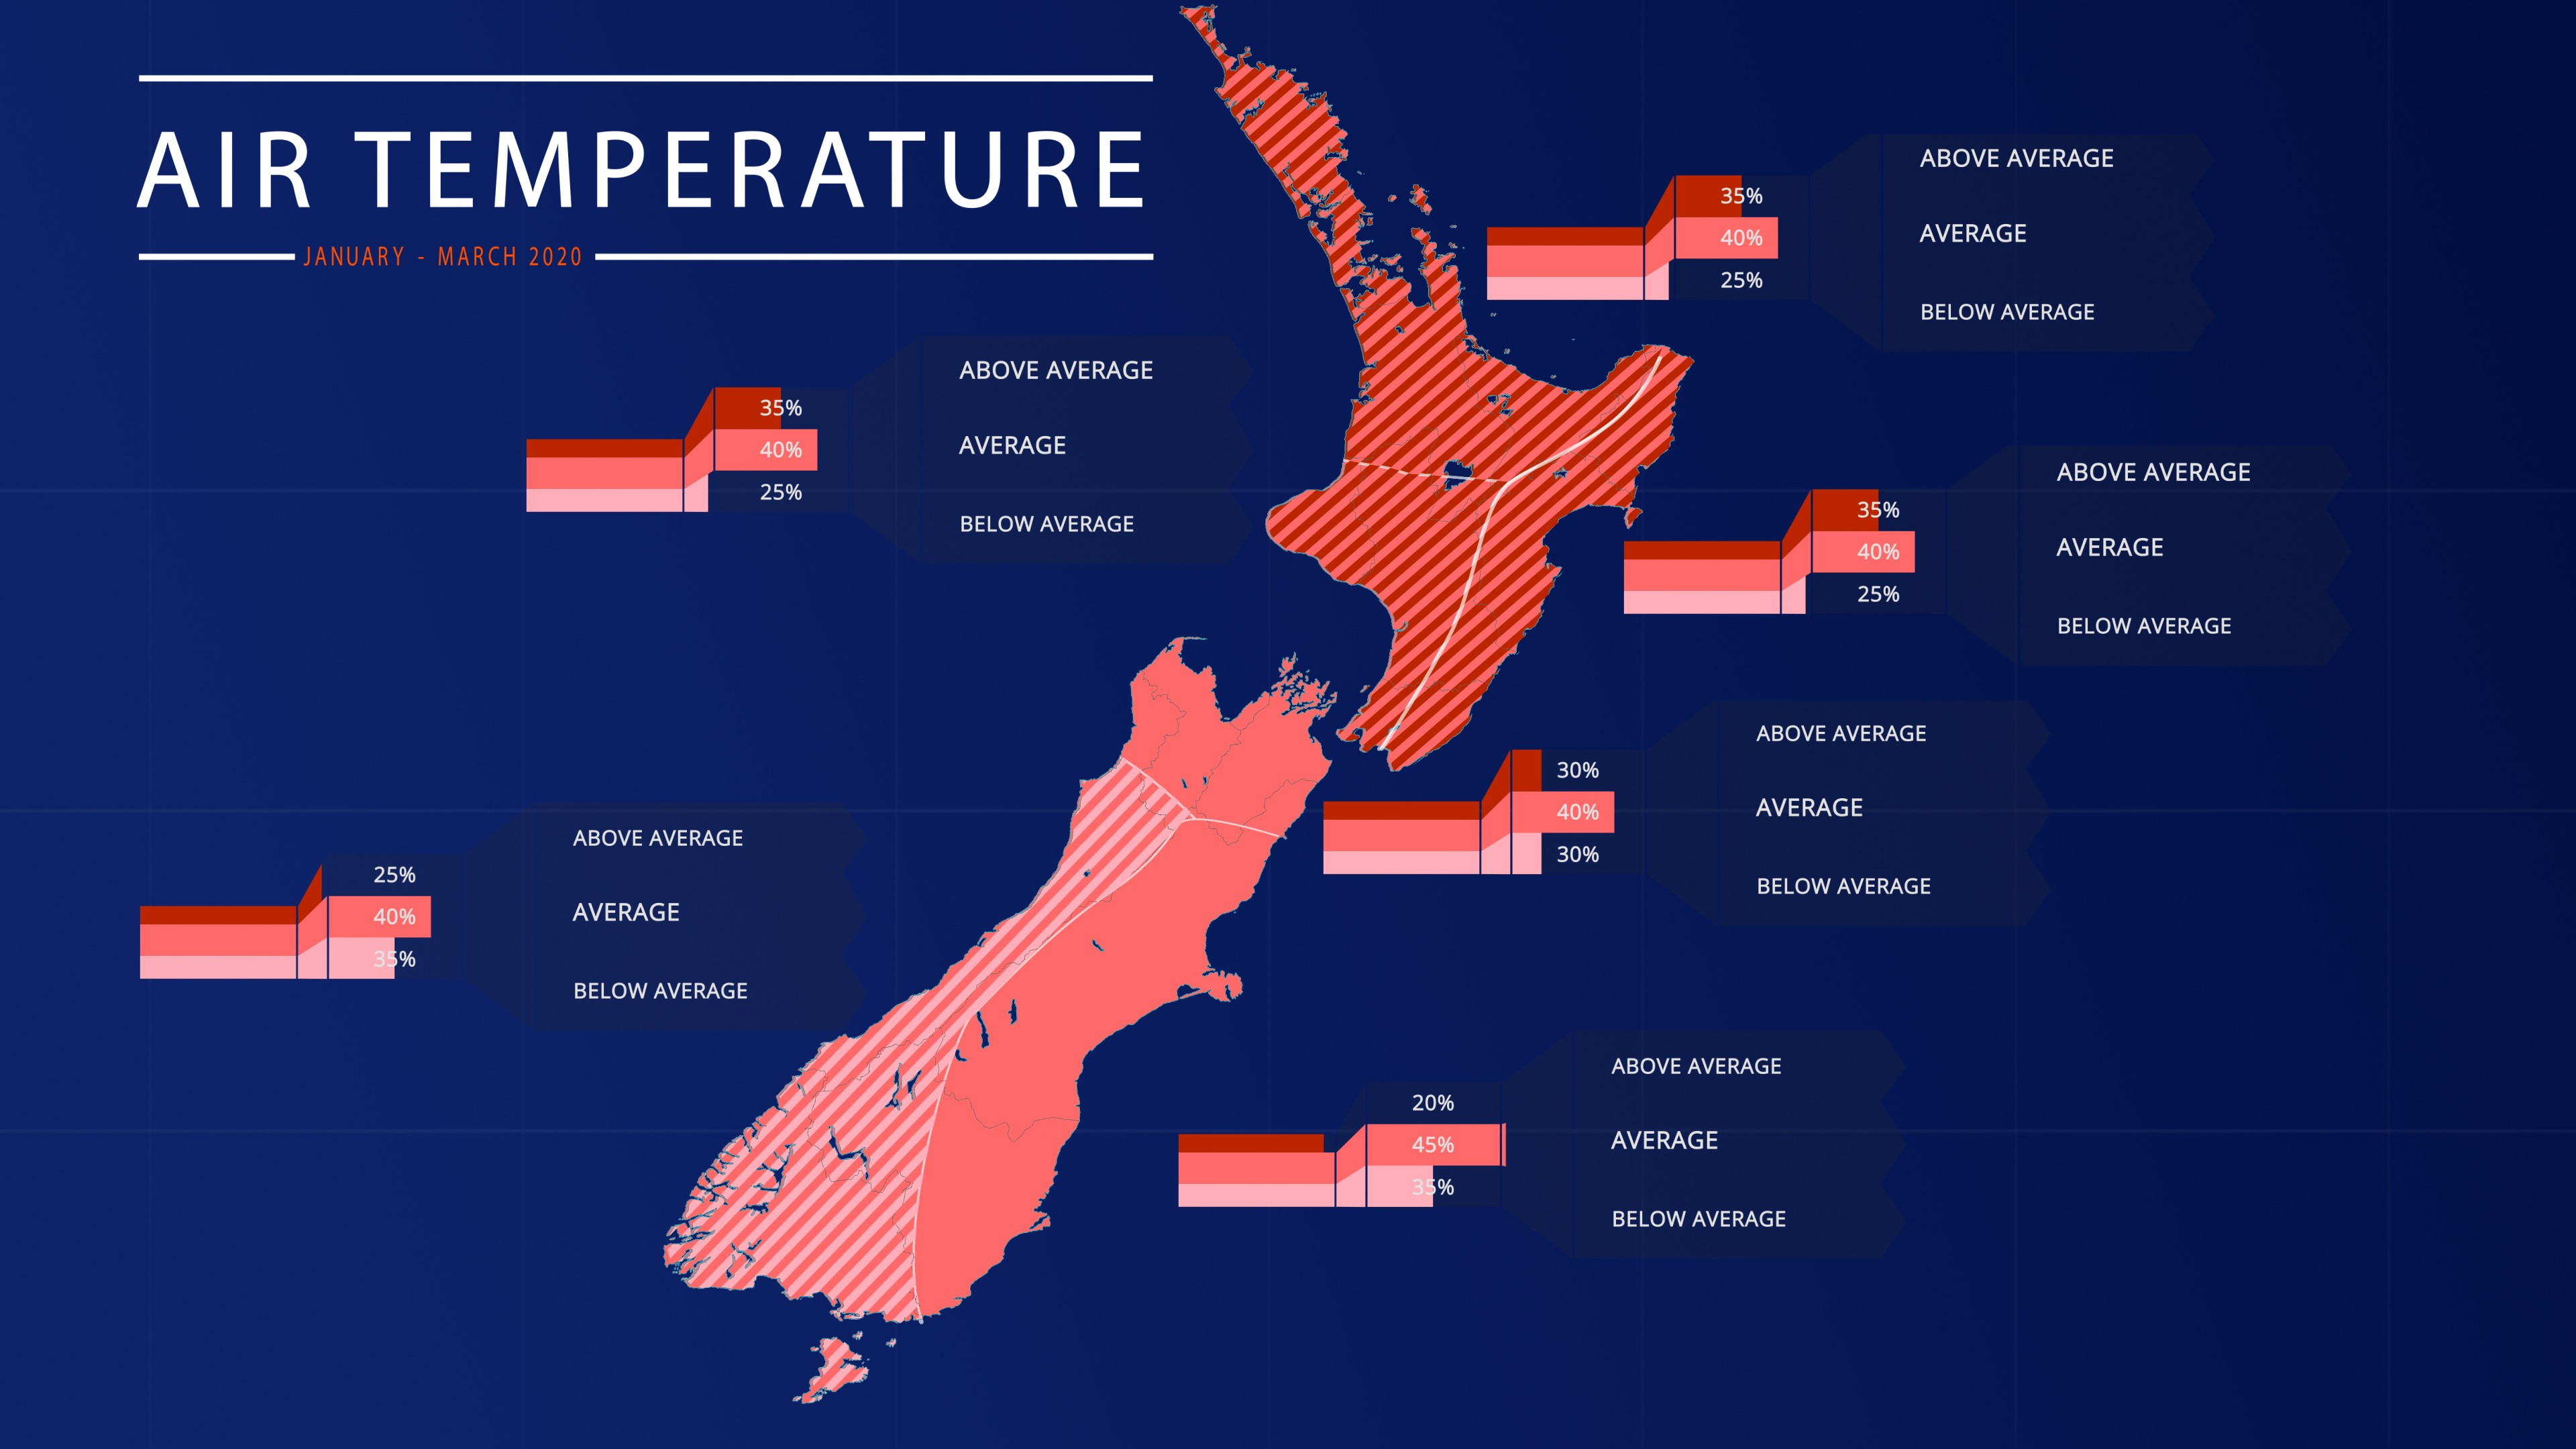
January – March 2020 temperatures have about equal chances of being near average (40% chance) or above average (35% chance) for all regions of the North Island. In the west of the South Island, temperatures have about equal chances to be near normal (40% chance) or below normal (35% chance). The north and east of the South Island will most likely experience near average temperatures (40-45% chance).
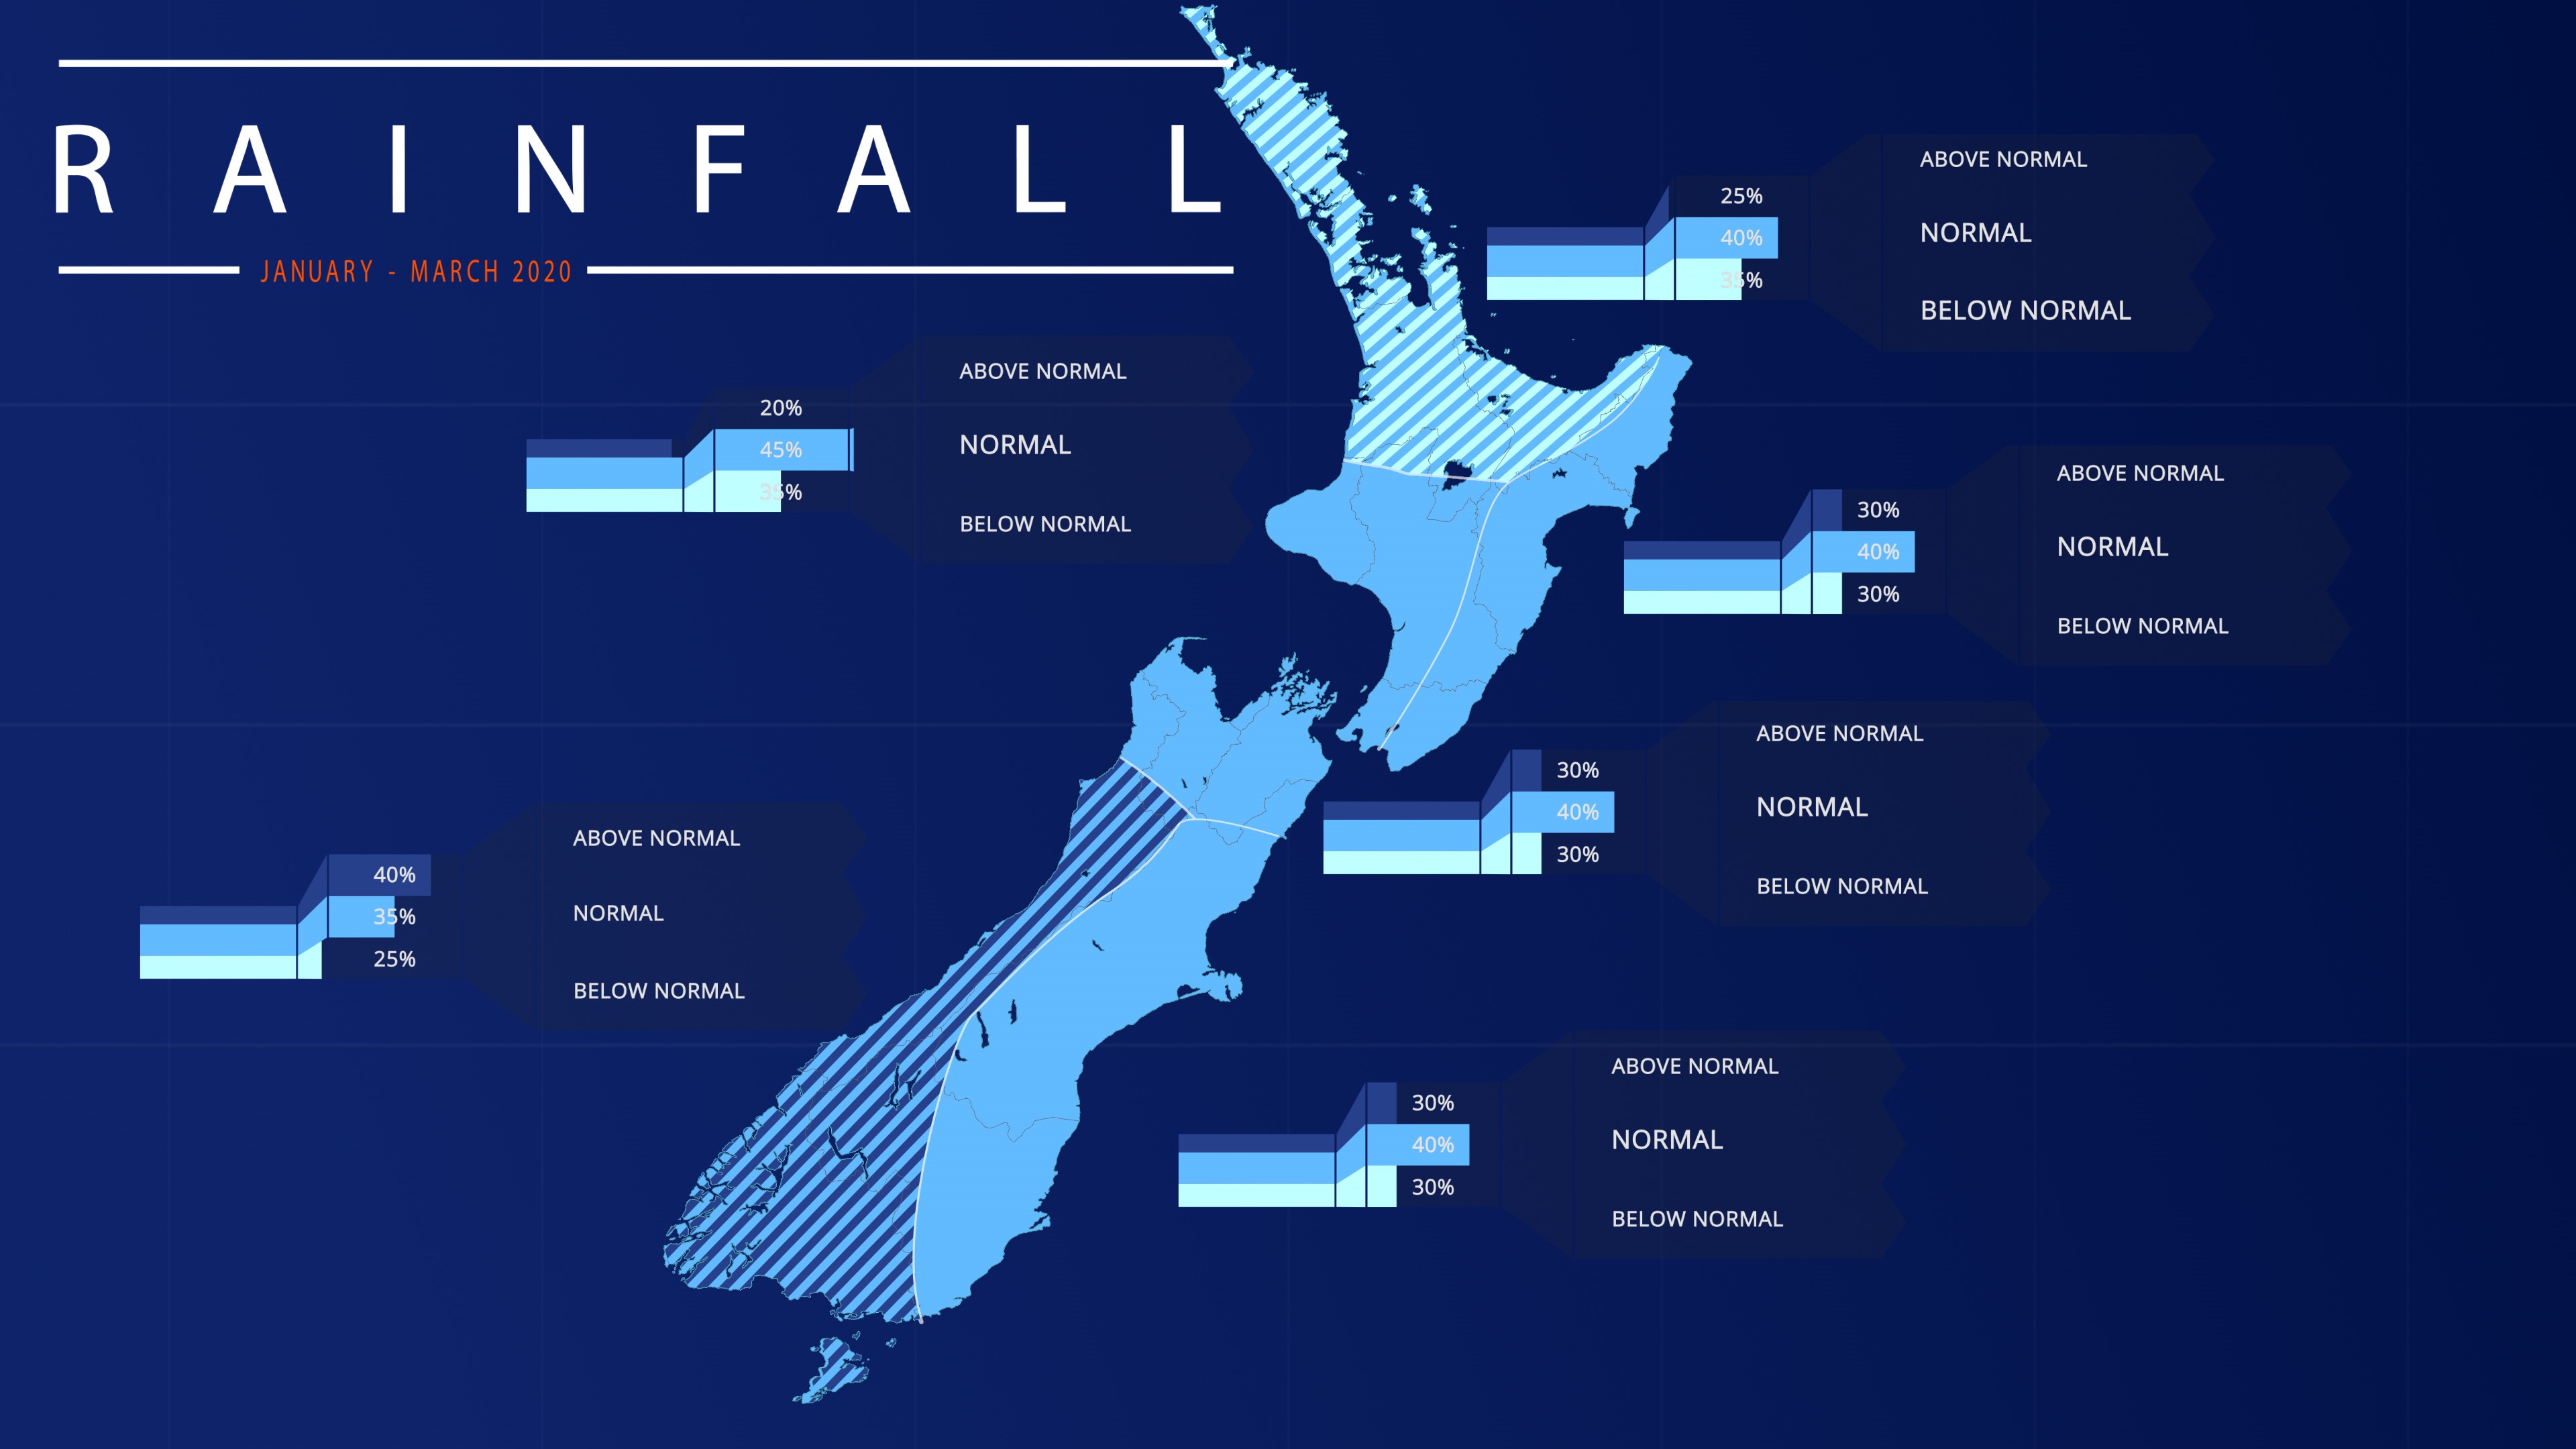
January – March 2020 period rainfall is about equally likely to be near normal (40% chance) or below normal (35% chance) for the north of the North Island and about equally likely to be above normal (40% chance) or near normal (35% chance) in the west of the South Island. Near normal rainfall is most likely for the rest of the country.
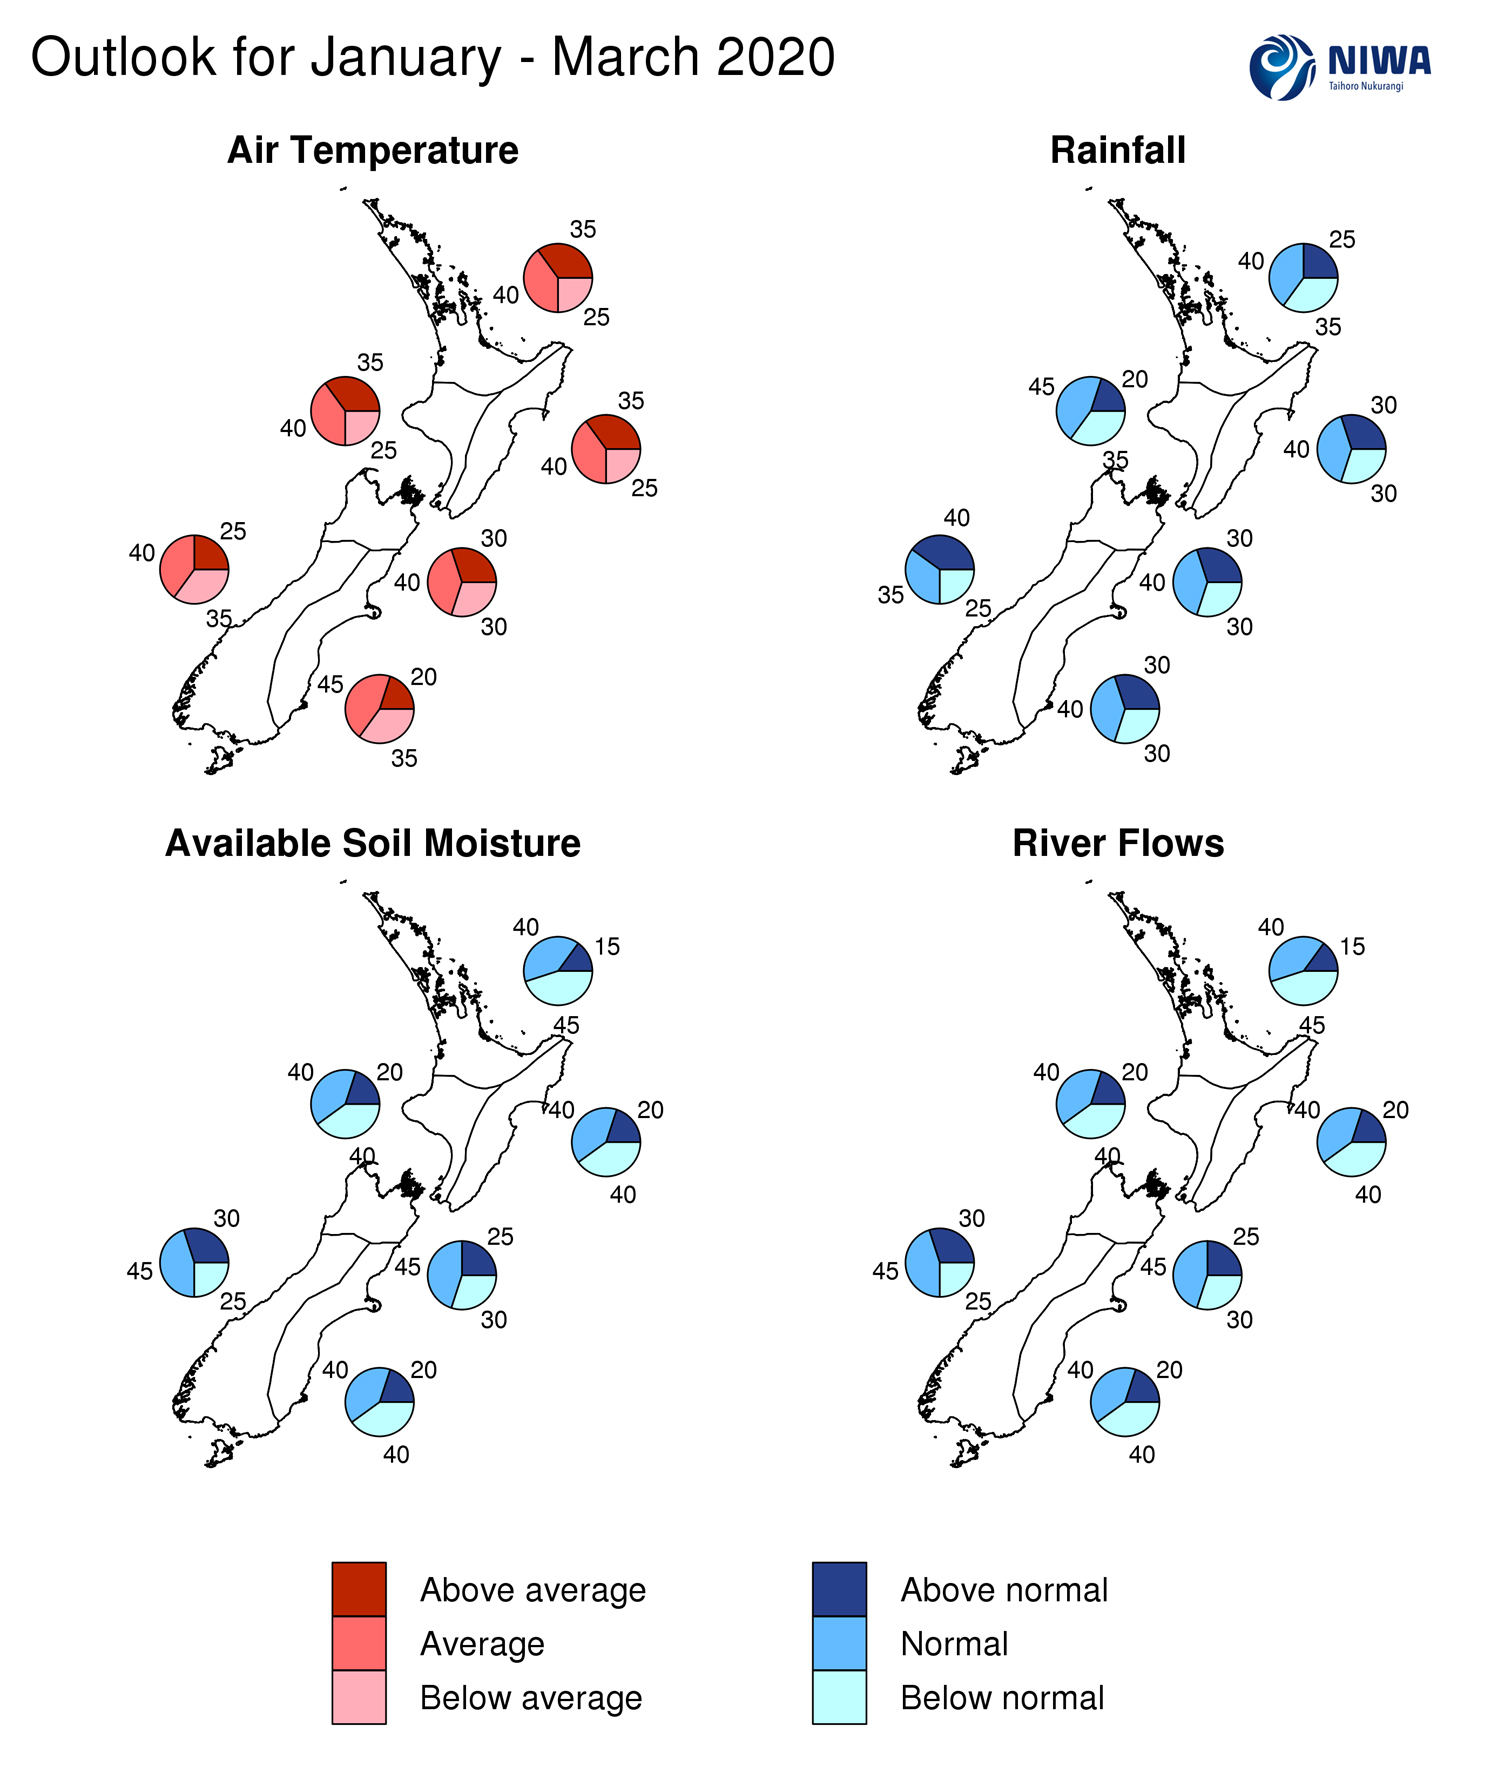
January – March 2020 period soil moisture levels and river flows are about equally likely to be below normal (40-45% chance) or near normal (40% chance) in the North Island and the east of the South Island. Near normal soil moisture levels and river flows are likely (40-45% chance) for the west and north of the South Island.
Regional predictions for the January – March 2020 season
Northland, Auckland, Waikato, Bay of Plenty
The table below shows the probabilities (or percent chances) for each of three categories: above average, near average, and below average. In the absence of any forecast guidance there would be an equal likelihood (33% chance) of the outcome being in any one of the three categories. Forecast information from local and global guidance models is used to indicate the deviation from equal chance expected for the coming three-month period, with the following outcomes the most likely (but not certain) for this region:
- Temperatures are about equally likely to be near average (40% chance) or above average (35% chance).
- Rainfall totals are about equally likely to be near normal (40% chance) or below normal (35% chance).
- Soil moisture levels and river flows are about equally likely to be below normal (45% chance) or near normal (40% chance).
The full probability breakdown is:
|
Temperature |
Rainfall |
Soil moisture |
River flows |
|
|
Above average |
35 |
25 |
15 |
15 |
|
Near average |
40 |
40 |
40 |
40 |
|
Below average |
25 |
35 |
45 |
45 |
Central North Island, Taranaki, Whanganui, Manawatu, Wellington
Probabilities are assigned in three categories: above average, near average, and below average.
- Temperatures are about equally likely to be near average (40% chance) or above average (35% chance).
- Rainfall totals are most likely to be near normal (45% chance).
- Soil moisture levels and river flows are equally likely to be below normal (40% chance) or near normal (40% chance).
The full probability breakdown is:
|
Temperature |
Rainfall |
Soil moisture |
River flows |
|
|
Above average |
35 |
20 |
20 |
20 |
|
Near average |
40 |
45 |
40 |
40 |
|
Below average |
25 |
35 |
40 |
40 |
Gisborne, Hawke’s Bay, Wairarapa
Probabilities are assigned in three categories: above average, near average, and below average.
- Temperatures are about equally likely to be near average (40% chance) or above average (35% chance)
- Rainfall totals are most likely to be near normal (40% chance).
- Soil moisture levels and river flows are equally likely to be below normal (40% chance) or near normal (40% chance).
The full probability breakdown is:
|
Temperature |
Rainfall |
Soil moisture |
River flows |
|
|
Above average |
35 |
30 |
20 |
20 |
|
Near average |
40 |
40 |
40 |
40 |
|
Below average |
25 |
30 |
40 |
40 |
Tasman, Nelson, Marlborough, Buller
Probabilities are assigned in three categories: above average, near average, and below average.
- Temperatures are most likely to be near average (40% chance).
- Rainfall totals are most likely to be near normal (40% chance).
- Soil moisture levels and river flows are most likely to be near normal (45% chance).
The full probability breakdown is:
|
Temperature |
Rainfall |
Soil moisture |
River flows |
|
|
Above average |
30 |
30 |
25 |
25 |
|
Near average |
40 |
40 |
45 |
45 |
|
Below average |
30 |
30 |
30 |
30 |
West Coast, Alps and foothills, inland Otago, Southland
Probabilities are assigned in three categories: above average, near average, and below average.
- Temperatures are about equally likely to be near average (40% chance) or below average (35% chance).
- Rainfall totals are about equally likely to be above normal (40% chance) or near normal range (35% chance).
- Soil moisture levels and river flows are most likely to be near normal (45% chance).
The full probability breakdown is:
|
Temperature |
Rainfall |
Soil moisture |
River flows |
|
|
Above average |
25 |
40 |
30 |
30 |
|
Near average |
40 |
35 |
45 |
45 |
|
Below average |
35 |
25 |
25 |
25 |
Coastal Canterbury, east Otago
Probabilities are assigned in three categories: above average, near average, and below average.
- Temperatures are most likely to be near average (45% chance).
- Rainfall totals are most likely to be near normal (40% chance).
- Soil moisture levels and river flows are equally likely to be below normal (40% chance) or near normal (40% chance).
The full probability breakdown is:
|
Temperature |
Rainfall |
Soil moisture |
River flows |
|
|
Above average |
20 |
30 |
20 |
20 |
|
Near average |
45 |
40 |
40 |
40 |
|
Below average |
35 |
30 |
40 |
40 |
Graphical representation of the regional probabilities
Background
The NINO3.4 Index anomaly (in the central Pacific) for the month of December had cooled to +0.41˚C compared to +0.64˚C the month before. The warmest surface ocean waters along the equatorial Pacific are still found in the western Pacific, with the NINO4 region (west-central Pacific) posting a monthly value of +0.84˚C.
During December 2019, upper-oceanic heat content remained above average in the equatorial Pacific and has spread eastward. Anomalies exceeding + 0.5˚C are now present from 160˚E across the Dateline to ~ 140˚W. As noted previously, the ENSO status will most likely remain neutral over the next three months (January – March 2020); however, the atmosphere may respond to warmer than average SSTs in the tropical western Pacific Ocean. Rainfall was well below normal about the eastern Indian Ocean, Indonesia, and northern Australia while it was above normal across parts of the western Indian Ocean. In the tropical Pacific, rainfall was above normal just west of the International Dateline, and below normal east of it, a pattern which was El Niño Modoki-like.
Trade winds were weaker than normal in the far western Pacific, west of the international Dateline, and close to normal east of the Dateline across the Pacific to 100˚W.
According to the consensus from international models, ENSO-neutral conditions are most likely (~53% chance) for the January– March period. For the April– June 2020 period, the probability for ENSO-neutral conditions increases to 68% and then decreases to 50% for the July – September 2020 period. In summary ENSO-neutral remains the most likely outcome until the end of winter 2020.
New Zealand’s coastal water temperatures remained generally warmer than average during December 2019. The most anomalously warm waters (monthly averages for December) are off the west coast of the North Island, but localized warmer waters are also present along the southeast coast of the North Island. At the regional scale, sea surface temperatures (SSTs) east of New Zealand (around and east of the Chatham Islands) are well above average, with anomalies locally exceeding +5˚C, however these anomalies are restricted to the upper layer of the ocean and do not extend significantly with depth. These regional SSTs could have at least some influence on New Zealand’s air temperatures during the summer season, either modifying any cooler air attempting to arrive from the east or enhancing warmth around the country.
New Zealand Coastal Sea Surface Temperatures during December 2019:
|
North NI |
West NI |
East NI |
North SI |
West SI |
East SI |
|
+0.35˚C |
+1.05˚C |
+0.93C |
+0.56˚C |
+0.03˚C |
+0.56˚C |
[Derived by interpolating daily SSTs from NOAA OISSTv2 to coastal grid-points and averaging along the coastlines of the 6 forecast regions]
The Southern Annular Mode (SAM) was negative for most of the month of December, consistent with enhanced westerly winds observed during the month. The SAM is forecast to return to more neutral levels over the next two weeks, suggesting that westerlies will become less robust during the upcoming 3-month period.
The Madden Julian Oscillation was mostly inactive during December in the Pacific Ocean. In the next couple of weeks, a strong MJO pulse is forecast to intensify over the maritime continent and western Pacific (phases 4-6). Historically, these phases were associated with above average temperatures for most of New Zealand during the month of January. The typical rainfall anomalies for January include increased rainfall in the western South Island during phase 4.
The Indian Ocean Dipole (IOD) continued to weaken in December 2019. The latest weekly value from the Australian Bureau of Meteorology is +0.6˚C, compared to the peak value of +2.2C in October (which placed it amongst the strongest positive IOD events on record). The IOD signal is expected to dissipate during January 2020, a relatively late decay compared to normal. As forcing from the IOD fades, convection and rainfall may become more frequent across the Western Pacific during the coming 3-month period. This may lead to periodic La Niña-like patterns (northeasterlies for NZ) during January - March 2020.
Elsewhere, a standing wave of convection is forecast to persist over the Africa and the western Indian Ocean—one that has been responsible for persistent westerly winds in the New Zealand region over the last several months.
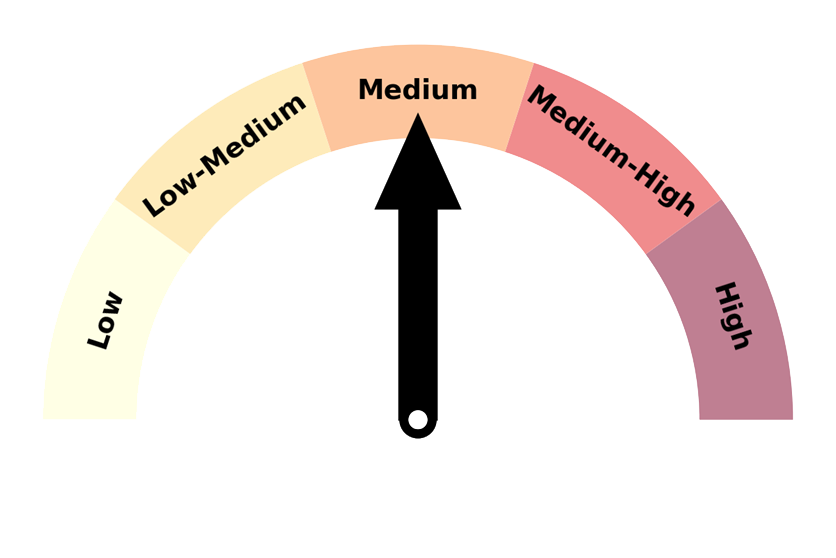
Forecast confidence
Temperature
|
Forecast confidence for temperature is medium: the expectation is for enhanced westerly to southwesterly air flows on average during January – March 2020, which is consistent with a tendency for cooler than nomal temperatures for the west of the South Island. Currently Sea Surface Temperatures in the Tasman are only marginally warmer than normal. Nonetheless, Australian air masses may cross the Tasman Sea, leading to occasional spells of heat for New Zealand. |
Rainfall
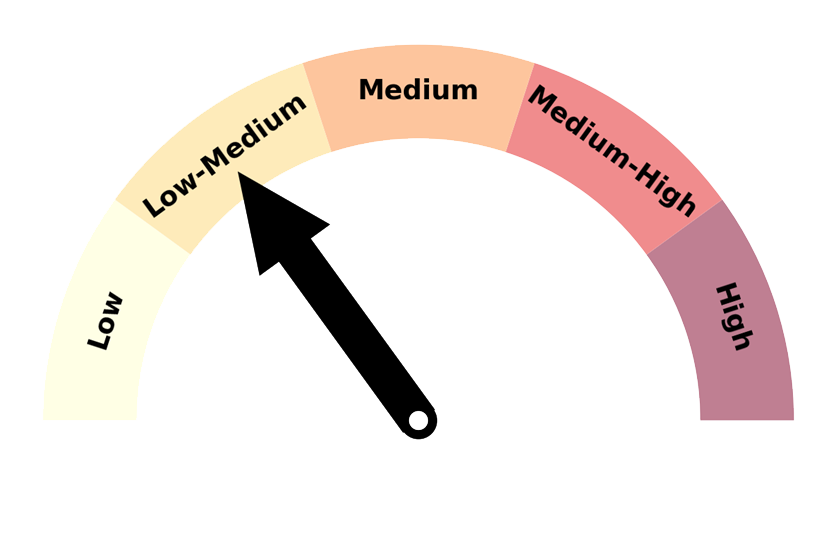
|
Forecast confidence for summer rainfall is, overall, low-medium. The positive IOD was a prominent driver in the Indo-Pacific region in the past few months but is now weakening and expected to decay during January 2020. Additionally, dynamical model guidance is inconsistent with identifying a strong ‘theme’ for most of the country besides a tendency for wetter than normal conditions in the west of the South Island. Collectively, this provides a somewhat lower than average confidence level for January – March rainfall. |
Download
Seasonal Climate Outlook for January 2020 - March 2020 [PDF450KB]
Notes to reporters and editors
- NIWA’s outlooks indicate the likelihood of climate conditions being at, above, or below average for the season as a whole. They are not ‘weather forecasts’ as it is not possible to forecast precise weather conditions three months in advance.
- The outlooks are the result of the expert judgment of NIWA’s climate scientists. They take into account observations of atmospheric and ocean conditions and output from global and local climate models. The presence of El Niño or La Niña conditions and the sea surface temperatures around New Zealand can be a useful indicator of likely overall climate conditions for a season.
- The outlooks state the probability for above average conditions, near average conditions, and below average conditions for rainfall, temperature, soil moisture, and river flows. When a particular probability reaches or exceeds 60%, we conclude it is “very likely”.
- This three-way probability means that a random choice would be correct only 33 per cent (or one-third) of the time. It would be like randomly throwing a dart at a board divided into three equal parts, or throwing a dice with three numbers on it.
- Each month, NIWA publishes an analysis of how well its outlooks perform.
- All outlooks are for the three months as a whole. There will inevitably be wet and dry days, and hot and cold days, within a season. The exact range in temperature and rainfall within each of the three categories varies with location and season. However, as a guide, the “near average” or middle category for the temperature predictions includes deviations up to ±0.5°C for the long-term mean, whereas for rainfall the “near normal” category lies between approximately 80 per cent and 119 per cent of the long-term mean.
- The seasonal climate outlooks are an output of a scientific research programme.
- Where probabilities are within 5% of one another, the term “about equally” is used.
- The forecast confidence meter for temperature and rainfall represents the expert judgement of NIWA’s climate scientists. It aims to synthesize various forecast elements, such as global and local climate drivers, in order to clearly communicate forecaster confidence.
