Outlook summary
- La Niña, which restrengthened during August, is expected to be an important climate driver for Aotearoa New Zealand during spring. See the background for more information.
- The season may feature a battleground of pressure features in the region, with occasional sub-tropical lows and strong high pressure belts. This makes seasonal rainfall predictions particularly challenging.
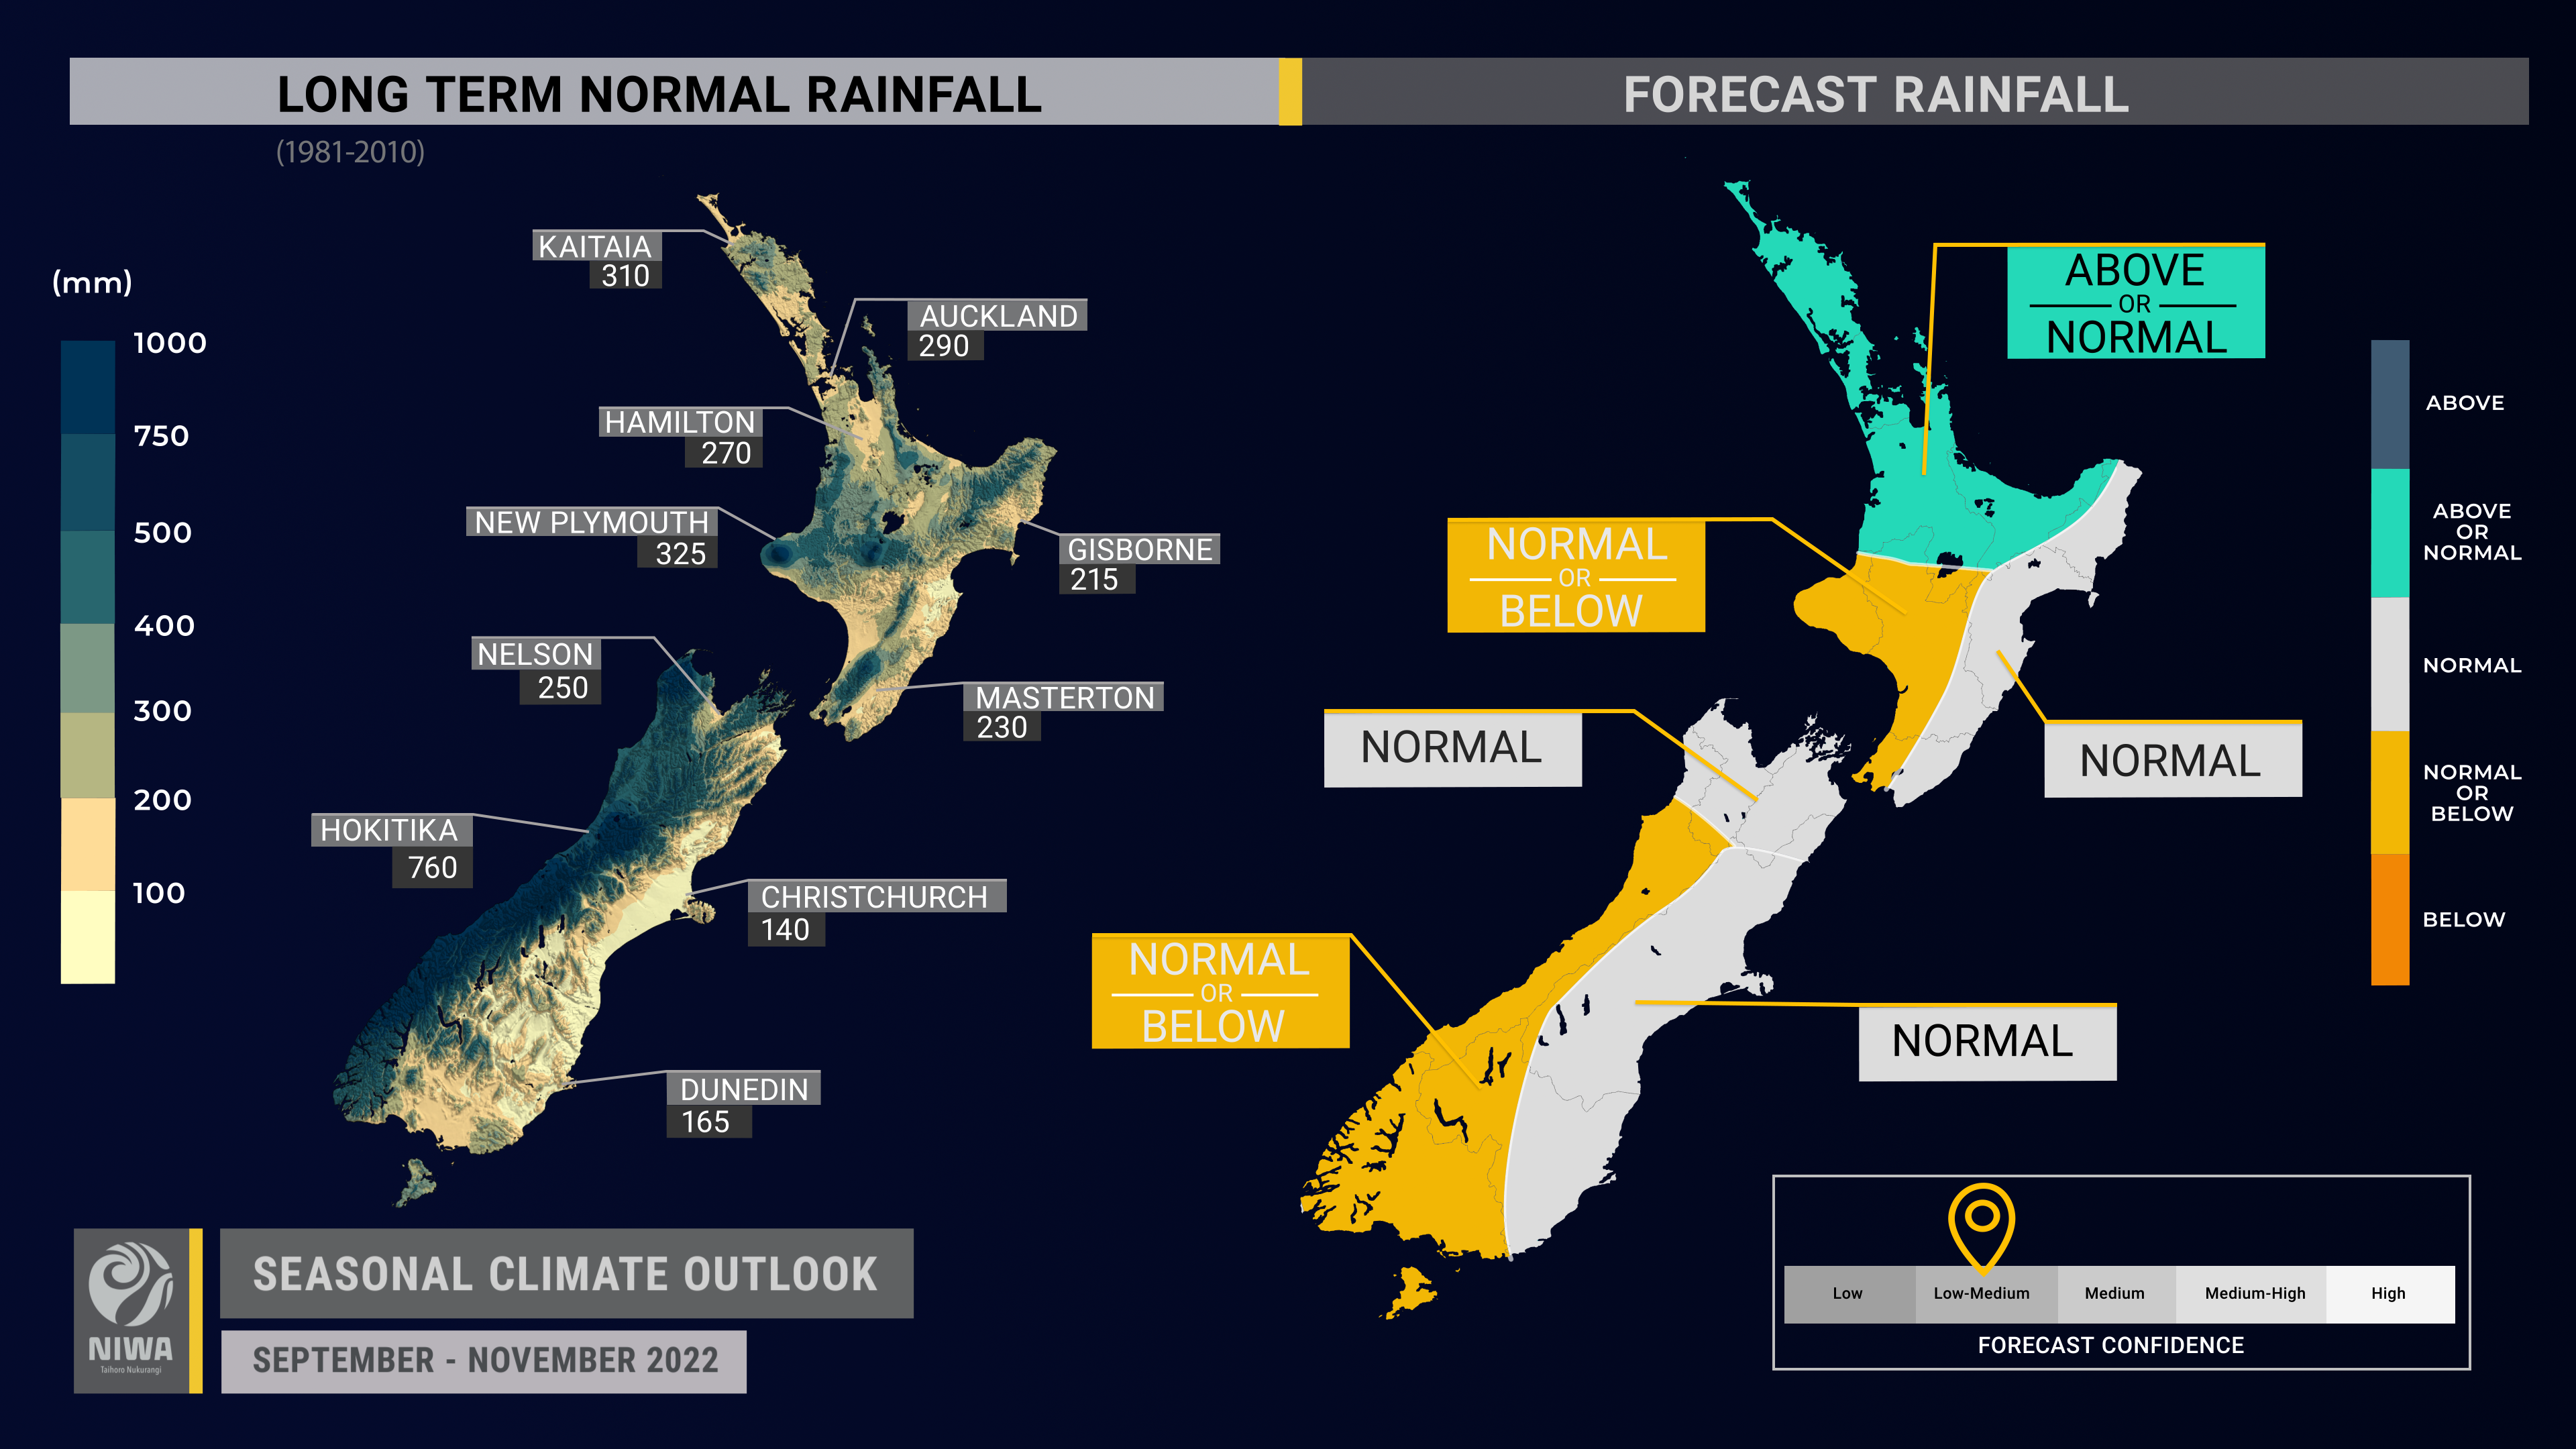
- With fewer spring westerlies likely, rainfall is about equally likely to be near normal or below normal in the west of both islands, equally likely to be near normal or above normal in the north of the North Island, and most likely to be near normal in all other regions.
- A sub-tropical low during the first week of September may elevate the risk for heavy rainfall in the northern North Island. Another sub-tropical low is possible in the third week of the month and may bring more rain, possibly heavy, to parts of the country.
- Conversely, during periods of high pressure, easterly quarter flows may dominate, contributing to long dry spells, especially about inland and western parts of both islands.
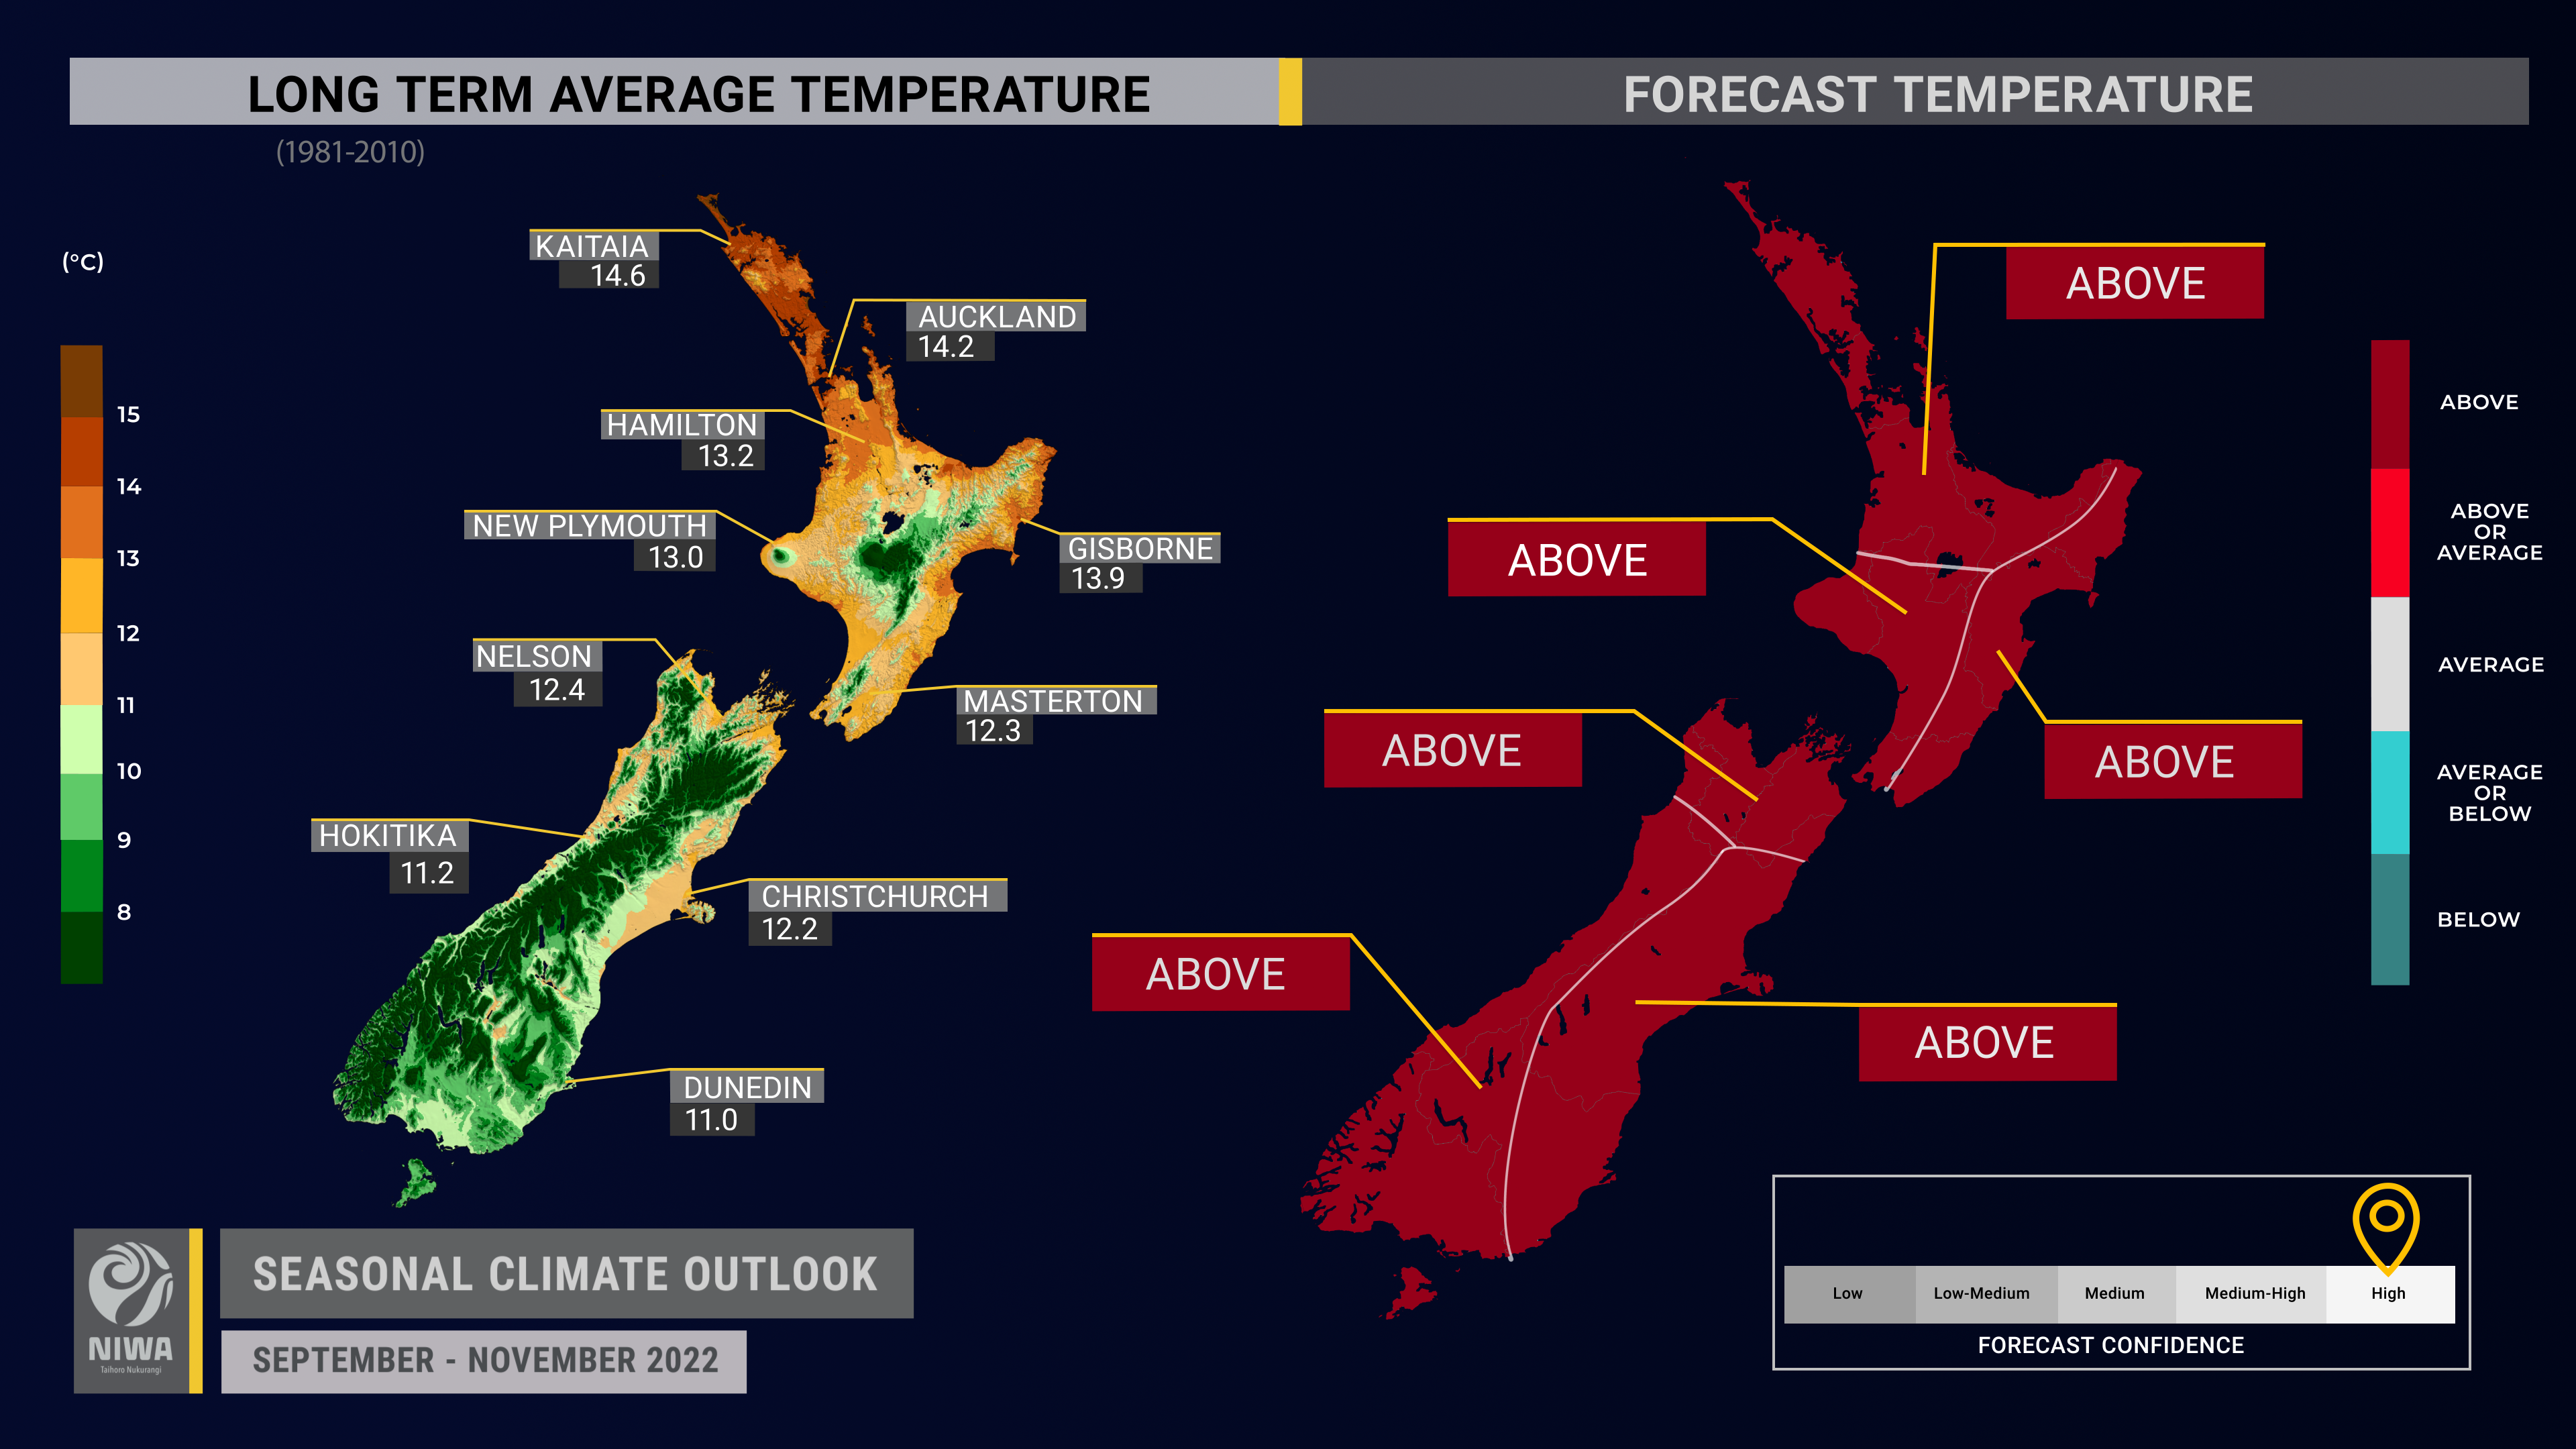
- Spring temperatures are very likely to be warmer than average in the North Island and north and west of the South Island, and most likely to be warmer than average in the east of the South Island, in spite of a short-lived cold spell in early September.
- Coastal sea surface temperatures (SSTs) ranged from 0.5˚C to 1.0˚C above average during August with marine heatwave conditions occurring offshore of many regions. Of note, many climate models show an increase in SST anomalies (difference from average) during October-November period.
- River flows across most of the country remain very high following a wet winter. The expectation over the next three months is for a return to near normal soil moisture and river flow conditions across the country.
Regional predictions for September – November 2022
Northland, Auckland, Waikato, Bay of Plenty
The table below shows the probabilities (or percent chances) for each of three categories: above average, near average, and below average. In the absence of any forecast guidance there would be an equal likelihood (33% chance) of the outcome being in any one of the three categories. Forecast information from local and global guidance models is used to indicate the deviation from equal chance expected for the coming three-month period, with the following outcomes the most likely (but not certain) for this region:
- Temperatures are very likely to be above average (70% chance). More northeasterly winds and marine heatwave conditions will result in unseasonable warmth and humidity at times.
- Rainfall totals are about equally likely to be near normal (40% chance) or above normal (35% chance). Sub-tropical low pressure systems may occasionally track toward the region, such as during the first and third week of September, increasing the risk for heavy rain.
- Conversely, more northeasterly winds could lead to dry spells, particularly in the south-west of the region, such as Waikato.
- Soil moisture levels and river flows are most likely to be near normal (45% chance).
The full probability breakdown is:
|
Temperature |
Rainfall |
Soil moisture |
River flows |
|
|
Above average |
70 |
35 |
25 |
20 |
|
Near average |
25 |
40 |
45 |
45 |
|
Below average |
05 |
25 |
30 |
35 |
Central North Island, Taranaki, Whanganui, Manawatu, Wellington
Probabilities are assigned in three categories: above average, near average, and below average.
- Temperatures are very likely to be above average (70% chance). More northeasterly winds and marine heatwave conditions may cause increased sunshine and warmer temperatures.
- Rainfall totals are about equally likely to be near normal (40% chance) or below normal (35% chance). Fewer spring westerlies may increase the risk for dry spells.
- Soil moisture levels and river flows are most likely to be near normal (45% chance).
The full probability breakdown is:
|
Temperature |
Rainfall |
Soil moisture |
River flows |
|
|
Above average |
70 |
25 |
20 |
20 |
|
Near average |
25 |
40 |
45 |
45 |
|
Below average |
05 |
35 |
35 |
35 |
Gisborne, Hawke’s Bay, Wairarapa
Probabilities are assigned in three categories: above average, near average, and below average.
- Temperatures are very likely to be above average (65% chance). More northeasterly winds may lead to higher humidity levels, more cloud cover, and warmer overnight temperatures.
- Rainfall totals are most likely to be near normal (45% chance). The potential for more frequent onshore winds during spring could lead to more wet days. Sub-tropical lows may occasionally track toward the region, increasing the risk for heavy rain, particularly in the northern part of the region, such as northern Hawke’s Bay and Gisborne.
- Soil moisture levels and river flows are most likely to be near normal (45% chance).
The full probability breakdown is:
|
Temperature |
Rainfall |
Soil moisture |
River flows |
|
|
Above average |
65 |
30 |
20 |
20 |
|
Near average |
30 |
45 |
45 |
45 |
|
Below average |
05 |
25 |
35 |
35 |
Tasman, Nelson, Marlborough, Buller
Probabilities are assigned in three categories: above average, near average, and below average.
- Temperatures are very likely to be above average (60% chance). More northeasterly winds and marine heatwave conditions will result in unseasonable warmth at times.
- Rainfall is most likely to be near normal (45% chance). Sub-tropical low pressure systems may occasionally track toward the region, such as during the third week of September, increasing the risk for heavy rain. Conversely, fewer westerly winds may lead to dry spells, particularly in western parts of the region like Tasman and Buller.
- Soil moisture levels and river flows are most likely to be near normal (40-45% chance).
The full probability breakdown is:
|
Temperature |
Rainfall |
Soil moisture |
River flows |
|
|
Above average |
60 |
25 |
30 |
25 |
|
Near average |
35 |
45 |
40 |
45 |
|
Below average |
05 |
30 |
30 |
30 |
West Coast, Alps and foothills, inland Otago, Southland
Probabilities are assigned in three categories: above average, near average, and below average.
- Temperatures are very likely to be above average (65% chance). More northeasterly winds may cause periods of increased sunshine and warmer temperatures.
- Rainfall totals are about equally likely to be near normal (40% chance) or below normal (35% chance). Fewer westerly winds during spring may lead to lengthy dry spells; however, this may be interspersed with occasionally heavy, moisture-laden fronts.
- Soil moisture levels and river flows are most likely to be near normal (45% chance).
The full probability breakdown is:
|
Temperature |
Rainfall |
Soil moisture |
River flows |
|
|
Above average |
65 |
25 |
25 |
25 |
|
Near average |
35 |
40 |
45 |
45 |
|
Below average |
05 |
35 |
30 |
30 |
Coastal Canterbury, east Otago
Probabilities are assigned in three categories: above average, near average, and below average.
- Temperatures are most likely to be above average (55% chance). Fewer westerly winds may lead to fewer warm days, although more frequent onshore winds may contribute to more cloud cover and warmer overnight temperatures.
- Rainfall totals are most likely to be near normal (45% chance). Frequent anticyclones may contribute to longer dry spells, although these may be interspersed with occasional sub-tropical lows that transport moisture from the north.
- Soil moisture levels and river flows are most likely to be near normal (50% chance).
The full probability breakdown is:
|
Temperature |
Rainfall |
Soil moisture |
River flows |
|
|
Above average |
55 |
20 |
15 |
15 |
|
Near average |
40 |
45 |
50 |
50 |
|
Below average |
05 |
35 |
35 |
35 |
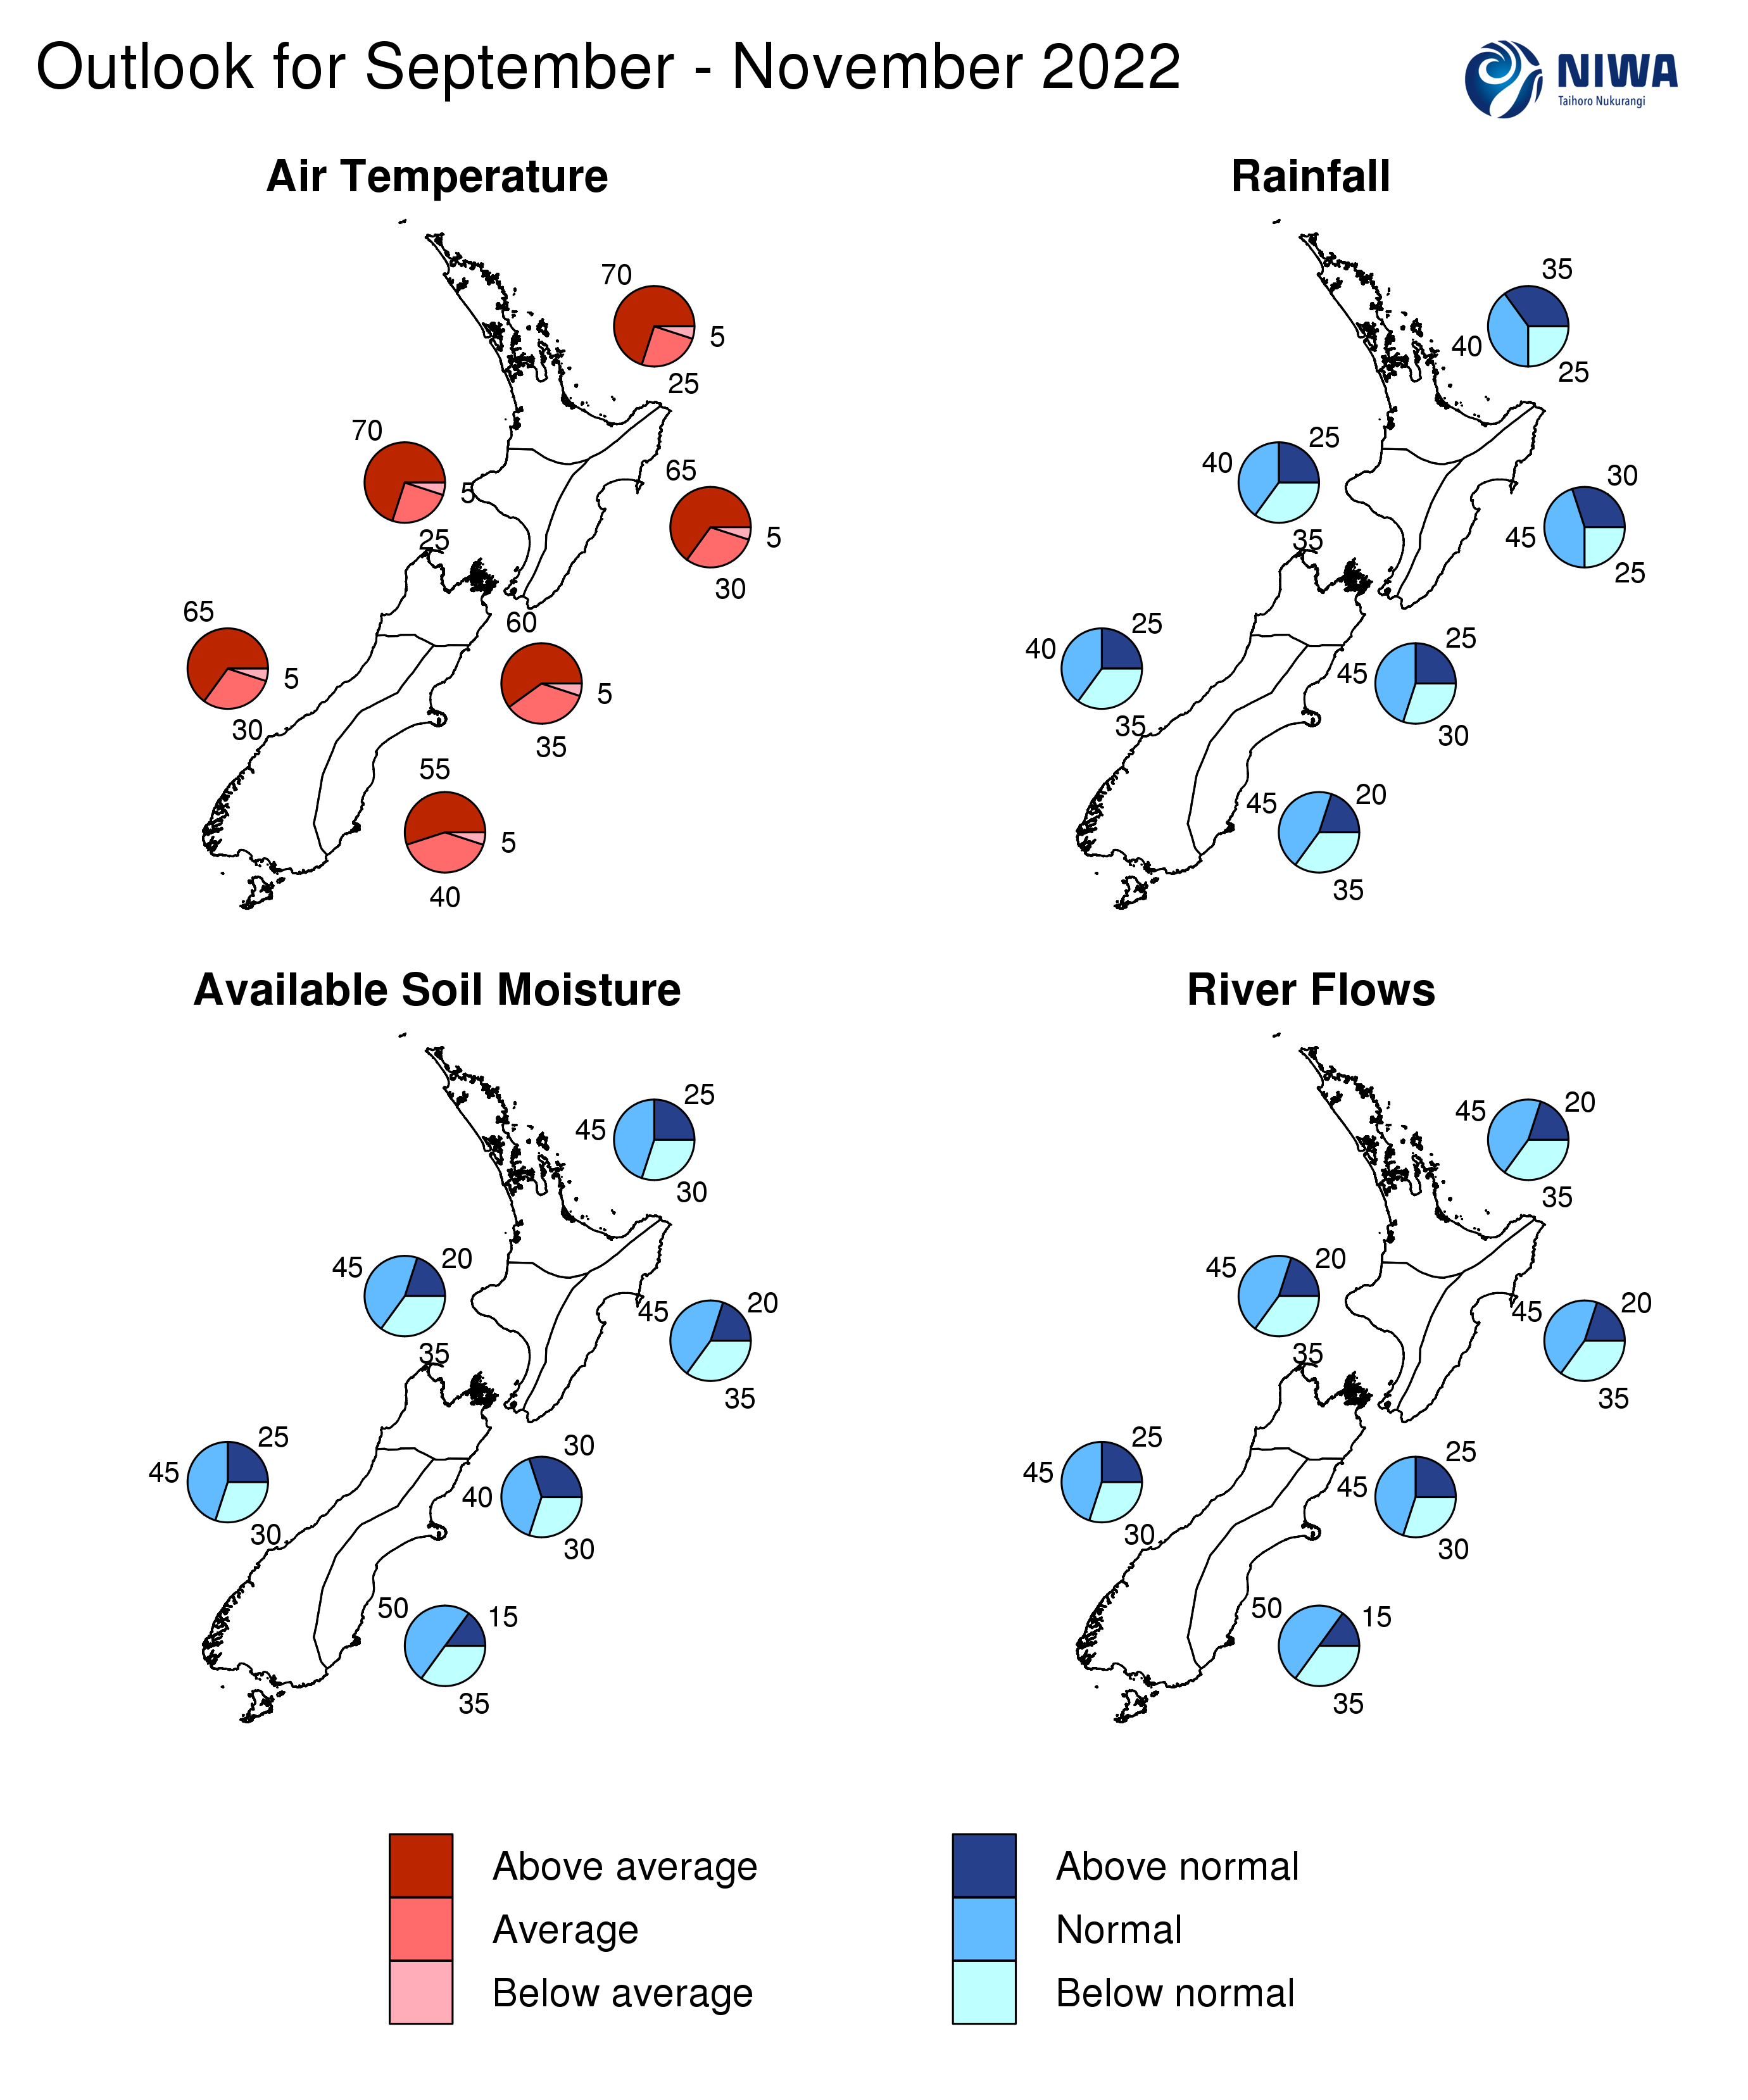
Graphical representation of the regional probabilities
Background
The NINO3.4 Index anomaly (in the central equatorial Pacific) over the last month (through 30 August) was -1.01˚C (climatology: 1991-2020), showing a strong cooling trend compared to July. In the last four decades, only four Augusts had cooler central equatorial Pacific SSTs than 2022, including August 2010, 1999, 1998, and 1988.
The provisional August monthly SOI was +1.2 and +1.7 from June-August (climatology: 1991-2020), both in the La Niña range.
Trade winds across the central equatorial Pacific were much stronger than normal during August by as much 10-15 knots, similar to July. This fostered the restrengthening of oceanic La Niña. Strong to very strong trade winds are predicted to continue during spring with a high likelihood for cooling seas.
In the subsurface central equatorial Pacific, substantially cooler than average waters (-3˚C to -5˚C) persisted and expanded eastward. These cooler waters are expected to migrate toward the surface over the next month or two, leading to further decreases in SSTs. Oceanic La Niña will likely grow stronger by late spring.
Taking these factors into account, La Niña conditions are very likely to continue during September-November (75-80% chance). During December-February, there is a 55-60% chance for La Niña. A “triple dip” La Niña (three consecutive La Niña events from 2020-2022) is very likely, the first since 1998-2000. It is worth noting that tropical weather patterns during winter 2022 showed relatively strong similarities with those of 1998.
A SST seesaw in the Indian Ocean, called the Indian Ocean Dipole (IOD), was in its negative phase during August and is expected to peak during September and October. The IOD has been associated with greater moisture availability for low pressure systems approaching New Zealand, as evidenced by outgoing longwave radiation (cloud cover) anomalies and precipitable water anomalies. This will likely continue at some level into spring, although the prevalence of high pressure systems near New Zealand may deflect depressions off to the north more frequently than in recent months.
During winter, convective forcing was dominated by the low frequency signal of the negative Indian Ocean Dipole and La Niña. Pulses of the Madden-Julian Oscillation (MJO) moved across the Indian Ocean and into the Australasia region relatively frequently before weakening in the Pacific in response to La Niña’s cool pool of water.
As of late August, an MJO pulse was moving across the Indian Ocean (phase 2). Eastward propagation of the pulse is forecast to continue during the first half of September, reaching phases 3 and 4 before the signature fades upon passing across the Pacific. This is expected to be associated with a sub-tropical low pressure system in the northern North Island during the first week of September and another during the third week of the month, possibly affecting more regions.
MJO activity may re-emerge over the Indian Ocean late in October, again favouring phases 2-3. During October, phase 2 is generally associated with near or above normal rainfall while phase 3 is often sharply drier. Both phases support warmer than average temperatures. The effect of the IOD may wane in November as the low frequency forcing pattern from La Niña takes hold. This could support more easterly-quarter winds around the country.
With MJO forcing predicted to continue over the next 1-2 months, New Zealand may continue to be exposed to occasional but heavy northerly rainmakers. Although the number of dry days may increase, spells of intense rain may still occur periodically.
The Southern Annular Mode (SAM) was variable during early August before turning strongly positive. A variable SAM pattern is predicted to continue into September. The SAM will likely spend more time in its positive phase over the coming months, particularly if climate models’ predictions of higher air pressure around the country eventuate.
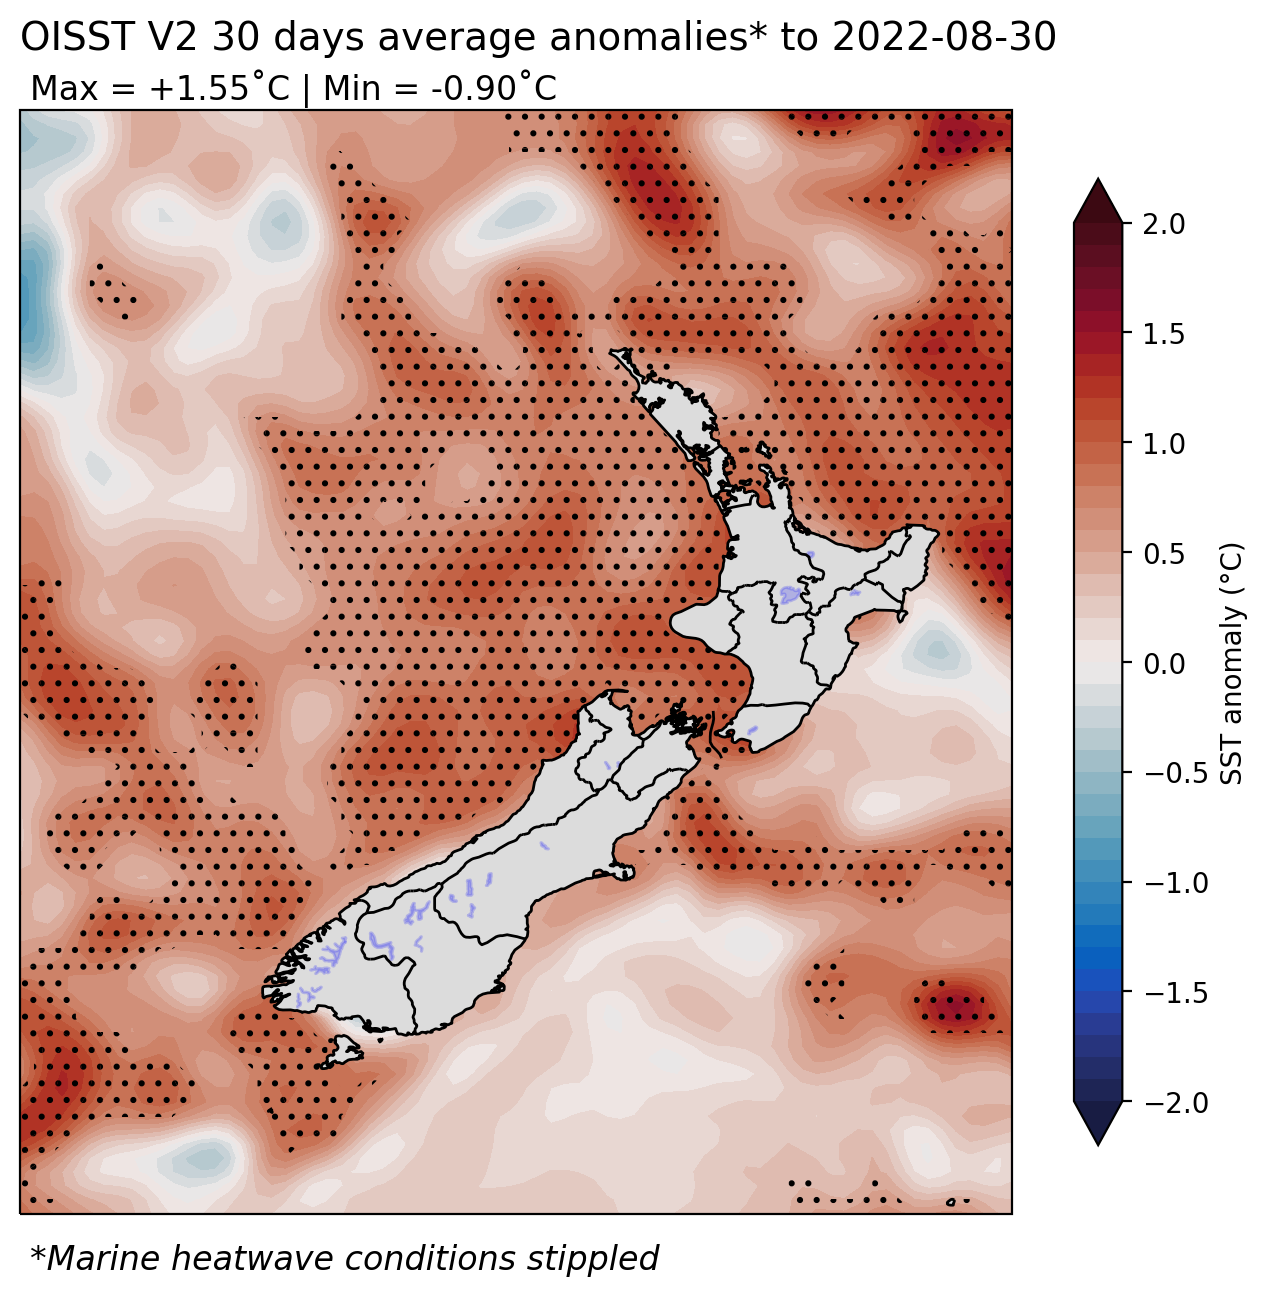
New Zealand’s coastal water temperatures remained above average during August, with anomaly values similar to July. Marine heatwave conditions persisted around the northern and western North Island and northern, western, and lower South Island. Compared to this time last year, seas are warmer around the North Island and northern South Island. Model guidance remains consistent in its expectation for above average SSTs over the next three to six months, with most models showing a sharp increase in anomalies in October-November. Given the high-impact nature of recent summer marine heatwaves, the maritime sector should monitor this situation closely. For more information, see the NIWA Sea Surface Temperature Update.
NZ 30-day coastal SST anomalies (to 30 August)
|
North NI |
+0.78˚C |
|
West NI |
+1.01˚C |
|
East NI |
+0.54˚C |
|
North SI |
+0.90˚C |
|
West SI |
+0.50˚C |
|
East SI |
+0.54˚C |
Forecast Confidence
Temperature
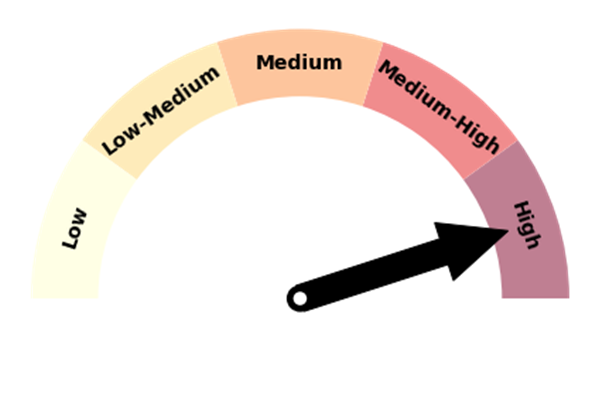 |
Forecast confidence for temperatures is high. The winter months were markedly warmer than average, due in part to unusually warm coastal seas. This is forecast to continue, along with more northeasterly quarter (sub-tropical) winds. A vast majority of the climate models that NIWA surveys expect a warmer than average spring, which is consistent with La Niña. |
Rainfall
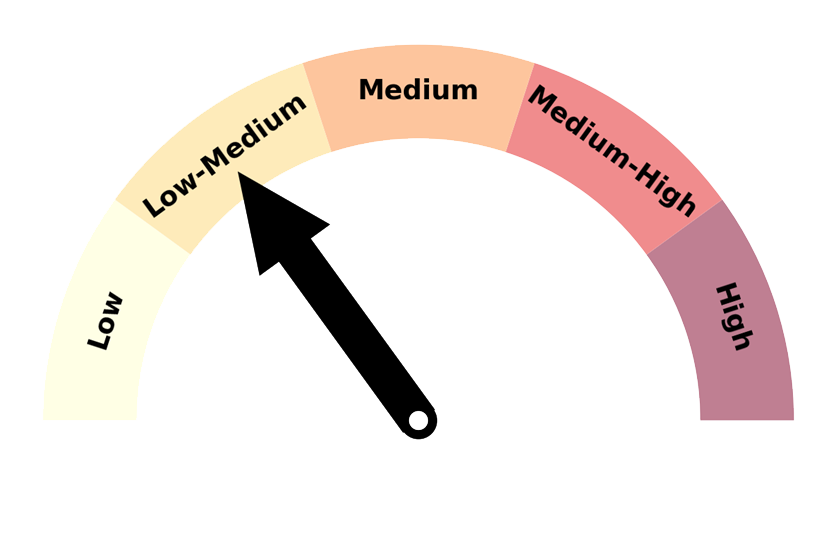
|
Forecast confidence for rainfall is low-medium. The spring season may be a battleground of pressure features in the New Zealand region, with sub-tropical lows and occasionally strong high pressure belts, particularly near and east of the South Island. This makes seasonal rainfall predictions challenging. The season will include a mix of wet and dry periods. |