Outlook summary
- A weak, central Pacific El Niño continued during April, as patterns of enhanced rainfall persisted in the vicinity of the International Dateline. Although El Niño is forecast to continue during the upcoming three-month period, it may weaken later in 2019.
- Air pressure is expected to be higher than normal to the west and north of New Zealand and below normal to the south of the country, resulting in more westerly quarter winds than normal.
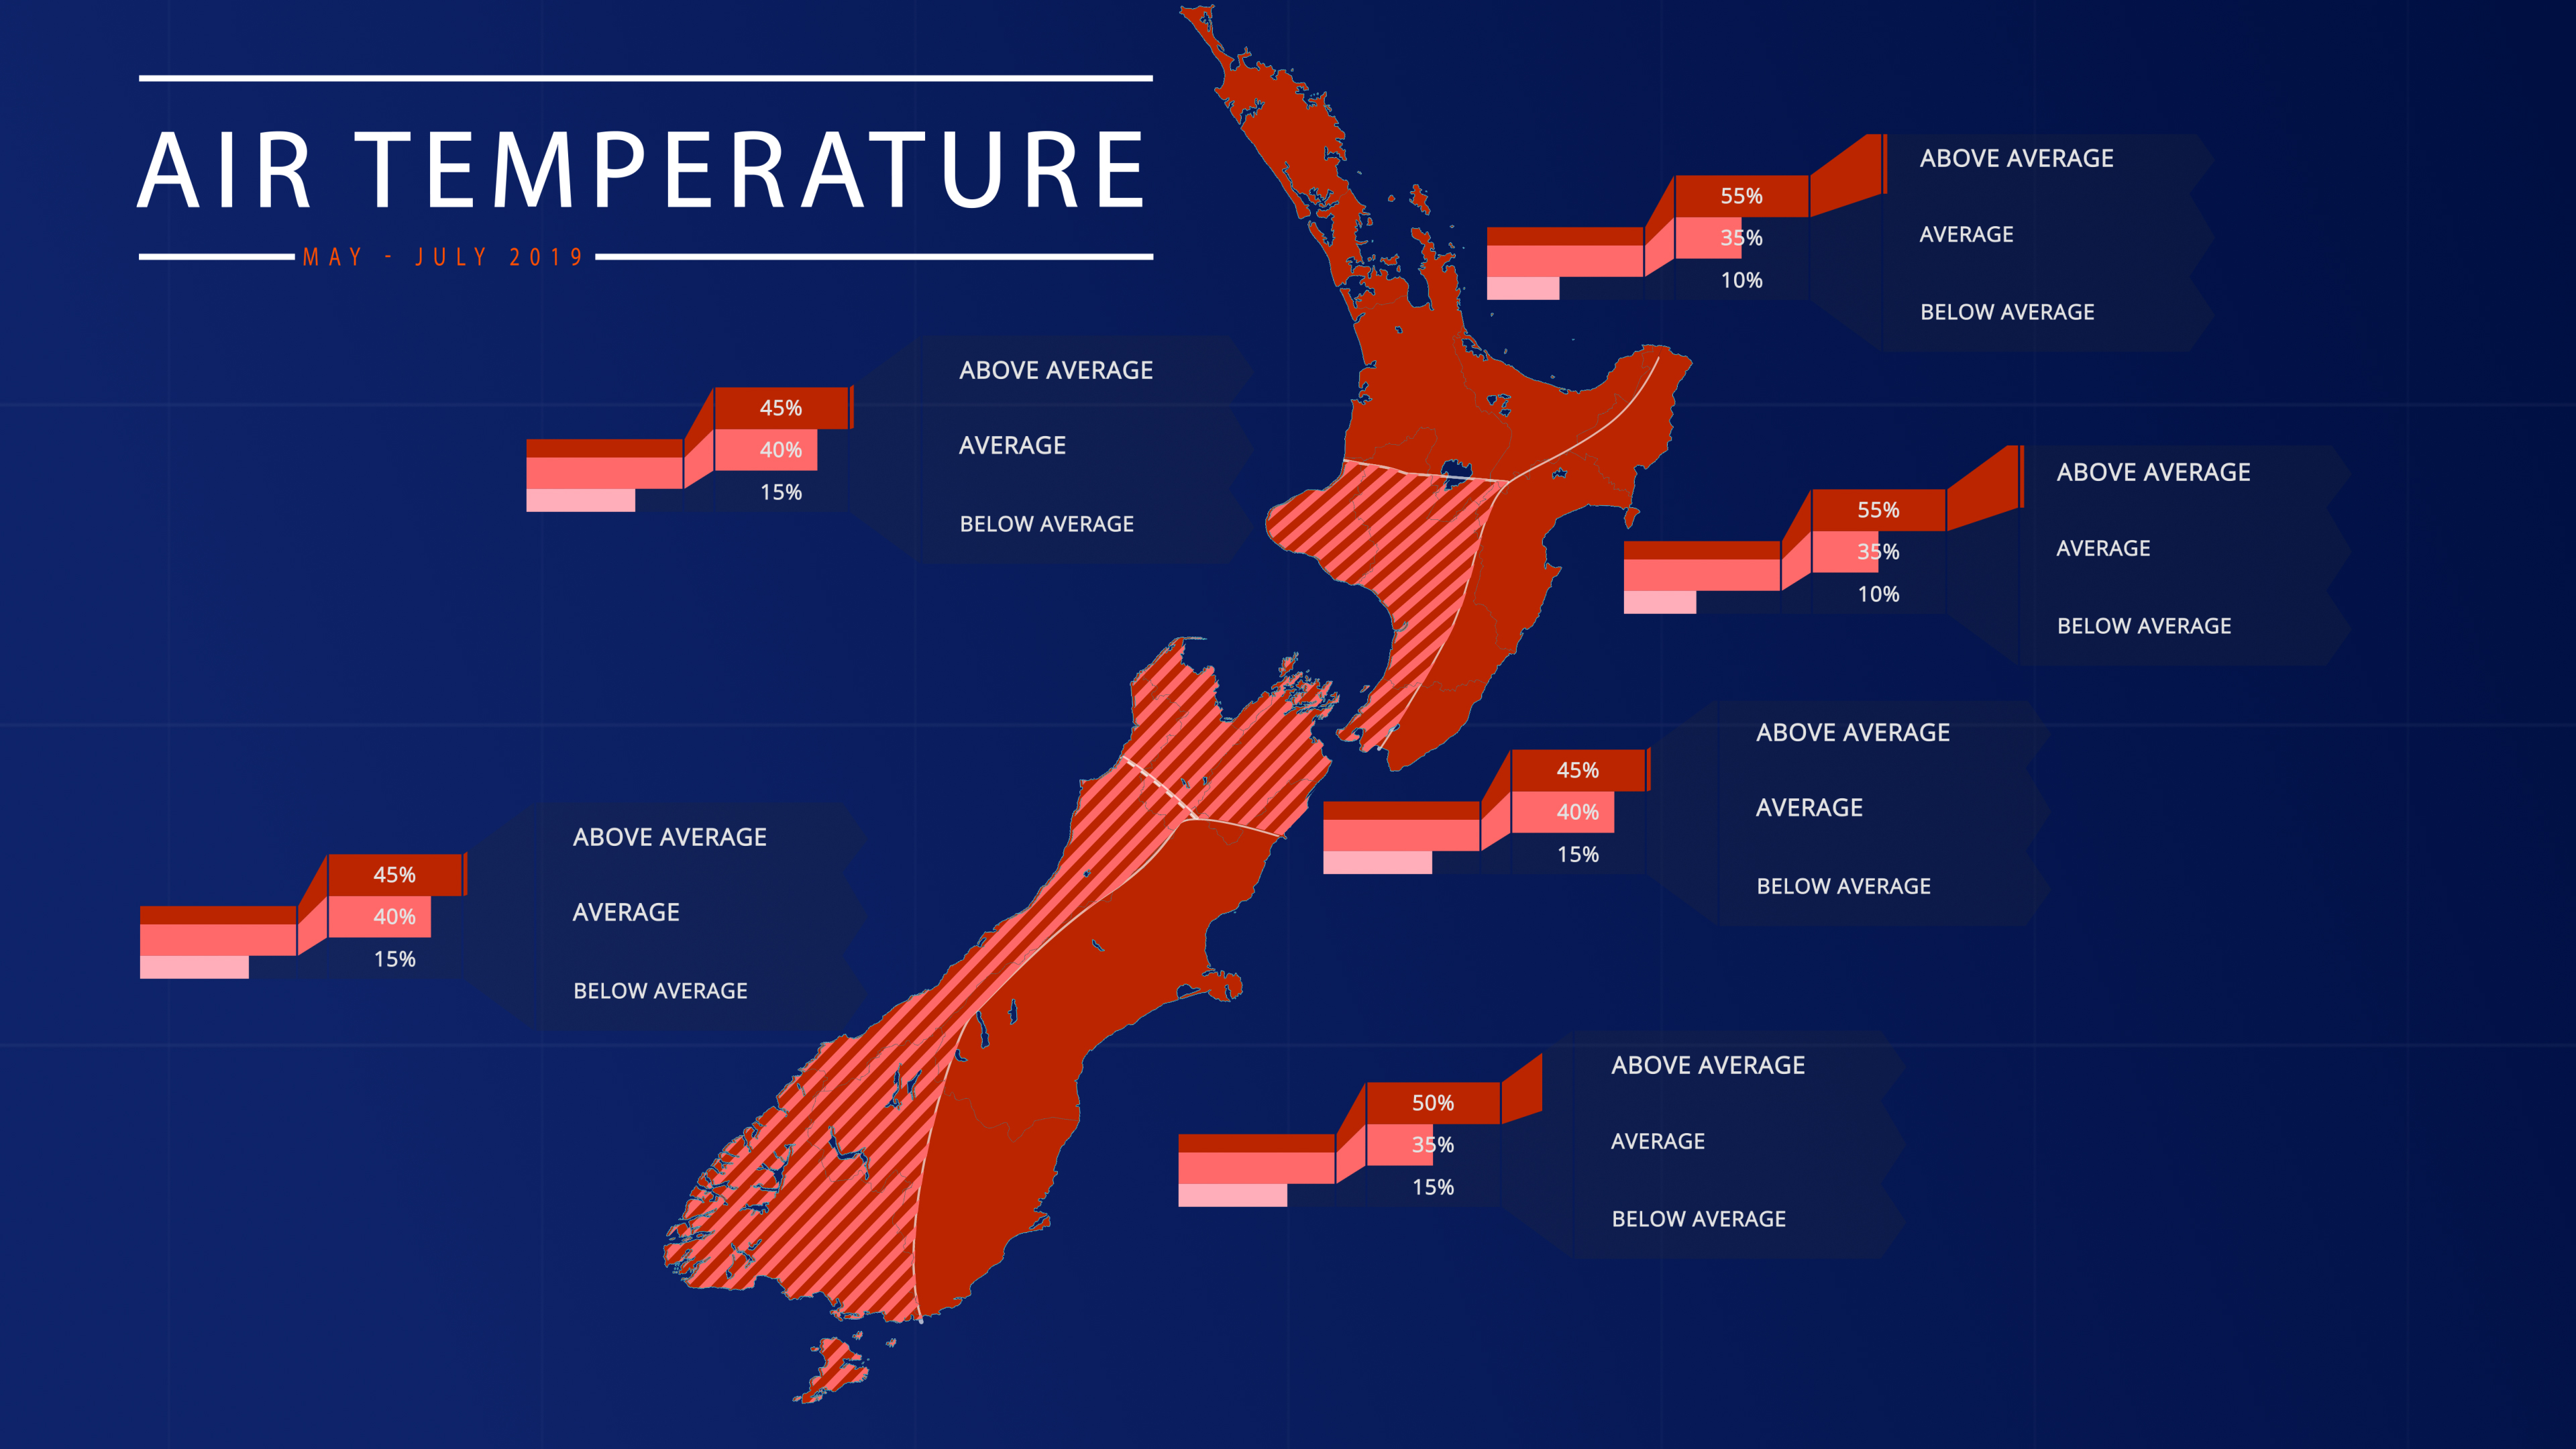
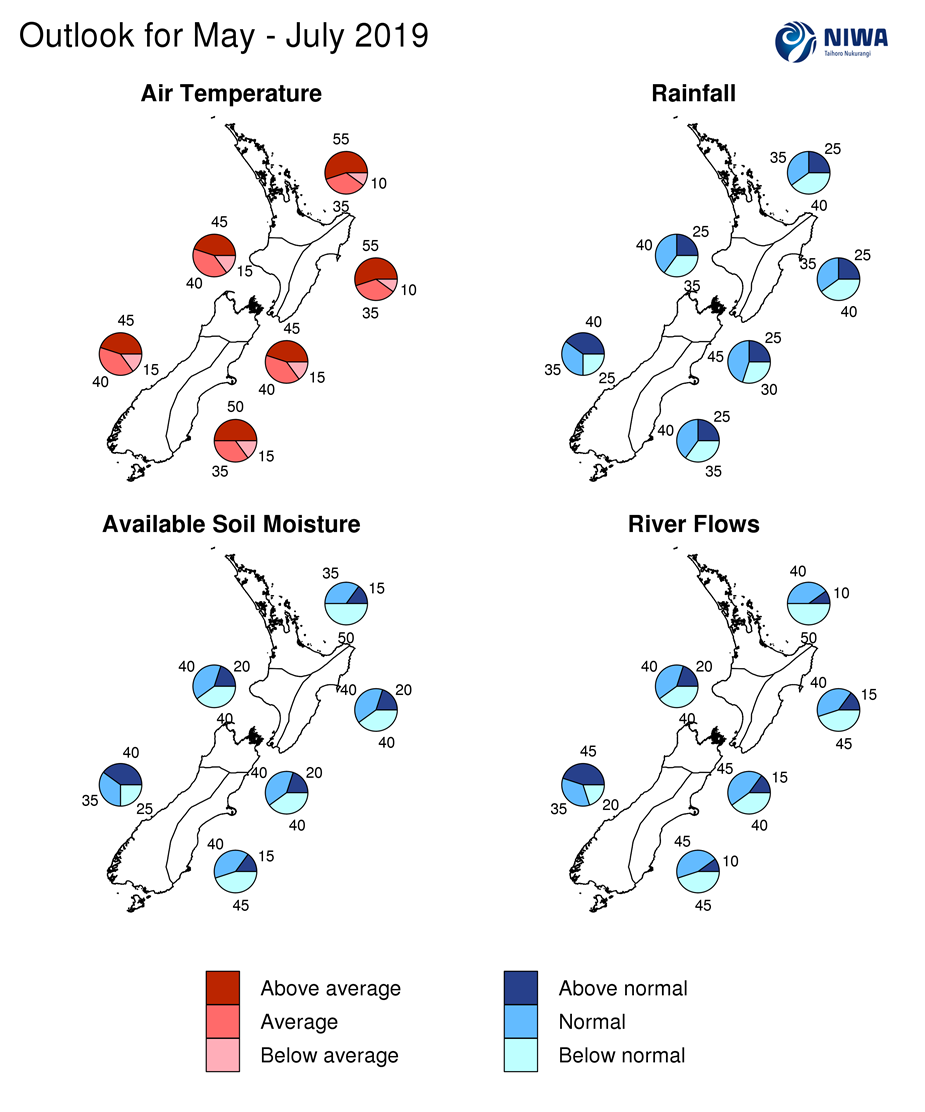
- Temperatures are forecast to be above average in the north and east of the North Island and east of the South Island and about equally likely to be above average or near average in all remaining regions. Warmer than average coastal and Tasman Sea surface temperatures may influence several spells of unseasonable warmth through the season, particularly in eastern areas, contributed to by frequent westerly air flows.
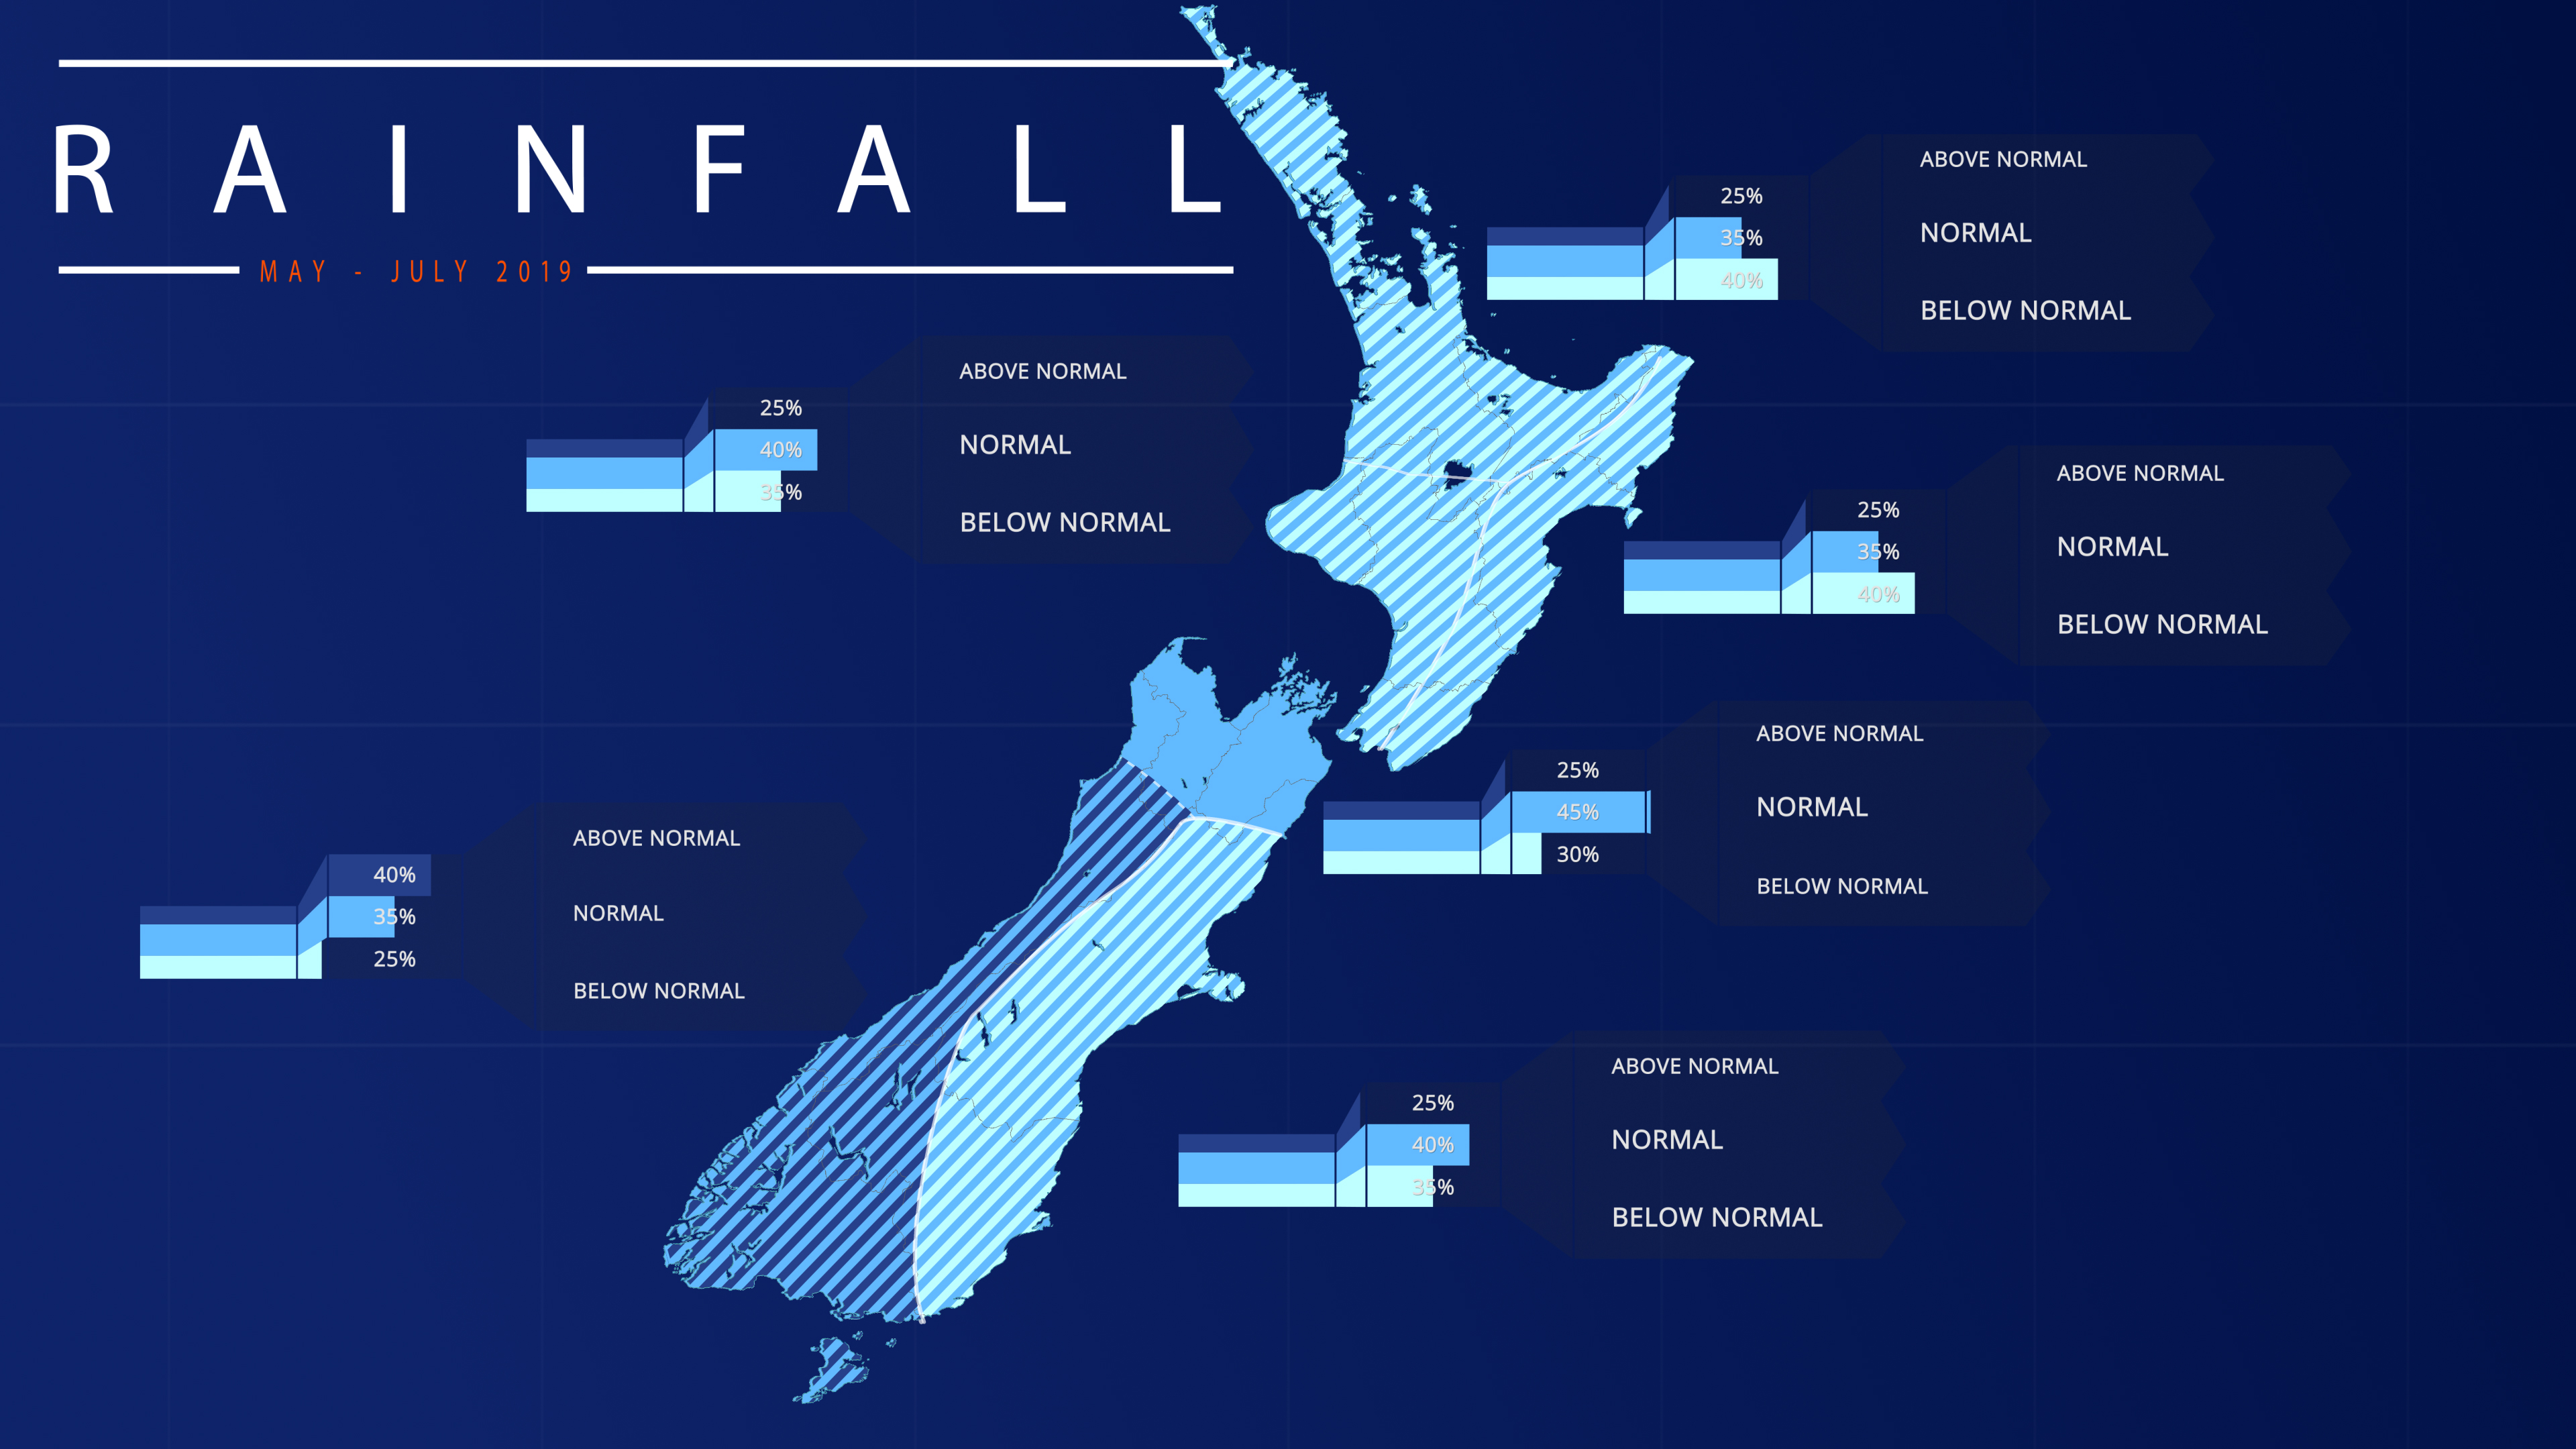
- Rainfall is about equally likely to be below normal or near normal in the North Island and in the east of the South Island, most likely to be near normal in the north of the South Island, and about equally likely to be above normal or near normal in the west of the South Island. Influenced by El Niño and a progressively more active Tasman Sea, frequent fronts are possible for western areas through the season.
- During April 2019, marine heatwave conditions continued in the Tasman Sea. Warmer than average seas may lead to a reduction in the intensity and duration of cold spells during the coming season, however frosts are still to be expected.
NIWA Principal Scientist Chris Brandolino and Meteorologist Ben Noll chat about New Zealand's climate outlook for May through to July 2019:
May – July 2019 temperatures are forecast to be above average in the north and east of the North Island and east of the South Island (50-55% chance) and about equally likely to be above average (45% chance) or near average (40% chance) in all remaining regions of New Zealand. However, cold snaps and frosts are likely to occur, particularly in colder locations, as the season progresses.
May – July 2019 rainfall is about equally likely to be above normal (40% chance) or near normal (35% chance) in the west of the South Island, most likely to be near normal (45% chance) in the north of the South Island, and about equally likely to be below normal (35-40% chance) or near normal (35-40% chance) for all remaining regions of New Zealand.
May – July 2019 soil moisture levels and river flows are most likely to be below normal (50% chance) in the north of the North Island. For the west of the South Island, soil moisture levels are about equally likely to be above normal or near normal (35-40% chance) while river flows are most likely to be above normal (45% chance). For all other regions of New Zealand, soil moisture levels and river flows are about equally likely to be normal or below normal (40-45% chance).
Regional predictions for the May – July 2019 season
Northland, Auckland, Waikato, Bay of Plenty
The table below shows the probabilities (or percent chances) for each of three categories: above average, near average, and below average. In the absence of any forecast guidance there would be an equal likelihood (33% chance) of the outcome being in any one of the three categories. Forecast information from local and global guidance models is used to indicate the deviation from equal chance expected for the coming three-month period, with the following outcomes the most likely (but not certain) for this region:
- Temperatures are most likely to be above average (55% chance).
- Rainfall totals are about equally likely to be near normal (35% chance) or below normal (40% chance).
- Soil moisture levels and river flows are most likely to be below normal (50% chance).
The full probability breakdown is:
|
Temperature |
Rainfall |
Soil moisture |
River flows |
|
|
Above average |
55 |
25 |
15 |
10 |
|
Near average |
35 |
35 |
35 |
40 |
|
Below average |
10 |
40 |
50 |
50 |
Central North Island, Taranaki, Whanganui, Manawatu, Wellington
Probabilities are assigned in three categories: above average, near average, and below average.
- Temperatures are about equally likely to be above average (45% chance) or near average (40% chance).
- Rainfall totals are about equally likely to be near normal (40% chance) or below normal (35% chance).
- Soil moisture levels and river flows are equally likely to be below normal (40% chance) or near normal (40% chance).
The full probability breakdown is:
|
Temperature |
Rainfall |
Soil moisture |
River flows |
|
|
Above average |
45 |
25 |
20 |
20 |
|
Near average |
40 |
40 |
40 |
40 |
|
Below average |
15 |
35 |
40 |
40 |
Gisborne, Hawke’s Bay, Wairarapa
Probabilities are assigned in three categories: above average, near average, and below average.
- Temperatures are most likely to be above average (55% chance).
- Rainfall totals are about equally likely to be below normal (40% chance) or near normal (35% chance).
- Soil moisture levels and river flows are about equally likely to be below normal (40-45% chance) or near normal (40% chance).
The full probability breakdown is:
|
Temperature |
Rainfall |
Soil moisture |
River flows |
|
|
Above average |
55 |
25 |
20 |
15 |
|
Near average |
35 |
35 |
40 |
40 |
|
Below average |
10 |
40 |
40 |
45 |
Tasman, Nelson, Marlborough, Buller
Probabilities are assigned in three categories: above average, near average, and below average.
- Temperatures are about equally likely to be above average (45% chance) or near average (40% chance).
- Rainfall totals are most likely to be near normal (45% chance).
- Soil moisture levels and river flows are about equally likely to be below normal (40% chance) or near normal (40-45% chance).
The full probability breakdown is:
|
Temperature |
Rainfall |
Soil moisture |
River flows |
|
|
Above average |
45 |
25 |
20 |
15 |
|
Near average |
40 |
45 |
40 |
45 |
|
Below average |
15 |
30 |
40 |
40 |
West Coast, Alps and foothills, inland Otago, Southland
Probabilities are assigned in three categories: above average, near average, and below average.
- Temperatures are about equally likely to be above average (45% chance) or near average (40% chance).
- Rainfall totals are about equally likely to be above normal (40% chance) or near normal (35% chance).
- Soil moisture levels are about equally likely to be above normal (40% chance) or near normal (35% chance) and river flows are most likely to be above normal (45% chance).
The full probability breakdown is:
|
Temperature |
Rainfall |
Soil moisture |
River flows |
|
|
Above average |
45 |
40 |
40 |
45 |
|
Near average |
40 |
35 |
35 |
35 |
|
Below average |
15 |
25 |
25 |
20 |
Coastal Canterbury, east Otago
Probabilities are assigned in three categories: above average, near average, and below average.
- Temperatures are most likely to be above average (50% chance).
- Rainfall totals are about equally likely to be near normal (40% chance) or below normal (35% chance).
- Soil moisture levels and river flows are about equally to be below normal (45% chance) or near normal (40-45% chance).
The full probability breakdown is:
|
Temperature |
Rainfall |
Soil moisture |
River flows |
|
|
Above average |
50 |
25 |
15 |
10 |
|
Near average |
35 |
40 |
40 |
45 |
|
Below average |
15 |
35 |
45 |
45 |
Graphical representation of the regional probabilities
Background
During April 2019, the atmosphere once again responded to a warm pool of water in the central and western Pacific, with anomalous atmospheric lift, rainfall, and convection centred along and just west of the International Dateline. The NINO3.4 Index anomaly for April (to the 28th) was +0.76˚C, consistent with what occurred during March. The NINO1+2 Index (in the far eastern Pacific) had an anomaly of +0.57˚C.
Rainfall and SST patterns remained consistent with a weak, central Pacific El Niño.
At the end of April, the Madden-Julian Oscillation (MJO) became active and was expected to constructively interfere with the El Niño base-state during the month of May. As this occurs, the atmospheric response may become more aligned with an east-based El Niño (e.g. westerly quarter winds becoming more common for New Zealand).
The Southern Oscillation Index (SOI) was near neutral during April (preliminary value -0.1), an increase compared to March (-0.6). The rising branch of the Walker Circulation focused along and just west of the Dateline and a sinking branch over the central and eastern Pacific. This supports the idea that the ongoing El Niño event is of the central-based type, nudging the synoptic pressure patterns near Darwin and Tahiti away from what might be considered their typical positions.
The probability for oceanic El Niño conditions, according to the consensus from international models, is 83% for the May – July period. For August – October, the probability is 64%. For November 2019 – January 2020, El Niño remains the most likely outcome at 58%. This continues to suggest the potential for a ‘protracted’ event (multi-year duration).
New Zealand’s coastal water temperatures for April 2019 continued above or well above average in all areas. Marine heatwave conditions continued in the Tasman Sea.
New Zealand Coastal Sea Surface Temperatures during April 2019 [Derived by interpolating daily SSTs from NOAA OISSTv2 to coastal grid-points and averaging along the coastlines of the 6 forecast regions]
|
North NI |
West NI |
East NI |
North SI |
West SI |
East SI |
|
+0.9˚C |
+0.8˚C |
+0.9˚C |
+1.2˚C |
+2.1˚C |
+1.0˚C |
Warmer than average sea surface temperatures are forecast to persist during the coming three-month period. These warm seas may contribute to spells of unseasonable warmth and invigorate low pressure systems as they approach New Zealand from the west.
The Southern Annular Mode (SAM) was variable during the month of April. Continued variability is forecast during May. As the upcoming season continues, the SAM may have a tendency to become more negative (e.g. 2nd half of May and June) as the Tasman Sea begins to turn more active.
Download
Seasonal Climate Outlook for May - July 2019. [PDF 4MB]
Contact
For comment, please contact
Chris Brandolino, Principal Scientist – Forecasting, NIWA National Climate Centre Tel (09) 375 6335
Dr Brett Mullan, Principal Scientist, NIWA National Climate Centre Tel (04) 386 0508
Notes to reporters and editors
- NIWA’s outlooks indicate the likelihood of climate conditions being at, above, or below average for the season as a whole. They are not ‘weather forecasts’. It is not possible to forecast precise weather conditions three months ahead of time.
- The outlooks are the result of the expert judgment of NIWA’s climate scientists. They take into account observations of atmospheric and ocean conditions and output from global and local climate models. The presence of El Niño or La Niña conditions and the sea surface temperatures around New Zealand can be a useful indicator of likely overall climate conditions for a season.
- The outlooks state the probability for above average conditions, near average conditions, and below average conditions for rainfall, temperature, soil moisture, and river flows. For example, for winter (June–July–August) 2007, for all the North Island, we assigned the following probabilities for temperature: · Above average: 60 per cent · Near average: 30 per cent · Below average: 10 per cent We therefore concluded that above average temperatures were very likely.
- This three-way probability means that a random choice would be correct only 33 per cent (or one-third) of the time. It would be like randomly throwing a dart at a board divided into three equal parts, or throwing a dice with three numbers on it. An analogy with coin tossing (a two-way probability) is not correct.
- A 50 per cent ‘hit rate’ is substantially better than guesswork, and comparable with the skill level of the best overseas climate outlooks. See, for example, analysis of global outlooks issued by the International Research Institute for Climate and Society based in the US published in the Bulletin of the American Meteorological Society (Goddard, L., A. G. Barnston, and S. J. Mason, 2003: Evaluation of the IRI’s “net assessment” seasonal climate forecasts 1997–2001. Bull. Amer. Meteor. Soc., 84, 1761–1781).
- Each month, NIWA publishes an analysis of how well its outlooks perform. This is available online and is sent to about 3500 recipients of NIWA’s newsletters, including many farmers. See the New Zealand Climate Update.
- All outlooks are for the three months as a whole. There will inevitably be wet and dry days, and hot and cold days, within a season. The exact range in temperature and rainfall within each of the three categories varies with location and season. However, as a guide, the “near average” or middle category for the temperature predictions includes deviations up to ±0.5°C for the long-term mean, whereas for rainfall the “near normal” category lies between approximately 80 per cent and 115 per cent of the long-term mean.
- The seasonal climate outlooks are an output of a scientific research programme, supplemented by NIWA’s Capability Funding. NIWA does not have a government contract to produce these outlooks.
- Where probabilities are within 5% of one another, the term “about equally” is used.