Outlook summary
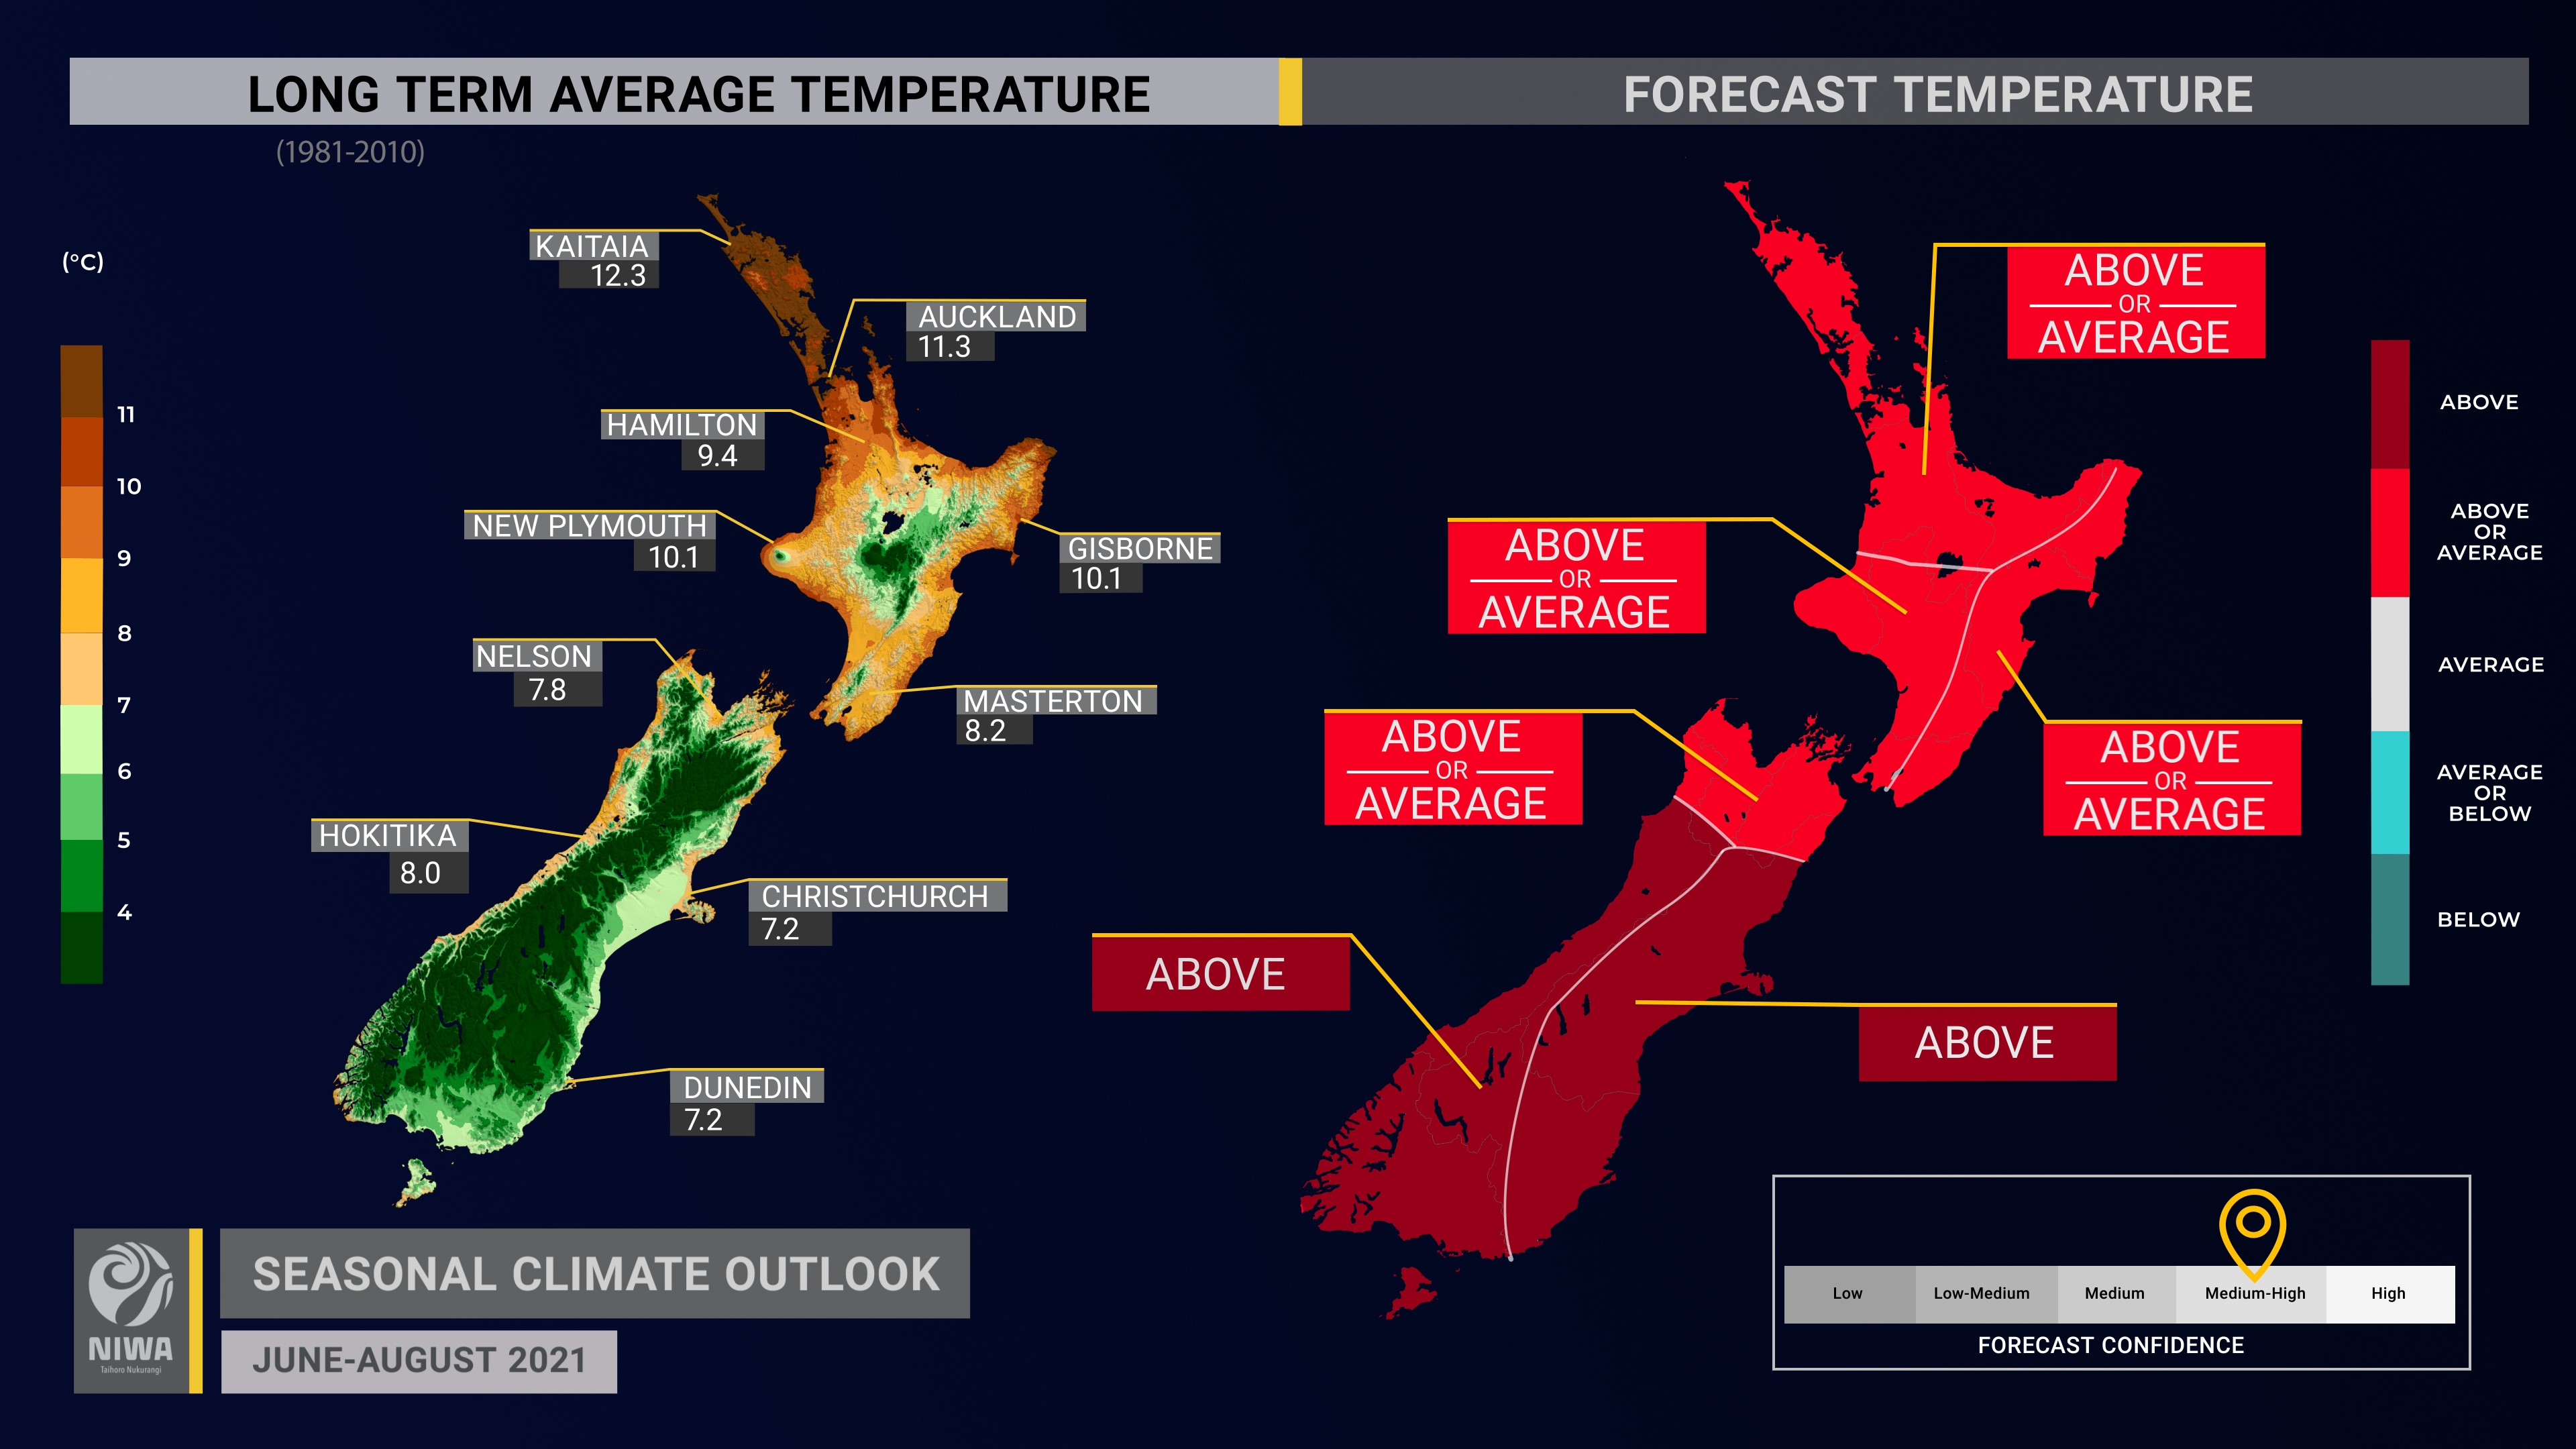
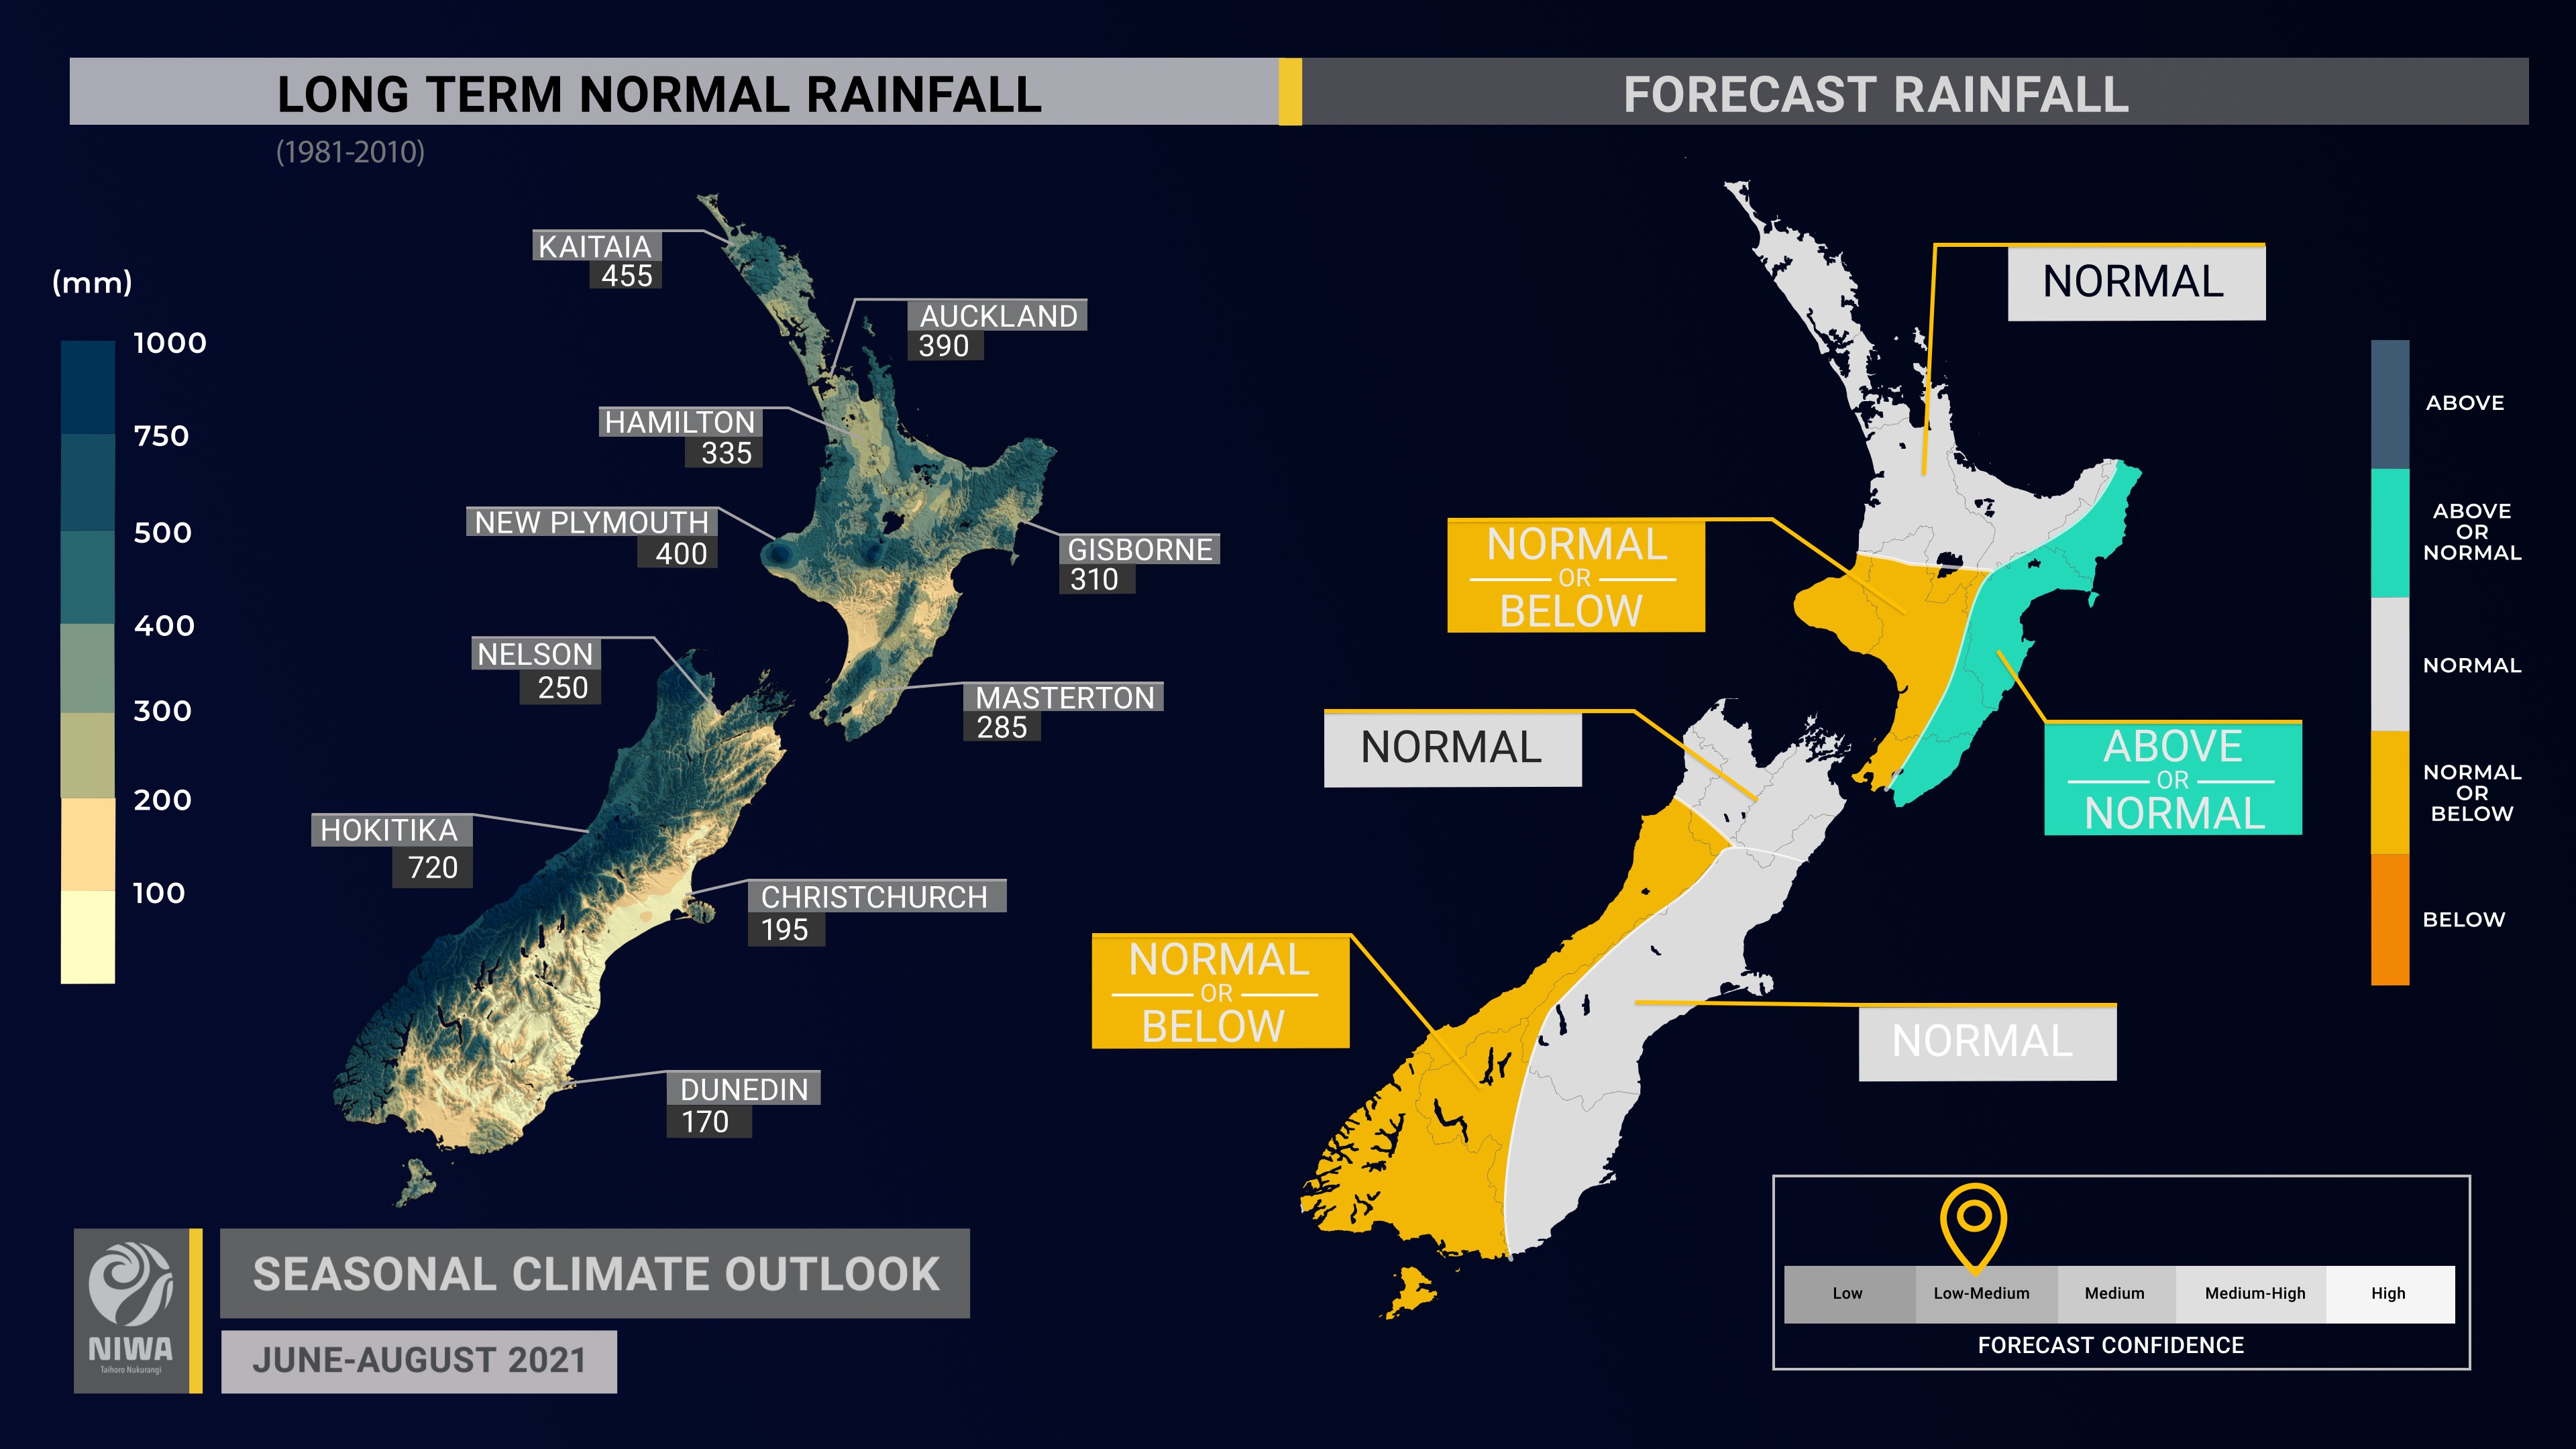
- Rainfall is most likely to be near normal in the north of the North Island and north and east of the South Island. Near normal or above normal rainfall is about equally likely in the east of the North Island. Near normal or below normal rainfall is about equally likely in the west of both islands.
- Although dry spells may continue to occur, periodic heavy rainfall events are possible. Some of the heavy rainfall events could be a result of atmospheric rivers of moisture making landfall in New Zealand, particularly in eastern areas, which increases the risk for flooding events – a point of difference from previous recent outlooks.
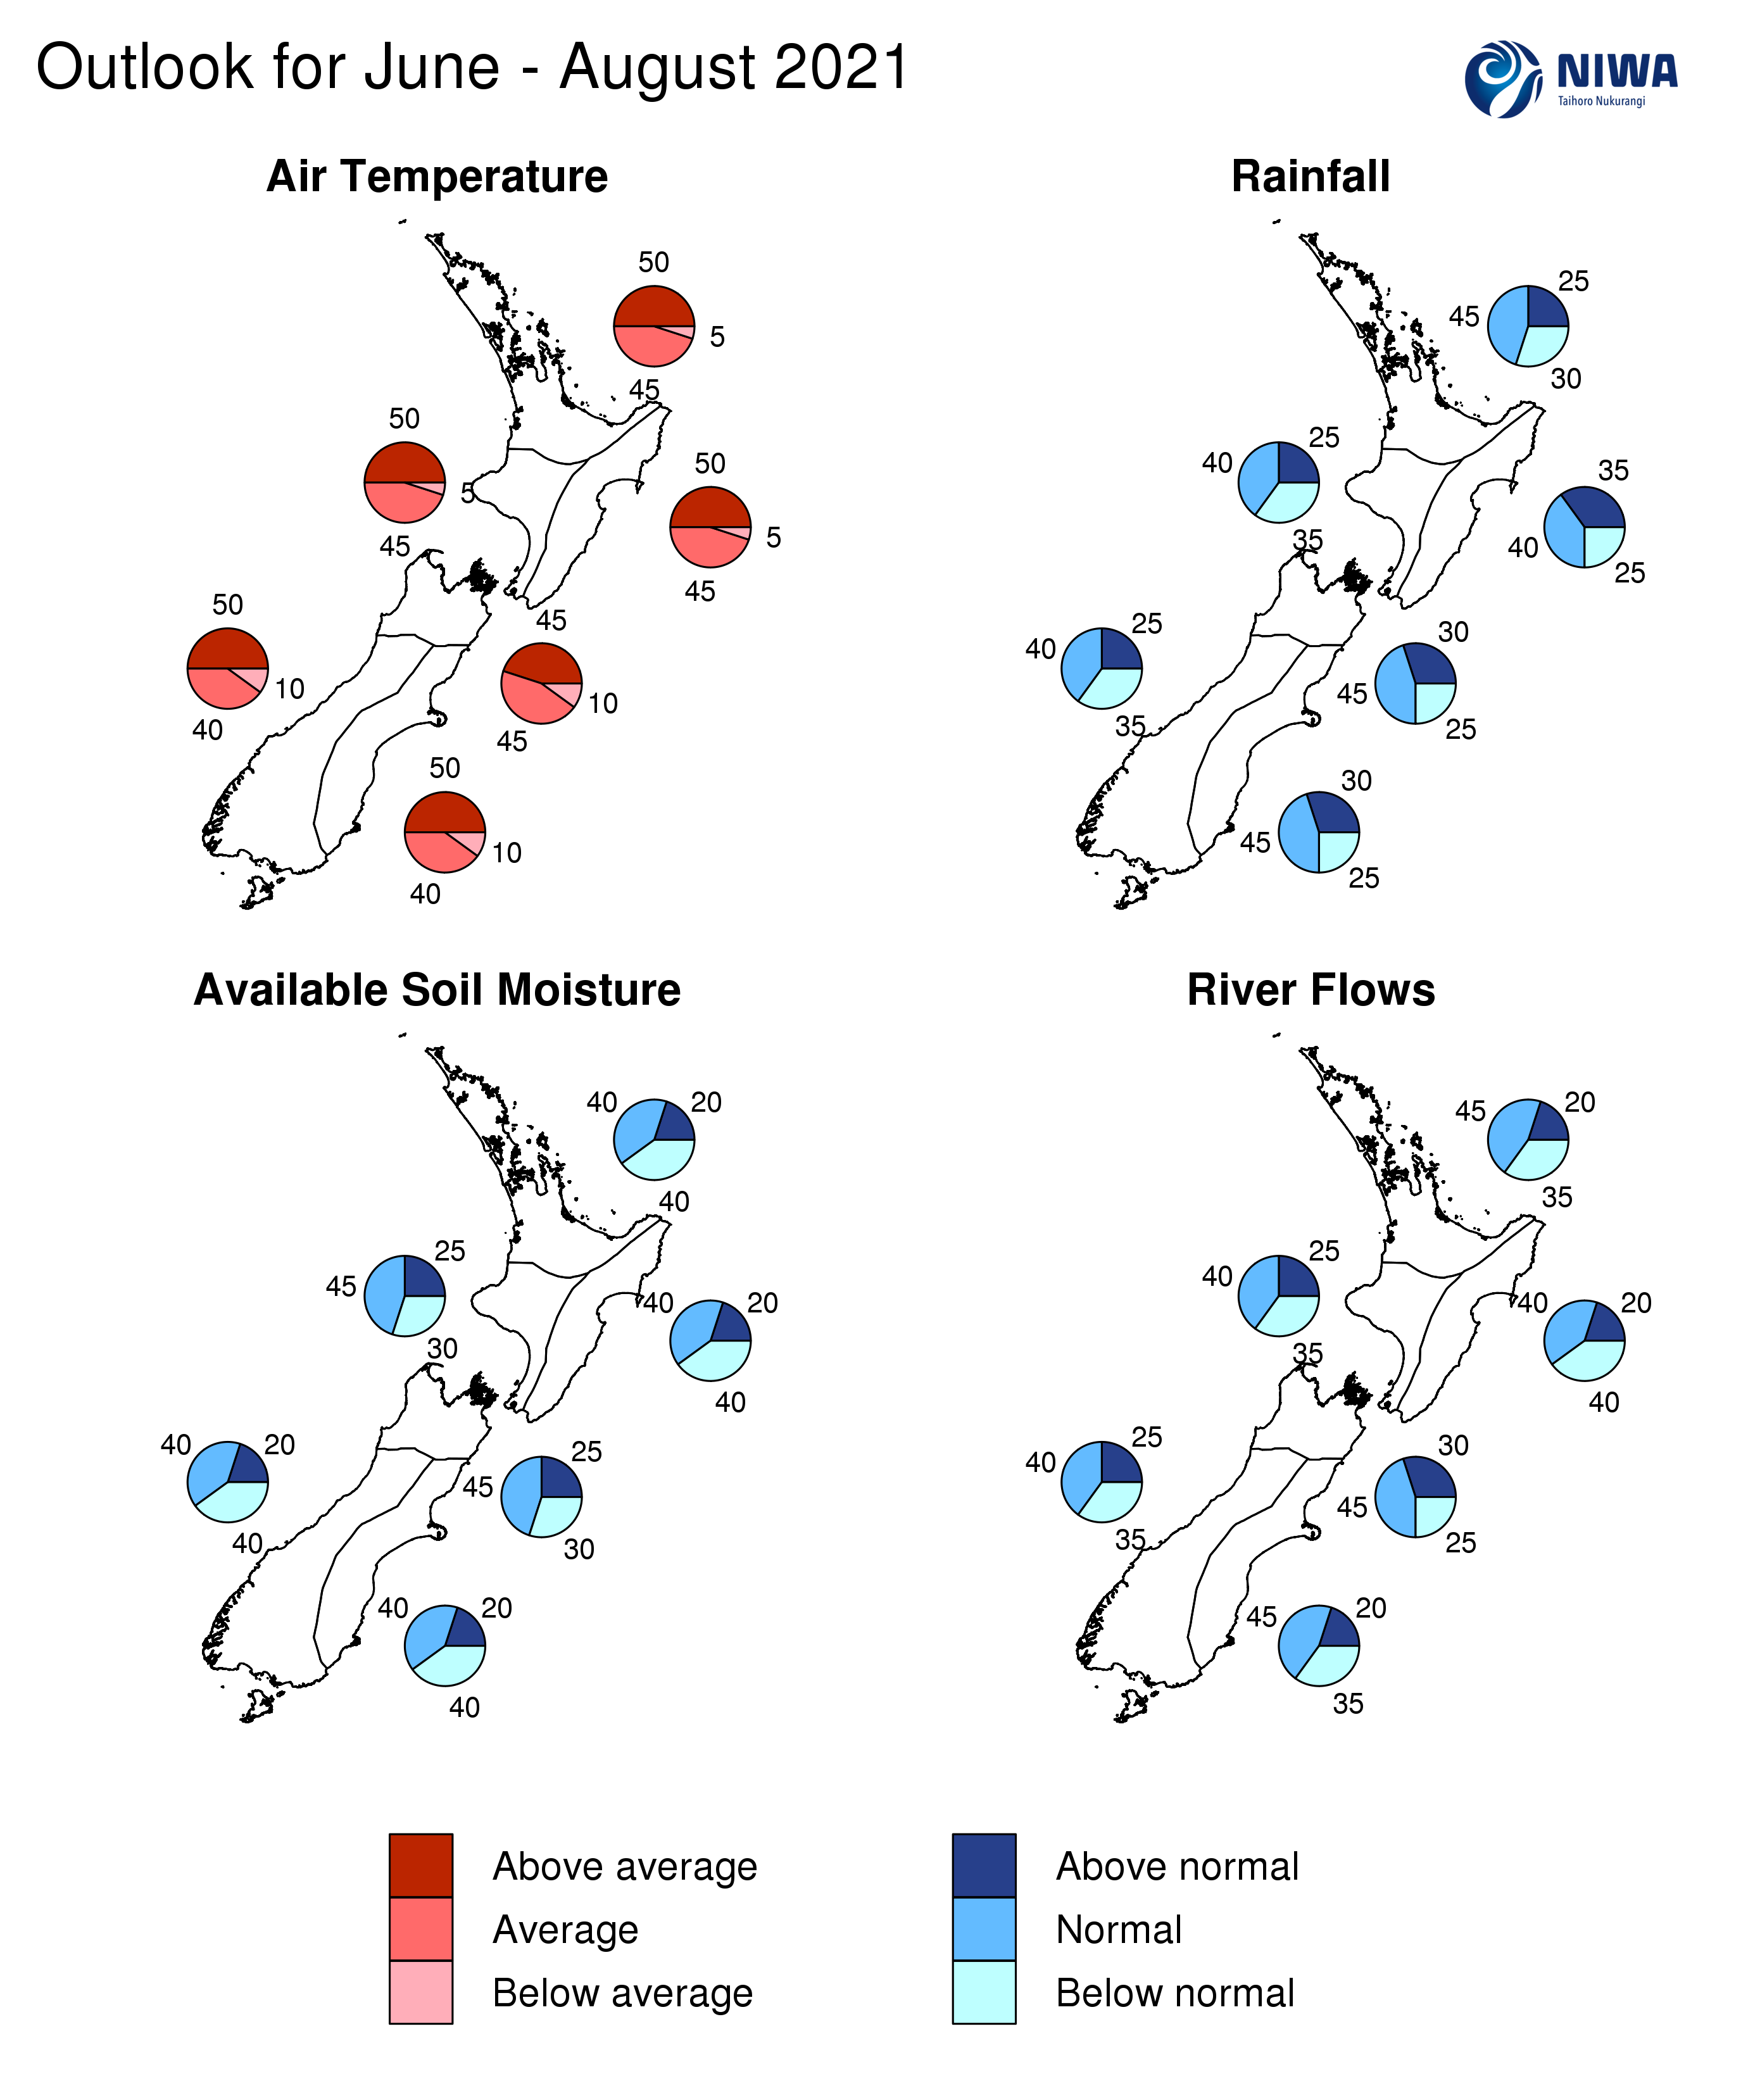
- Temperatures are most likely to be above average in the west and east of the South Island and about equally likely to be above average or near average in all other regions. While cold spells and frosts will occur, as is typical during winter, they may be infrequent.
- Air pressure is predicted to be higher than normal to the south and east of the country. This is expected to be associated with more westerly and northeasterly quarter winds than normal through the season.
- With ENSO neutral conditions established in the equatorial Pacific Ocean, there may be more variability in NZ’s weather patterns over the coming season. For more information, see the Background.
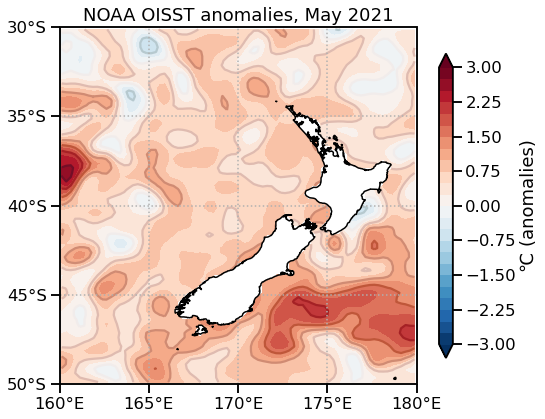
- New Zealand’s coastal sea surface temperatures (SSTs) ranged from 0.3 to 1.1˚C above average during May.
- Soil moisture levels are equally likely to be near normal or below normal in the north and east of the North Island and west and east of the South Island and most likely to be near normal elsewhere.
- River flows are about equally likely to be near normal or below normal in the west and east of the North Island and west of the South Island and most likely to be near normal elsewhere.
Regional predictions for June – August 2021
Northland, Auckland, Waikato, Bay of Plenty
The table below shows the probabilities (or percent chances) for each of three categories: above average, near average, and below average. In the absence of any forecast guidance there would be an equal likelihood (33% chance) of the outcome being in any one of the three categories. Forecast information from local and global guidance models is used to indicate the deviation from equal chance expected for the coming three-month period, with the following outcomes the most likely (but not certain) for this region:
- Temperatures are about equally likely to be above average (50% chance) or near average (45% chance).
- Rainfall totals are about most likely to be near normal (45% chance).
- Although near normal rainfall is most likely for the season as a whole, more dry days than normal are possible.
- Soil moisture levels are equally likely to be near normal (40% chance) or below normal (40% chance) and river flows are most likely to be near normal (45% chance).
The full probability breakdown is:
|
Temperature |
Rainfall |
Soil moisture |
River flows |
|
|
Above average |
50 |
25 |
20 |
20 |
|
Near average |
45 |
45 |
40 |
45 |
|
Below average |
05 |
30 |
40 |
35 |
Central North Island, Taranaki, Whanganui, Manawatu, Wellington
Probabilities are assigned in three categories: above average, near average, and below average.
- Temperatures are about equally likely to be above average (50% chance) or near average (45% chance).
- Rainfall totals are about equally likely to be near normal (40% chance) or below normal (35% chance).
- Soil moisture levels are most likely to be near normal (45% chance) and river flows are about equally likely to be near normal (40% chance) or below normal (35% chance).
The full probability breakdown is:
|
Temperature |
Rainfall |
Soil moisture |
River flows |
|
|
Above average |
50 |
25 |
25 |
25 |
|
Near average |
45 |
40 |
45 |
40 |
|
Below average |
05 |
35 |
30 |
35 |
Gisborne, Hawke’s Bay, Wairarapa
Probabilities are assigned in three categories: above average, near average, and below average.
- Temperatures are about equally likely to be above average (50% chance) or near average (45% chance).
- Rainfall totals are about equally likely to be near normal (40% chance) or above normal (35% chance).
- There is a chance for occasional heavy rainfall events.
- Soil moisture levels and river flows are equally likely to be near normal (40% chance) or below normal (40% chance).
- Sustained rainfall will be needed over several weeks before soil moisture and river flows return to normal.
The full probability breakdown is:
|
Temperature |
Rainfall |
Soil moisture |
River flows |
|
|
Above average |
50 |
35 |
20 |
20 |
|
Near average |
45 |
40 |
40 |
40 |
|
Below average |
05 |
25 |
40 |
40 |
Tasman, Nelson, Marlborough, Buller
Probabilities are assigned in three categories: above average, near average, and below average.
- Temperatures are equally likely to be above average (45% chance) or near average (45% chance).
- Rainfall totals are most likely to be near normal (45% chance).
- Soil moisture levels and river flows are most likely to be near normal (45% chance).
The full probability breakdown is:
|
Temperature |
Rainfall |
Soil moisture |
River flows |
|
|
Above average |
45 |
30 |
25 |
30 |
|
Near average |
45 |
45 |
45 |
45 |
|
Below average |
10 |
25 |
30 |
25 |
West Coast, Alps and foothills, inland Otago, Southland
Probabilities are assigned in three categories: above average, near average, and below average.
- Temperatures are most likely to be above average (50% chance).
- Rainfall totals are about equally likely to be near normal (40% chance) or below normal (35% chance).
- Periodic dry spells will continue to be possible about the hydro lake areas.
- Soil moisture levels and river flows are about equally likely to be near normal (40% chance) or below normal (35-40% chance).
The full probability breakdown is:
|
Temperature |
Rainfall |
Soil moisture |
River flows |
|
|
Above average |
50 |
25 |
20 |
25 |
|
Near average |
40 |
40 |
40 |
40 |
|
Below average |
10 |
35 |
40 |
35 |
Coastal Canterbury, east Otago
Probabilities are assigned in three categories: above average, near average, and below average.
- Temperatures are most likely to be above average (50% chance).
- Rainfall totals are most likely to be near normal (45% chance).
- Although longer dry spells may persist through the season, the chance for occasional heavy rainfall events is also elevated.
- Soil moisture levels are equally likely to be near normal (40% chance) or below normal (40% chance) and river flows are most likely to be near normal (45% chance).
The full probability breakdown is:
|
Temperature |
Rainfall |
Soil moisture |
River flows |
|
|
Above average |
50 |
30 |
20 |
20 |
|
Near average |
40 |
45 |
40 |
45 |
|
Below average |
10 |
25 |
40 |
35 |
Graphical representation of the regional probabilities
Background
The NINO3.4 Index anomaly (in the central Pacific) during May (through the 30th) was -0.11˚C, the smallest anomaly since July 2020. The Southern Oscillation Index was +0.5, in the ENSO neutral range.
During May, upper-oceanic heat content increased in the equatorial Pacific for the third consecutive month, reaffirming an end to La Niña. In the sub-surface, a second downwelling Kelvin wave progressed into the central Pacific, further solidifying a warming trend at depth.
According to the consensus from international models, the probability for ENSO neutral conditions is 73% for winter. For spring and summer, the probability for ENSO neutral is 49% and 48%, respectively. There is about a 1-in-3 chance that La Niña redevelops during spring.
During May, convective forcing was influenced primarily by the active phase of the Madden-Julian Oscillation (MJO) over Africa and the Indian Ocean, before propagating eastward to end the month.
Since ENSO neutral conditions are occurring, the MJO is expected to be a primary mode of climate variability over the coming season. The MJO can influence the jet stream pattern, which influences the likelihood for weather systems to approach New Zealand from the Southern Ocean or the sub-tropics.
During June, the MJO will be active over the Pacific to start the month before moving toward Africa and the Indian Ocean later in the month. This may be associated with a more settled weather pattern in NZ during the 2nd half of the month. During July, forcing may re-emerge over the Pacific, which would drive more regular low pressure systems for NZ.
NZ’s coastal water temperature anomalies were warmer than average during May, ranging from 0.3˚C to 1.1˚C above average.
NZ coastal SSTs during May 2021 (through the 29th)
|
North NI |
0.70˚C |
|
West NI |
0.87˚C |
|
East NI |
0.27˚C |
|
North SI |
0.76˚C |
|
West SI |
0.94˚C |
|
East SI |
1.07˚C |
The Southern Annular Mode (SAM) was strongly positive during the first half of May, associated with higher than normal air pressure near NZ. A dip to negative values was reflected by unsettled conditions at the end of the month. A variable SAM is most likely during the first half of June with mixed high and low pressures, but more positive values are possible during the second half of the month.
Forecast Confidence
Temperature
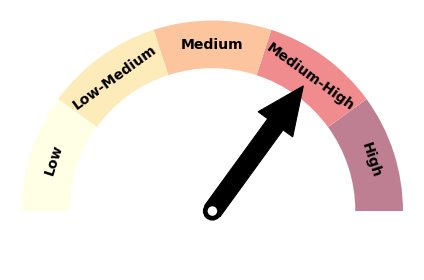
|
Forecast confidence for temperatures is medium to high. Warmer than average coastal seas and more frequent westerly and northeasterly wind flows don’t favour long periods of below average temperatures. |
Rainfall
|
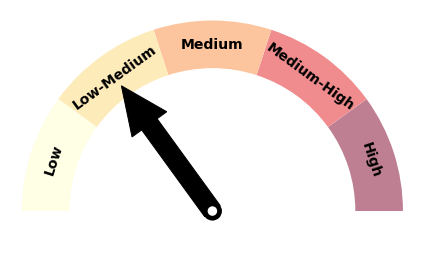
|
Forecast confidence for rainfall is low to medium. With ENSO neutral conditions established, NZ’s climate drivers will operate on shorter timescales (i.e. higher frequency). This can lead to more variability in weather patterns and produce more uncertainty over the course of a season. |
