Overview
ENSO-neutral conditions persisted in the tropical Pacific during May 2018. The Southern Oscillation Index (SOI) was positive at about +0.3 during the past 30 days. Sea surface temperatures (SSTs) in the central and eastern equatorial Pacific Ocean warmed for the second consecutive month and are now near or slightly above average for the time of year.
The equatorial subsurface ocean waters also continued to warm, reaching 3.0°C above average around 50 metres depth in the eastern Pacific and around 125 metres depth in the central Pacific.
The consensus from international forecast models is for the tropical Pacific to persist in an ENSO-neutral state over the next 3 month period (67% chance over June – August 2018). However, during late winter and early spring (August – October 2018), El Niño conditions are slightly favoured (45% chance) over ENSO-neutral (44% chance).
The atmospheric circulation around New Zealand is forecast to be characterized by mixed flow patterns during June-August 2018. Periodic easterly-quarter (NE to SE) air flows are signalled during June which may give way to more westerly or southwesterly air flows during July and/or August.
A changeable regime like the one described is a product of ENSO-neutral conditions in the tropical Pacific and near average sea surface temperatures around New Zealand. At times, southerly quarter flow patterns may deliver sharp cold snaps and snow, although these are likely to be counterbalanced by northerly and/or easterly flow patterns that could deliver some heavy rain events to the northern and eastern North Island and eastern South Island.
Meteorologist/Forecaster Ben Noll forecasts the Seasonal Climate Outlook for June - August 2018.
Outlook Summary
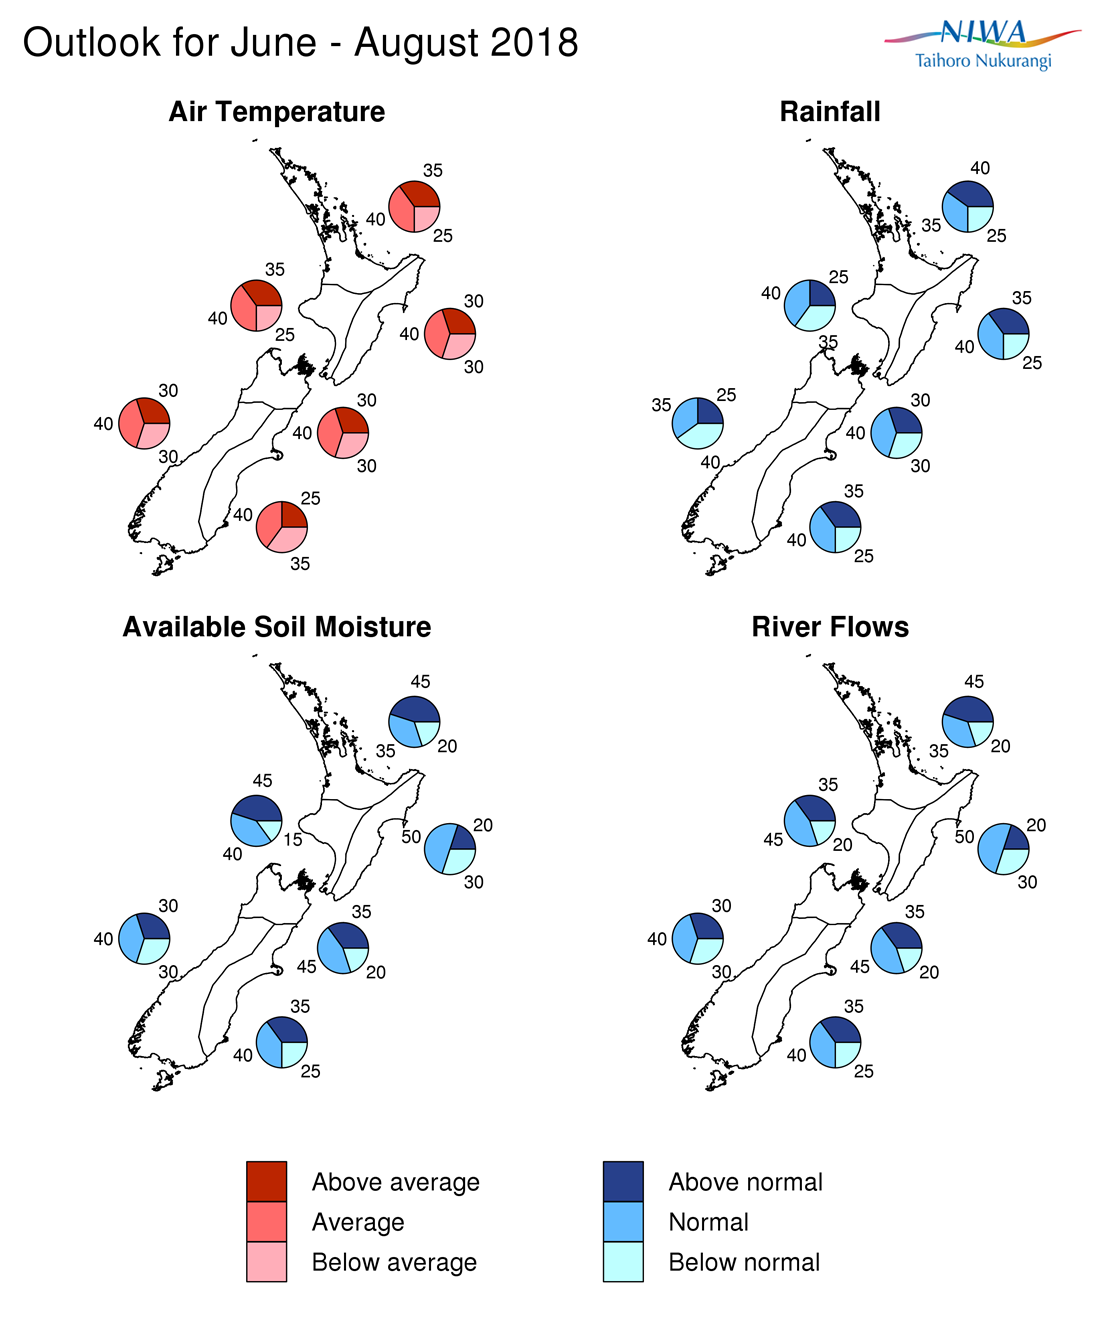
June – August 2018 temperatures are forecast to be near average (40% chance) or above average (35% chance) in the north and west of the North Island, near average (40% chance) or below average (35% chance) in the east of the South Island, near average (40% chance) for all other regions of the country. Periodic northeasterly air flows during the first half of winter in particular may bring mild periods to northern areas. Westerly-quarter (NW to SW) winds during the second half of the winter season may lead to cooler conditions in southern and western areas.
June – August 2018 rainfall totals are forecast to be near normal (35 to 40% chance) or above normal (35 to 40% chance) in the north and east of the North Island and east of the South Island. Normal (35 to 40% chance) or below normal (35 to 40% chance) rainfall is forecast in the west of both islands with near normal rainfall expected in the north of the South Island. Lower than normal air pressure to the west and north of New Zealand during June may bring a few heavier rain events to the north and east of the North Island and perhaps east of the South Island.
June – August 2018 soil moisture levels and river flows are expected to be above normal (45% chance) in the north of the North Island. For the east of the North Island and north and west of the South Island, soil moisture levels and river flows are forecast to be near normal (40-50% chance). For the west of the North Island, soil moisture levels and river flows are expected to be above normal or near normal (40-45% chance). For the east of the South Island, soil moisture levels and river flows are expected to be near normal or above normal (35-40% chance).
Regional predictions for the June – August 2018 season
Northland, Auckland, Waikato, Bay of Plenty
The table below shows the probabilities (or percent chances) for each of three categories: above average, near average, and below average. In the absence of any forecast guidance there would be an equal likelihood (33% chance) of the outcome being in any one of the three categories. Forecast information from local and global guidance models is used to indicate the deviation from equal chance expected for the coming three-month period, with the following outcomes the most likely (but not certain) for this region:
- Temperatures are about equally likely to be near average (40% chance) or above average (35% chance).
- Rainfall totals are about equally likely to be above normal (40% chance) or near normal (35% chance).
- Soil moisture levels and river flows are most likely to be in the above normal range (45% chance).
The full probability breakdown is:
|
Temperature |
Rainfall |
Soil moisture |
River flows |
|
|
Above average |
35 |
40 |
45 |
45 |
|
Near average |
40 |
35 |
35 |
35 |
|
Below average |
25 |
25 |
20 |
20 |
Central North Island, Taranaki, Whanganui, Manawatu, Wellington
Probabilities are assigned in three categories: above average, near average, and below average.
- Temperatures are about equally likely to be near average (40% chance) or above average (35% chance).
- Rainfall totals are about equally likely to be near normal (40% chance) or below normal (35% chance).
- Soil moisture levels are about equally likely to be in the above normal (45% chance) or near normal range (40% chance).
- River flows are most likely to be in the near normal range (45% chance).
The full probability breakdown is:
|
Temperature |
Rainfall |
Soil moisture |
River flows |
|
|
Above average |
35 |
25 |
45 |
35 |
|
Near average |
40 |
40 |
40 |
45 |
|
Below average |
25 |
35 |
15 |
20 |
Gisborne, Hawke’s Bay, Wairarapa
Probabilities are assigned in three categories: above average, near average, and below average.
- Temperatures are most likely to be near average (40% chance).
- Rainfall totals are about equally likely to be near normal (40% chance) or above normal (35% chance).
- Soil moisture levels and river flows are most likely to be in the near normal range (50% chance).
The full probability breakdown is:
|
Temperature |
Rainfall |
Soil moisture |
River flows |
|
|
Above average |
30 |
35 |
20 |
20 |
|
Near average |
40 |
40 |
50 |
50 |
|
Below average |
30 |
25 |
30 |
30 |
Tasman, Nelson, Marlborough, Buller
Probabilities are assigned in three categories: above average, near average, and below average.
- Temperatures are most likely to be near average (40% chance).
- Rainfall totals are most likely to be near normal (40% chance).
- Soil moisture levels and river flows are most likely to be in the near normal range (45% chance).
The full probability breakdown is:
|
Temperature |
Rainfall |
Soil moisture |
River flows |
|
|
Above average |
30 |
30 |
35 |
35 |
|
Near average |
40 |
40 |
45 |
45 |
|
Below average |
30 |
30 |
20 |
20 |
West Coast, Alps and foothills, inland Otago, Southland
Probabilities are assigned in three categories: above average, near average, and below average.
- Temperatures are most likely to be near average (40% chance).
- Rainfall totals are about equally likely to be below normal (40% chance) or near normal (35% chance)
- Soil moisture levels and river flows are most likely to be in the near normal range (40% chance).
The full probability breakdown is:
|
Temperature |
Rainfall |
Soil moisture |
River flows |
|
|
Above average |
30 |
25 |
30 |
30 |
|
Near average |
40 |
35 |
40 |
40 |
|
Below average |
30 |
40 |
30 |
30 |
Coastal Canterbury, east Otago
Probabilities are assigned in three categories: above average, near average, and below average.
- Temperatures are about equally likely to be near average (40% chance) or below average (35% chance).
- Rainfall totals, soil moisture levels, and river flows are about about equally likely to be normal (40% chance) or above normal (35% chance).
The full probability breakdown is:
|
Temperature |
Rainfall |
Soil moisture |
River flows |
|
|
Above average |
25 |
35 |
35 |
35 |
|
Near average |
40 |
40 |
40 |
40 |
|
Below average |
35 |
25 |
25 |
25 |
Graphical representation of the regional probabilities
Background
Sea surface temperatures (SSTs) in the central and eastern equatorial Pacific Ocean continued to warm during May. The monthly NINO3.4 Index was 0.01°C (up from -0.33°C last month), the monthly NINO3 Index was 0.21°C (was -0.20°C last month), and the monthly NINO4 Index was +0.28°C (was +0.02°C last month). The NINO1+2 Index has seen significant variability over the past several months and is slightly below normal as of late May.
In the subsurface ocean, (within the first 150 metres of the ocean) positive temperature anomalies extend from the western Pacific (near 160oE) to the South American coast. Significant positive anomalies (> +3.0oC) have now persisted in the central Pacific (170-150oW), centred at about 125-150m depth, for the third consecutive month while another area warmer than +3.0oC developed around 50m depth in the eastern Pacific between 130-95oW.
The warming subsurface occurred in response to multiple downwelling Kelvin waves during March and April, one a result of a westerly wind burst during late March and another during late April. However, as of late May, the pattern of reduced trade winds or westerly winds near the equator had eased and dynamical model guidance indicated a return of enhanced easterlies at times during June. This change in trade winds is likely to be temporary.
The SOI has gradually decreased over the last 3 months and is currently neutral with a preliminary value of +0.3 for May 2018.
April and May 2018 rainfall and convection anomalies in the tropical Pacific were significantly different than the preceding two months. Convective forcing became favoured over the western Indian Ocean and Africa, a stark change from the La Niña-driven pattern (of convective forcing in the West Pacific) during early 2018. As a result, the ENSO Precipitation Index (ESPI) continued its upward trend during May (-0.11 for the last 30 days to the 28th of May), after posting a value of -0.43 for April and -1.1 for March.
During May, the Intertropical Convergence Zone remained north of its climatological position in the central Pacific and the South Pacific Convergence Zone was poorly defined.
The analysis of several atmospheric and oceanic indicators showed that the climate system remained in an ENSO-neutral state during May 2018. The presence of warmer than average subsurface ocean waters in the Pacific, warming NINO indices, and convective anomalies that lean in the direction of El Niño may indicate the direction of the system for later in 2018. In the meantime, ENSO-neutral is expected to continue over the next several months (67% chance over June – August 2018). The forecast models then favour El Niño conditions during the late winter and spring (August – October 2018).
All dynamical and statistical models monitored by NIWA favour neutral (+/-) conditions over the next three months (June – August 2018).
SSTs within New Zealand’s immediate coastal waters continued to decrease during May and are now near or slightly above average. According to the dynamical models’ forecasts, near average SSTs are expected in New Zealand coastal waters during the next 3 months (June-August 2018).
In the absence of large-scale climate drivers and near-average regional SSTs, forecast predictability outside of the tropics, including New Zealand, may be lower than normal over the coming three month period.
Contacts
Chris Brandolino, Principal Scientist – Forecasting, NIWA National Climate Centre Tel (09) 375 6335
Dr Brett Mullan, Principal Scientist, NIWA National Climate Centre Tel (04) 386 0508
Notes to reporters and editors
- NIWA’s outlooks indicate the likelihood of climate conditions being at, above, or below average for the season as a whole. They are not ‘weather forecasts’. It is not possible to forecast precise weather conditions three months ahead of time.
- The outlooks are the result of the expert judgment of NIWA’s climate scientists. They take into account observations of atmospheric and ocean conditions and output from global and local climate models. The presence of El Niño or La Niña conditions and the sea surface temperatures around New Zealand can be a useful indicator of likely overall climate conditions for a season.
- The outlooks state the probability for above average conditions, near average conditions, and below average conditions for rainfall, temperature, soil moisture, and river flows. For example, for winter (June–July–August) 2007, for all the North Island, we assigned the following probabilities for temperature: · Above average: 60 per cent · Near average: 30 per cent · Below average: 10 per cent We therefore concluded that above average temperatures were very likely.
- This three-way probability means that a random choice would be correct only 33 per cent (or one-third) of the time. It would be like randomly throwing a dart at a board divided into three equal parts, or throwing a dice with three numbers on it. An analogy with coin tossing (a two-way probability) is not correct.
- A 50 per cent ‘hit rate’ is substantially better than guesswork, and comparable with the skill level of the best overseas climate outlooks. See, for example, analysis of global outlooks issued by the International Research Institute for Climate and Society based in the US published in the Bulletin of the American Meteorological Society (Goddard, L., A. G. Barnston, and S. J. Mason, 2003: Evaluation of the IRI’s “net assessment” seasonal climate forecasts 1997–2001. Bull. Amer. Meteor. Soc., 84, 1761–1781).
- Each month, NIWA publishes an analysis of how well its outlooks perform. This is available online and is sent to about 3500 recipients of NIWA’s newsletters, including many farmers.
- All outlooks are for the three months as a whole. There will inevitably be wet and dry days, and hot and cold days, within a season. The exact range in temperature and rainfall within each of the three categories varies with location and season. However, as a guide, the “near average” or middle category for the temperature predictions includes deviations up to ±0.5°C for the long-term mean, whereas for rainfall the “near normal” category lies between approximately 80 per cent and 115 per cent of the long-term mean.
- The seasonal climate outlooks are an output of a scientific research programme, supplemented by NIWA’s Capability Funding. NIWA does not have a government contract to produce these outlooks.
- Where probabilities are within 5% of one another, the term “about equally” is used.