Overview
The tropical Pacific remained in an ENSO (El Niño – Southern Oscillation) neutral state (neither El Niño nor La Niña) during June 2017, but oceanic and atmospheric anomalies were mixed, with some indicators leaning towards El Niño and others towards La Niña. Across the equatorial Pacific Ocean, sea surface temperatures (SSTs) are currently slightly above normal. The large-scale atmospheric circulation continues to generally reflect ENSO-neutral conditions, but is showing conflicting signals: the Southern Oscillation Index (SOI) is currently negative (i.e. leaning towards El Niño), with a value of -1.0 for June 2017, but large-scale rainfall and convection anomalies are showing La Niña-like patterns, with more intense than normal convection and rainfall over large parts of the Maritime Continent.
International guidance – in contrast to previous months – now suggests that the tropical Pacific Ocean is more likely to remain in an ENSO neutral state (60% chance) than to transition towards El Niño (35% chance) over the next three month period (July – September 2017). The probability for El Niño increases only slightly later during the year, with a maximum of 43% over the October-December 2017 period. Chances for La Niña development remain low (less than 15%).
For July – September 2017 as a whole, the atmospheric circulation around New Zealand is forecast to be characterised by slightly higher than normal pressures southeast of the Chatham Islands, leading to weak easterly-quarter flow anomalies over the country.
NIWA Forecaster Chris Brandolino presents the latest region-by-region look at expected temperature and rainfall conditions across New Zealand through to September.
Regional predictions for the July – September 2017 season
Northland, Auckland, Waikato, Bay of Plenty
The table below shows the probabilities (or percent chances) for each of three categories: above average, near average, and below average. In the absence of any forecast guidance there would be an equal likelihood (33% chance) of the outcome being in any one of the three categories. Forecast information from local and global guidance models is used to indicate the deviation from equal chance expected for the coming three month period, with the following outcomes the most likely (but not certain) for this region:
- Temperatures are very likely to be above average (60% chance).
- Rainfall totals are most likely to be in the near normal range (50% chance).
- Soil moisture levels are equally likely to be near normal (35% chance) or below normal (35% chance), and river flows are about equally to be near normal (40% chance) or below normal (35% chance).
The full probability breakdown is:
|
Temperature |
Rainfall |
Soil moisture |
River flows |
|
|
Above average |
60 |
25 |
30 |
25 |
|
Near average |
30 |
50 |
35 |
40 |
|
Below average |
10 |
25 |
35 |
35 |
Central North Island, Taranaki, Whanganui, Manawatu, Wellington
Probabilities are assigned in three categories: above average, near average, and below average.
- Temperatures are about equally likely to be above average (45% chance) or near average (40% chance).
- Rainfall totals, soil moisture levels and river flows are all most likely to be in the near normal range (45-50% chance).
The full probability breakdown is:
|
Temperature |
Rainfall |
Soil moisture |
River flows |
|
|
Above average |
45 |
25 |
30 |
25 |
|
Near average |
40 |
50 |
45 |
45 |
|
Below average |
15 |
25 |
25 |
30 |
Gisborne, Hawke’s Bay, Wairarapa
Probabilities are assigned in three categories: above average, near average, and below average.
- Temperatures are about equally likely to be above average (45% chance) or near average (40% chance).
- Rainfall totals are about equally likely to be near normal (40% chance) or above normal (35% chance) .
- Soil moisture levels and river flows are equally likely to be near normal (35% chance) or above normal (35% chance).
The full probability breakdown is:
|
Temperature |
Rainfall |
Soil moisture |
River flows |
|
|
Above average |
45 |
35 |
35 |
35 |
|
Near average |
40 |
40 |
35 |
35 |
|
Below average |
15 |
25 |
30 |
30 |
Tasman, Nelson, Marlborough, Buller
Probabilities are assigned in three categories: above average, near average, and below average.
- Temperatures are very likely to be above average (70% chance).
- Rainfall totals are most likely to be near normal (40% chance).
- Soil moisture levels and river flows are about equally likely to be near normal (40% chance) or below normal (35% chance).
The full probability breakdown is:
|
Temperature |
Rainfall |
Soil moisture |
River flows |
|
|
Above average |
70 |
30 |
25 |
25 |
|
Near average |
20 |
40 |
40 |
40 |
|
Below average |
10 |
30 |
35 |
35 |
West Coast, Alps and foothills, inland Otago, Southland
Probabilities are assigned in three categories: above average, near average, and below average.
- Temperatures are very likely to be above average (70% chance).
- Rainfall totals are most likely to be in the near normal range (45% chance).
- Soil moisture levels and river flows are most likely to be in the below normal range (50% chance).
The full probability breakdown is:
|
Temperature |
Rainfall |
Soil moisture |
River flows |
|
|
Above average |
70 |
20 |
20 |
20 |
|
Near average |
20 |
45 |
30 |
30 |
|
Below average |
10 |
35 |
50 |
50 |
Coastal Canterbury, east Otago
Probabilities are assigned in three categories: above average, near average, and below average.
- Temperatures are very likely to be above average (70% chance).
- Rainfall totals are most likely to be in the near normal range (40% chance).
- Soil moisture levels and river flows are about equally likely to be in the near normal (40% chance) or below normal (35% chance) range.
The full probability breakdown is:
|
Temperature |
Rainfall |
Soil moisture |
River flows |
|
|
Above average |
70 |
30 |
25 |
25 |
|
Near average |
20 |
40 |
40 |
40 |
|
Below average |
10 |
30 |
35 |
35 |
Background
ENSO (El Niño – Southern Oscillation) neutral conditions persisted across the tropical Pacific overall during June 2017, but oceanic and atmospheric anomalies were mixed, with some indicators leaning towards El Niño, and others towards La Niña.
Across the equatorial Pacific Ocean, sea surface temperatures (SSTs) are slightly above normal, with an anomaly of +0.5oC in the NINO3.4 region (in the central Pacific) for the month of June (on the El Niño side of neutral). Overall, SSTs in the whole tropical Pacific Ocean (between about 30oN and 30oS) are currently close to or slightly above normal.
Positive subsurface temperature anomalies along the equator in the first 100 meters or so of the Ocean have remained mostly stable or weakened slightly during June 2017. In the central Pacific (between about 170oW and 140oW), these warmer than normal waters overlay a cooler than normal layer, observed at a depth of about 150m, and these negative anomalies have intensified during June 2017, in places now exceeding about -3oC.
The preliminary [value estimated on the 30th of June] Southern Oscillation Index (SOI) for the month of June 2017 is negative at -1.0, indicating borderline El Niño conditions. Note, however, that the SOI has shown significant intra-seasonal variability over the past few months; it is thus far from certain that negative SOI values will persist.
Zonal wind anomalies along the equator were close to zero during June and generally large-scale circulation patterns are consistent with an ENSO-neutral state. However, rainfall and convection anomalies in the tropical Pacific are still more typical of La Niña conditions; in particular, more intense than normal convection and rainfall was observed over large parts of the Maritime Continent. Accordingly, the ENSO Precipitation Index (ESPI) is significantly negative with a value of -2.2 (indicating La Niña state).
In contrast to the ENSO outlooks issued in previous months, international guidance now indicates that the tropical Pacific Ocean is more likely to remain in an overall ENSO-neutral state (60% chance) than to transition towards El Niño (35% chance) over the next three months (July – September 2017). The probability for El Niño increases only slightly later this year, with a maximum of 43% over the October-December 2017 period. Chances for La Niña remain low (less than 15%) through to the end of the year.
Coastal waters remain generally warmer than average all around the country, with anomalies exceeding +0.5oC along the west coast of the South Island. However, in the last two weeks, SSTs have trended slightly cooler near the North Island. The anomaly in the “NZ box” (160°E-170°W, 30-45°S) is currently reaching about +0.5oC. Ocean waters are still much warmer than average in the southern part of the Tasman Sea, off the east coast of Tasmania and southeast Australia, with anomalies exceeding +3oC in place.
The dynamical models’ forecasts indicate that warmer than average SSTs around New Zealand are likely to persist or intensify over the July – September 2017 period.
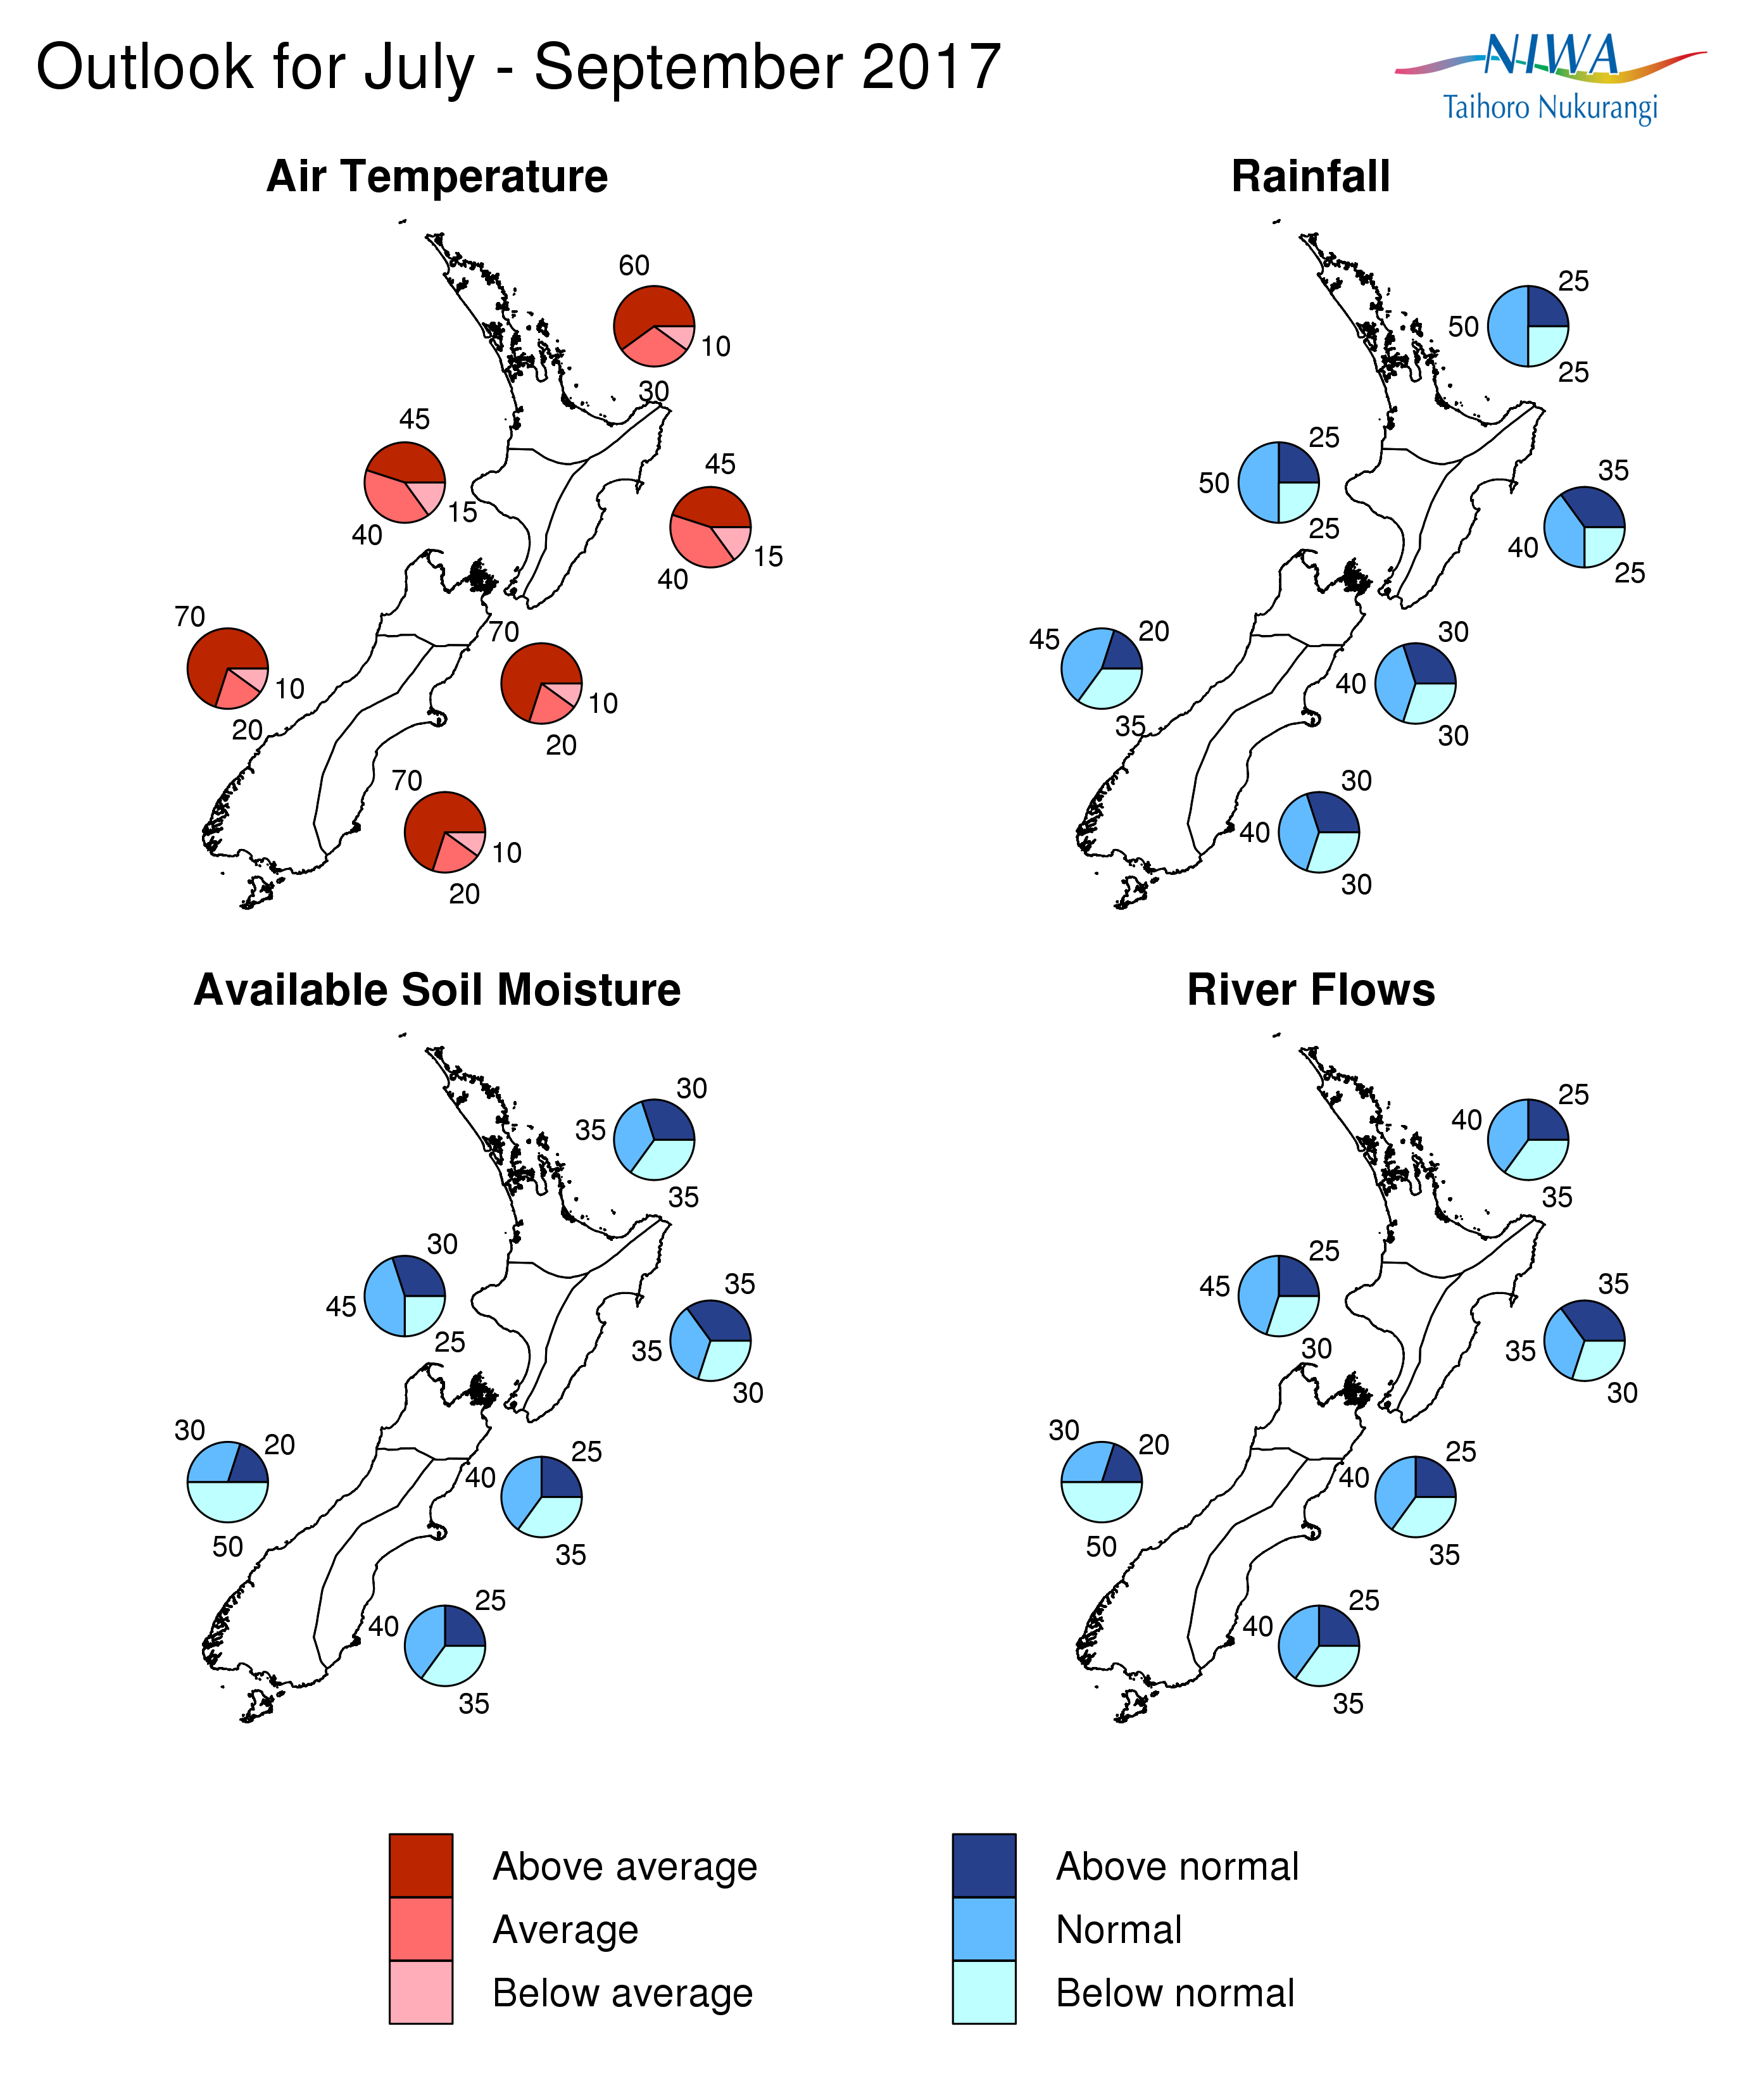
Graphical representation of the regional probabilities
For comment, please contact
Chris Brandolino, Principal Scientist – Forecasting, NIWA National Climate Centre
Tel (09) 375 6335, Mobile (027) 886 0014
Dr Brett Mullan, Principal Scientist, NIWA National Climate Centre
Tel (04) 386 0508, Mobile (027) 294 1169
Notes to reporters and editors
- NIWA’s outlooks indicate the likelihood of climate conditions being at, above, or below average for the season as a whole. They are not ‘weather forecasts’. It is not possible to forecast precise weather conditions three months ahead of time.
- The outlooks are the result of the expert judgment of NIWA’s climate scientists. They take into account observations of atmospheric and ocean conditions and output from global and local climate models. The presence of El Niño or La Niña conditions and the sea surface temperatures around New Zealand can be a useful indicator of likely overall climate conditions for a season.
- The outlooks state the probability for above average conditions, near average conditions, and below average conditions for rainfall, temperature, soil moisture, and river flows. For example, for winter (June–July–August) 2007, for all the North Island, we assigned the following probabilities for temperature: · Above average: 60 per cent · Near average: 30 per cent · Below average: 10 per cent We therefore concluded that above average temperatures were very likely.
- This three-way probability means that a random choice would be correct only 33 per cent (or one-third) of the time. It would be like randomly throwing a dart at a board divided into three equal parts, or throwing a dice with three numbers on it. An analogy with coin tossing (a two-way probability) is not correct.
- A 50 per cent ‘hit rate’ is substantially better than guesswork, and comparable with the skill level of the best overseas climate outlooks. See, for example, analysis of global outlooks issued by the International Research Institute for Climate and Society based in the US published in the Bulletin of the American Meteorological Society (Goddard, L., A. G. Barnston, and S. J. Mason, 2003: Evaluation of the IRI’s “net assessment” seasonal climate forecasts 1997–2001. Bull. Amer. Meteor. Soc., 84, 1761–1781).
- Each month, NIWA publishes an analysis of how well its outlooks perform. This is sent to about 3500 recipients of NIWA’s newsletters, including many farmers.
- All outlooks are for the three months as a whole. There will inevitably be wet and dry days, and hot and cold days, within a season. The exact range in temperature and rainfall within each of the three categories varies with location and season. However, as a guide, the “near average” or middle category for the temperature predictions includes deviations up to ±0.5°C for the long-term mean, whereas for rainfall the “near normal” category lies between approximately 80 per cent and 115 per cent of the long-term mean.
- The seasonal climate outlooks are an output of a scientific research programme, supplemented by NIWA’s Capability Funding. NIWA does not have a government contract to produce these outlooks.
- Where probabilities are within 5% of one another, the term “about equally” is used.