Outlook Summary
- The November 2018 – January 2019 atmospheric circulation around New Zealand is forecast to be characterised by higher pressure than normal around the country and lower pressure than normal to the southwest.
- Frequent high pressure systems are expected around and over the country during November. For the three month period (November 2018 – January 2019) as a whole, westerly quarter air flow anomalies are expected, though periodic easterly quarter air flows are possible.
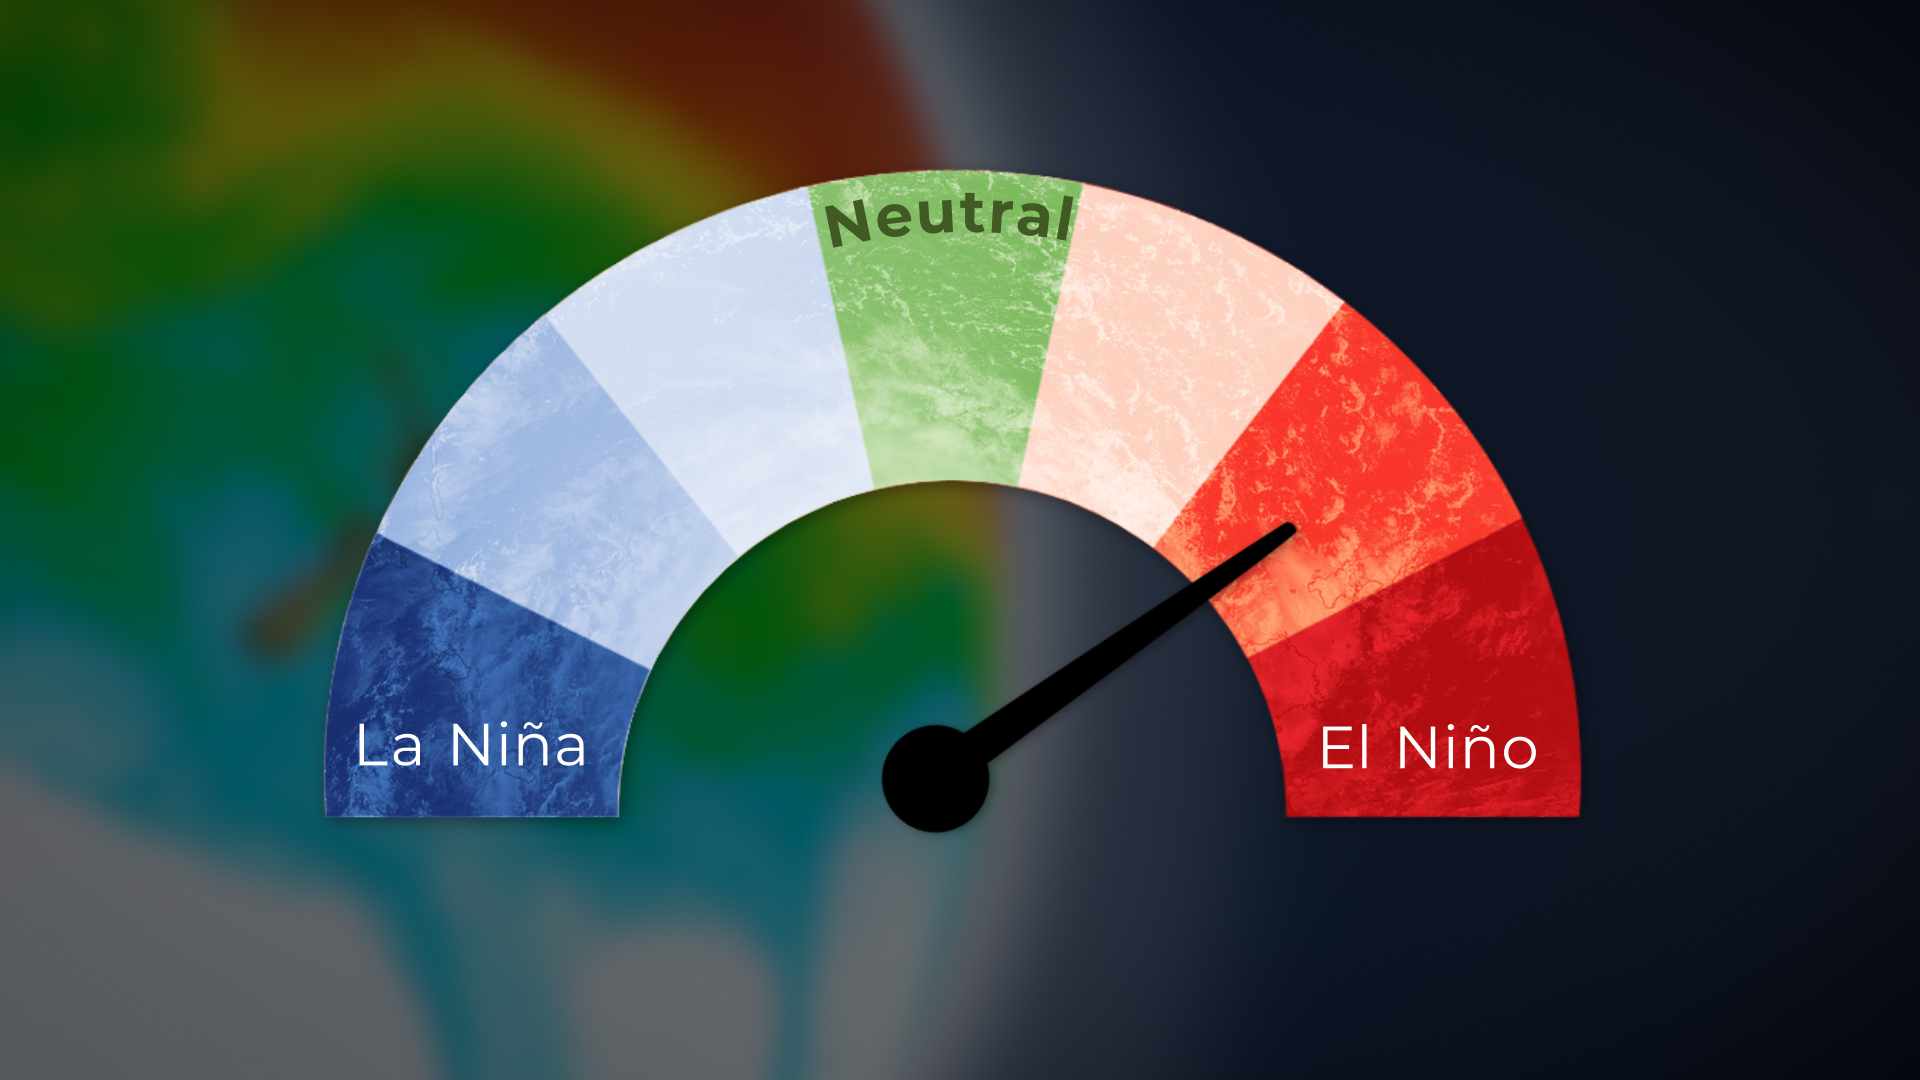
- The ocean made significant strides toward El Niño conditions during October 2018. The expectation is for non-traditional El Niño conditions to develop with a 88% chance over November – January 2019.
- The circulation pattern is expected to be associated with above average or near average temperatures for New Zealand, including several very warm spells during November.
- Below normal or near normal rainfall is forecast for most regions of New Zealand.
- Above average or near average sea surface temperatures (SSTs) are expected in New Zealand coastal waters during the next three months.
- For the current tropical cyclone season (November 2018 to April 2019), NIWA’s Southwest Pacific Tropical Cyclone Outlook indicates that the risk for New Zealand is near normal. On average, at least one ex-tropical cyclone passes within 550km of New Zealand each year. Significant rainfall, damaging winds, and coastal damage can occur during these events.
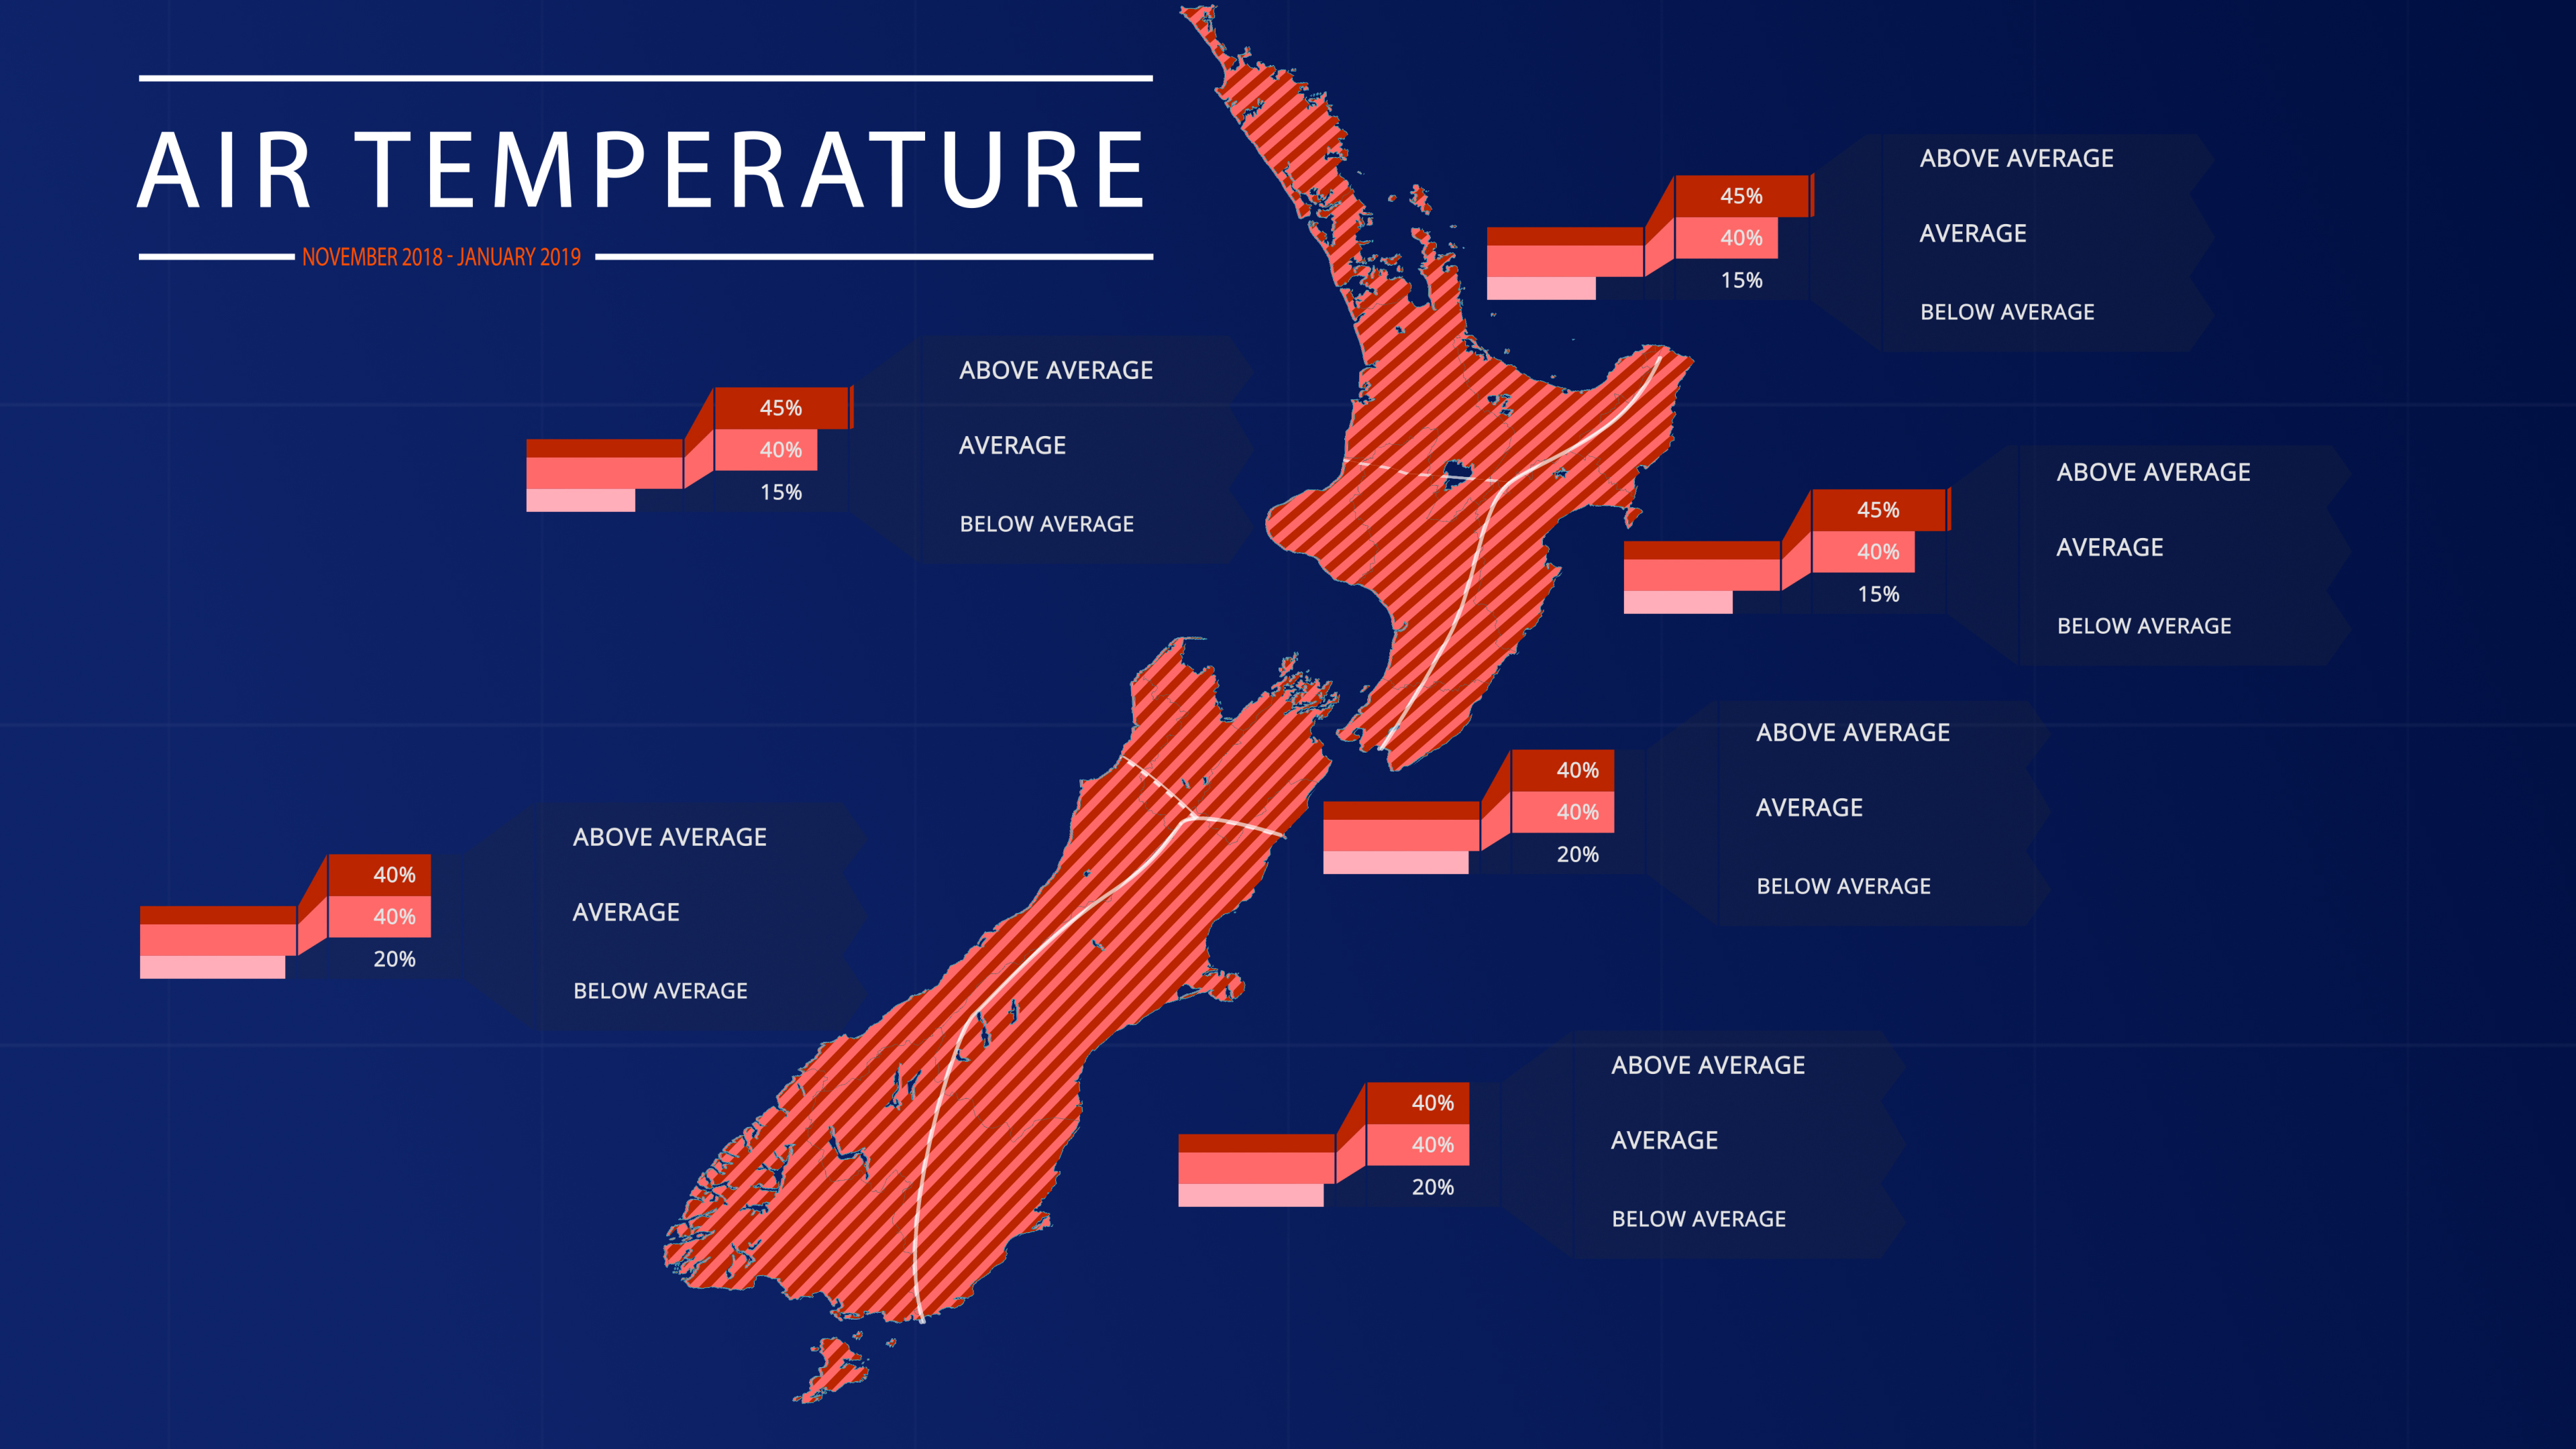
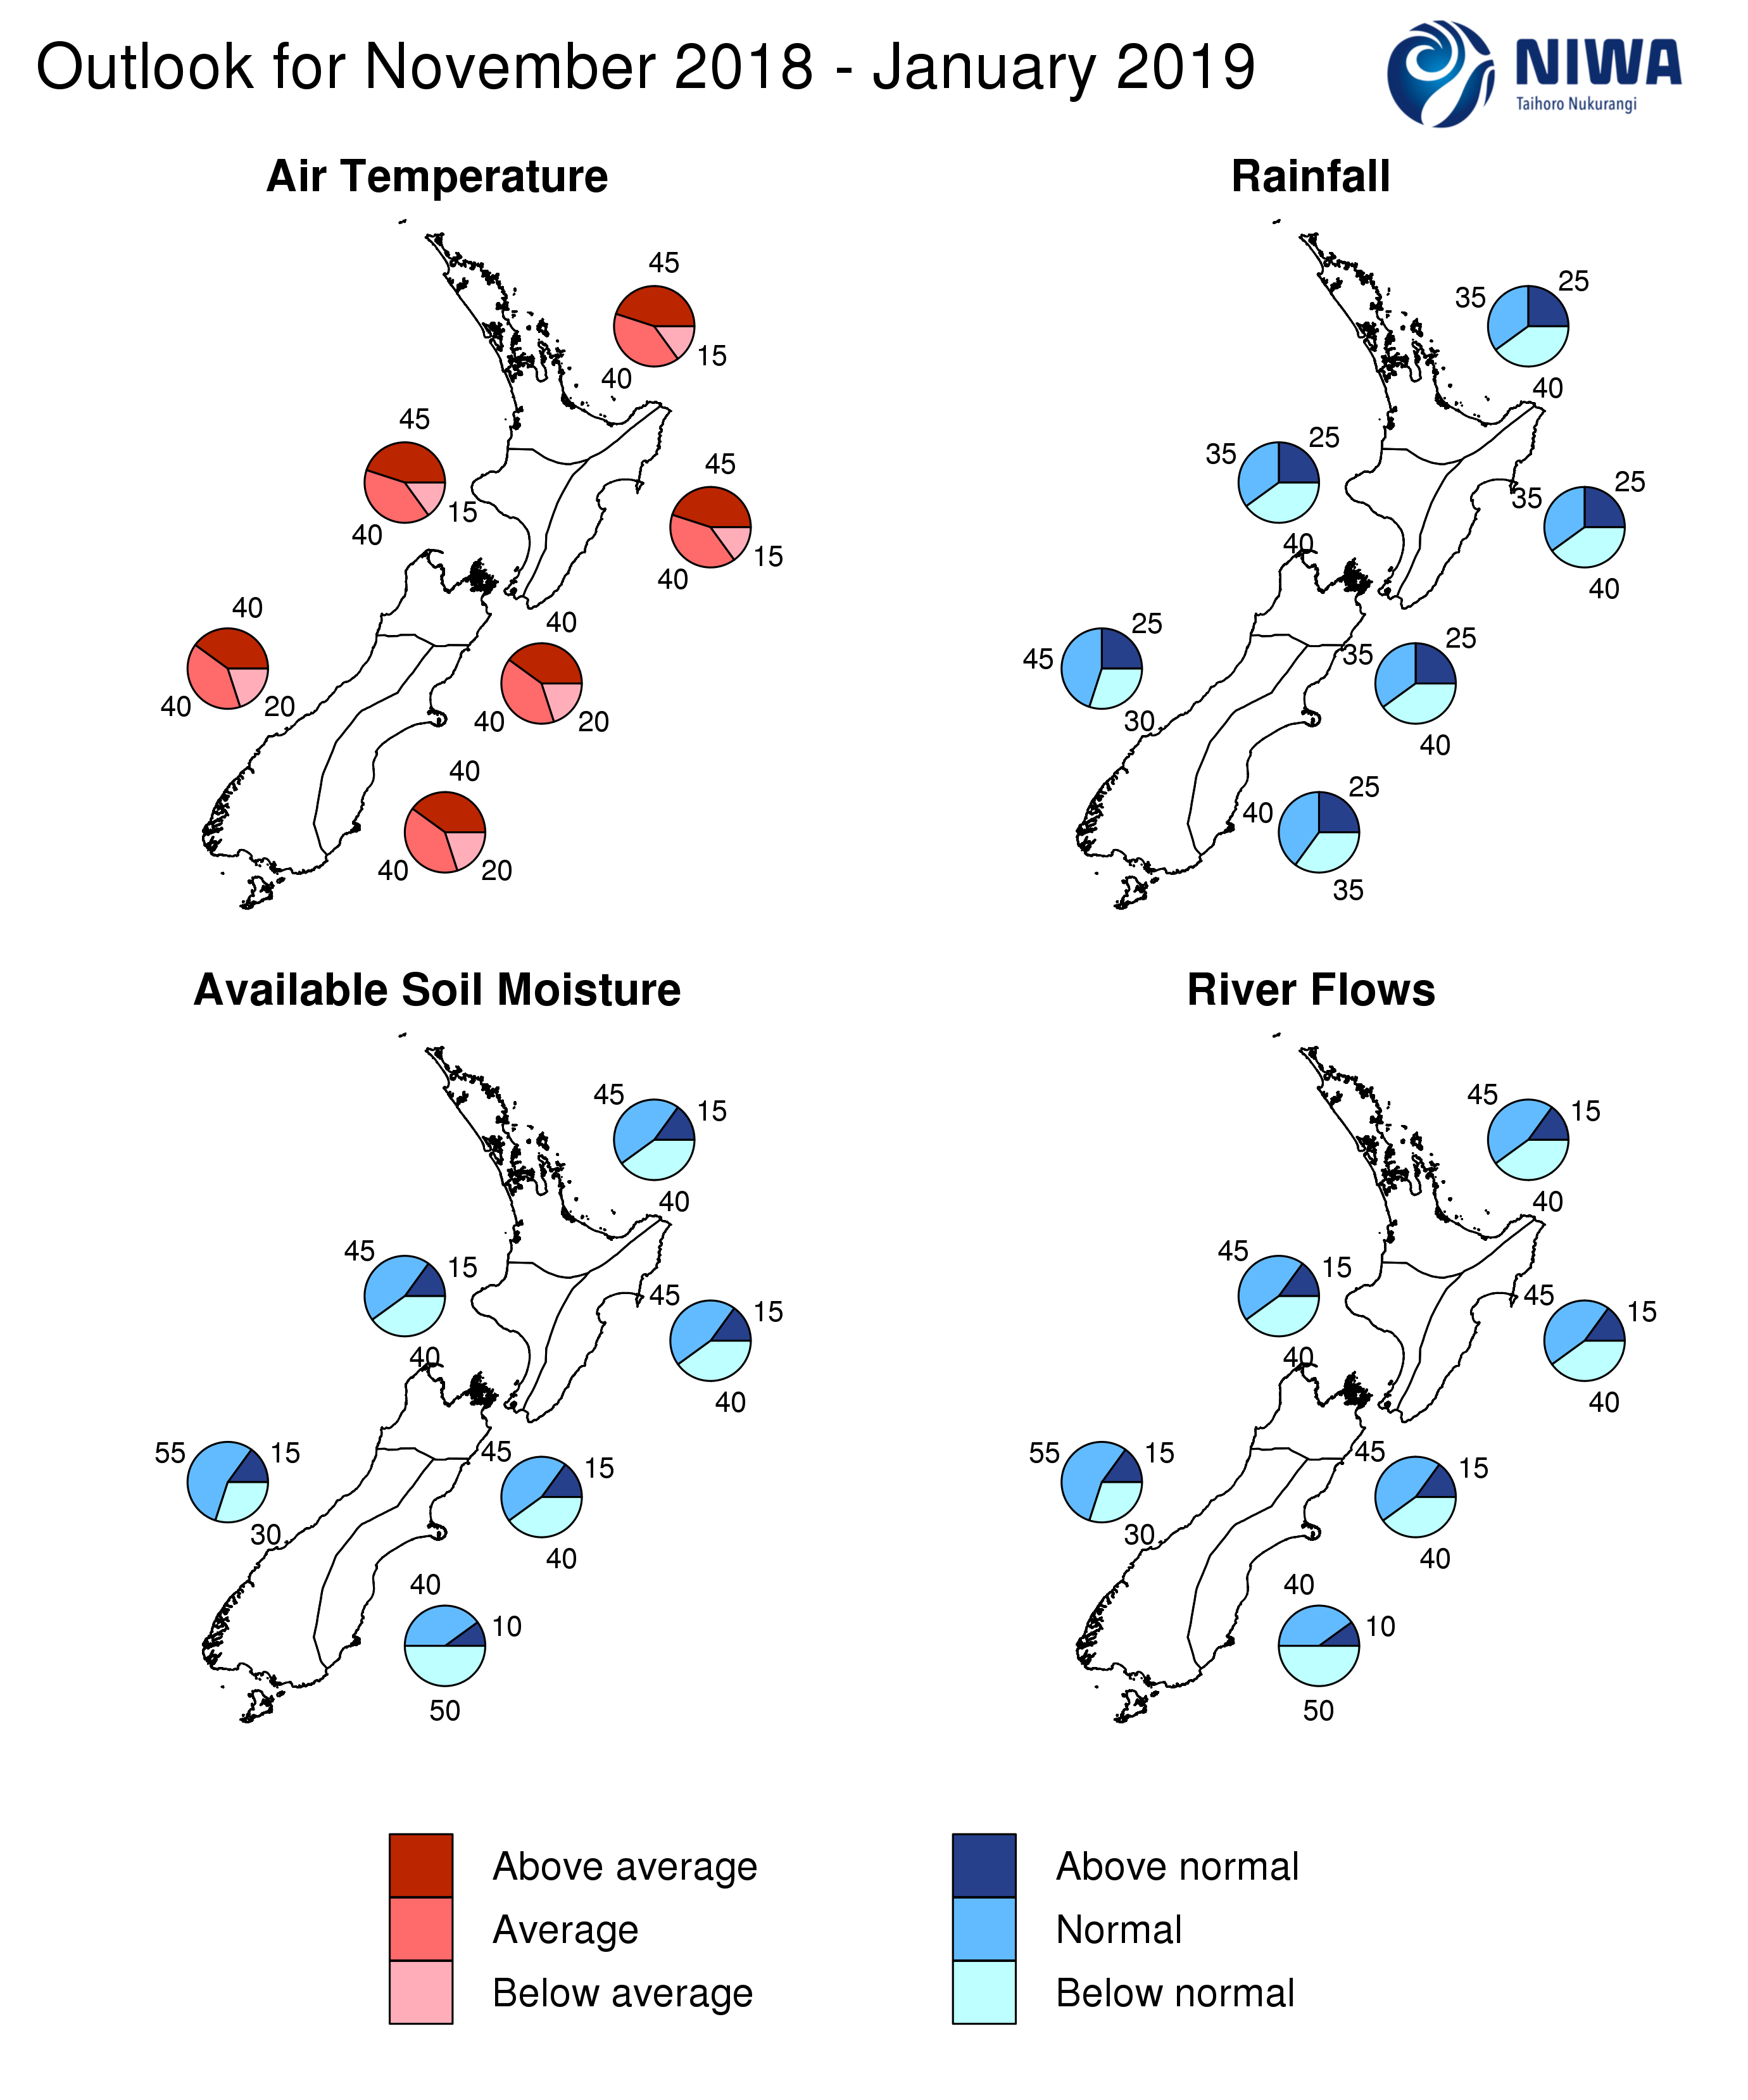
November 2018 – January 2019 temperatures are forecast to be above average (40-45% chance) or near average (40% chance) for all regions of New Zealand.
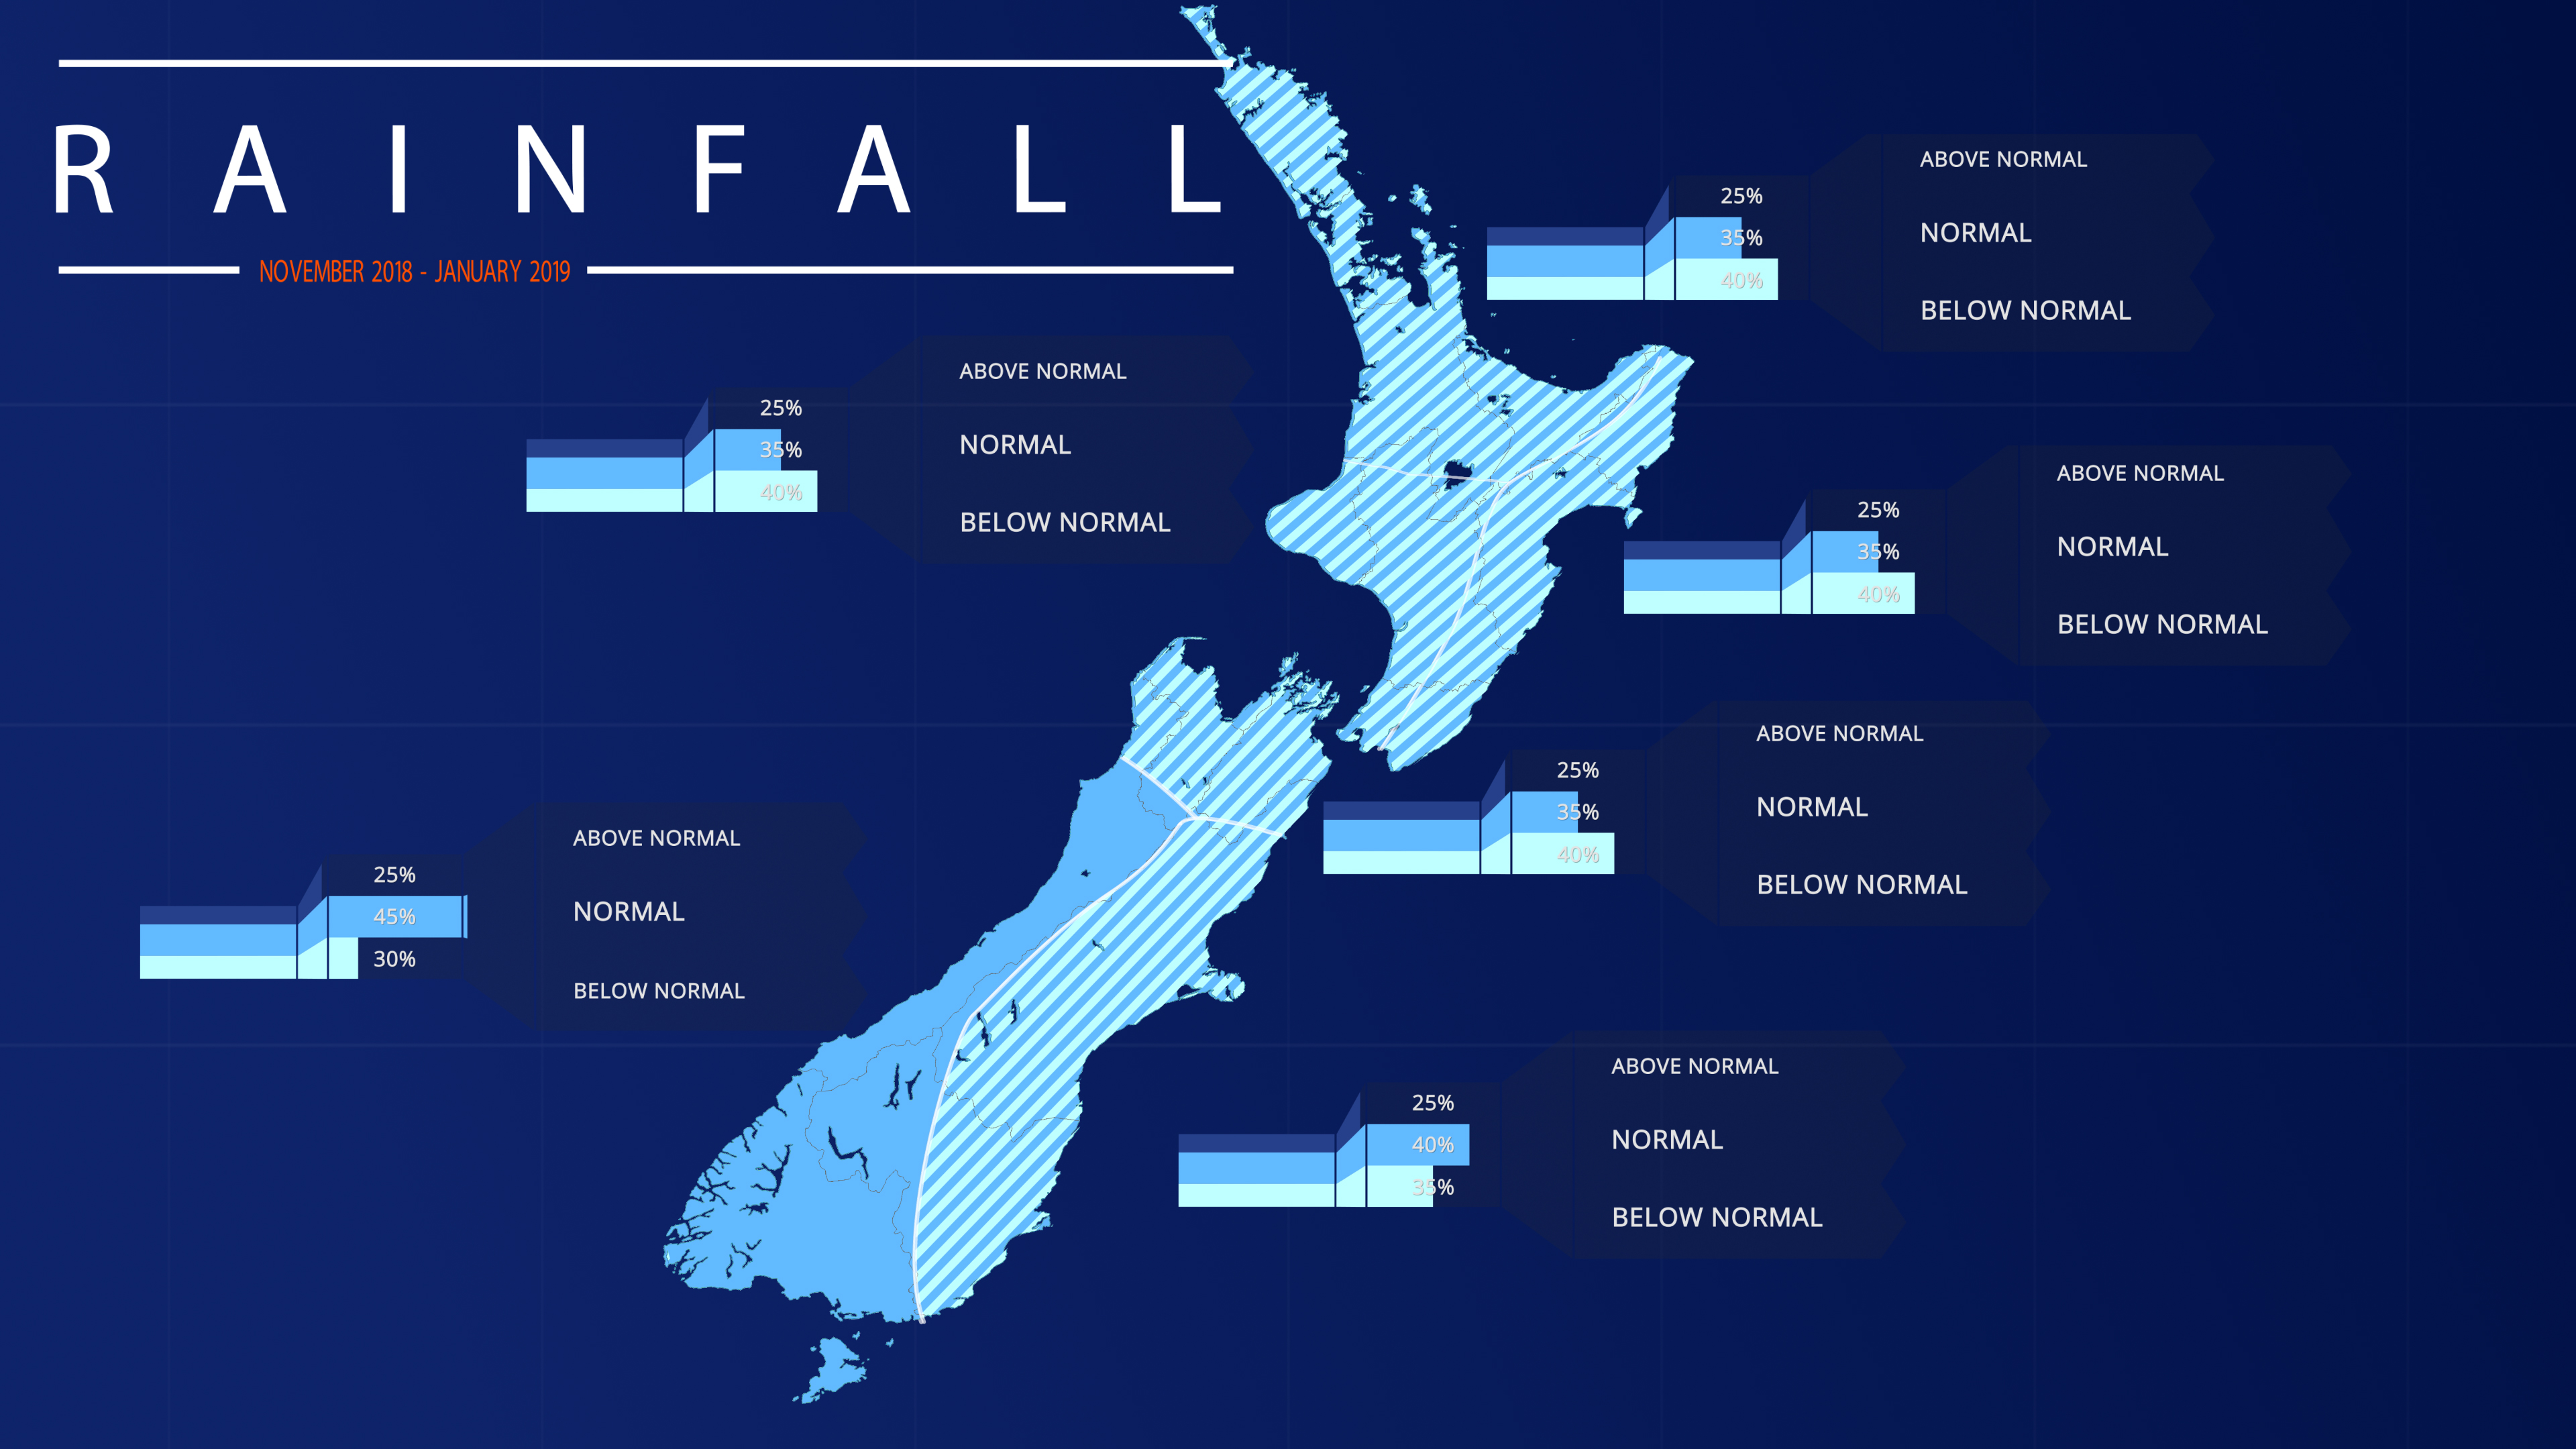
November 2018 – January 2019 rainfall totals are forecast to be below normal (35-40% chance) or near normal (35-40%) for all regions of New Zealand except for the west of the South Island where near normal rainfall is most likely (45% chance).
November 2018 – January 2019 soil moisture levels and river flows are forecast to be near normal (45% chance) or below normal (40%) for the North Island and north of the South Island. For the west of the South Island, near normal (55% chance) soil moisture levels and river flows are forecast. For the east of the South Island, below normal (50% chance) soil moisture levels are river flows are forecast.
Regional predictions for the November 2018 – January 2019 season
Northland, Auckland, Waikato, Bay of Plenty
The table below shows the probabilities (or percent chances) for each of three categories: above average, near average, and below average. In the absence of any forecast guidance there would be an equal likelihood (33% chance) of the outcome being in any one of the three categories. Forecast information from local and global guidance models is used to indicate the deviation from equal chance expected for the coming three-month period, with the following outcomes the most likely (but not certain) for this region:
- Temperatures are about equally likely to be above average (45% chance) or near average (40% chance).
- Rainfall totals are about equally likely to be below normal (40% chance) or near normal (35% chance).
- Soil moisture levels and river flows are about equally likely to be near normal (45% chance) or below normal (40% chance).
The full probability breakdown is:
|
Temperature |
Rainfall |
Soil moisture |
River flows |
|
|
Above average |
45 |
25 |
15 |
15 |
|
Near average |
40 |
35 |
45 |
45 |
|
Below average |
15 |
40 |
40 |
40 |
Central North Island, Taranaki, Whanganui, Manawatu, Wellington
Probabilities are assigned in three categories: above average, near average, and below average.
- Temperatures are about equally likely to be above average (45% chance) or near average (40% chance).
- Rainfall totals are about equally likely to be below normal (40% chance) or near normal (35% chance).
- Soil moisture levels and river flows are about equally likely to be near normal (45% chance) or below normal (40% chance).
The full probability breakdown is:
|
Temperature |
Rainfall |
Soil moisture |
River flows |
|
|
Above average |
45 |
25 |
15 |
15 |
|
Near average |
40 |
35 |
45 |
45 |
|
Below average |
15 |
40 |
40 |
40 |
Gisborne, Hawke’s Bay, Wairarapa
Probabilities are assigned in three categories: above average, near average, and below average.
- Temperatures are about equally likely to be above average (45% chance) or near average (40% chance).
- Rainfall totals are about equally likely to be below normal (40% chance) or near normal (35% chance).
- Soil moisture levels and river flows are about equally likely to be near normal (45% chance) or below normal (40% chance).
The full probability breakdown is:
|
Temperature |
Rainfall |
Soil moisture |
River flows |
|
|
Above average |
45 |
25 |
15 |
15 |
|
Near average |
40 |
35 |
45 |
45 |
|
Below average |
15 |
40 |
40 |
40 |
Tasman, Nelson, Marlborough, Buller
Probabilities are assigned in three categories: above average, near average, and below average.
- Temperatures are equally likely to be above average (40% chance) or near average (40%).
- Rainfall totals are about equally likely to be below normal (40% chance) or near normal (35% chance).
- Soil moisture levels and river flows are about equally likely to be near normal (45% chance) or below normal (40% chance).
The full probability breakdown is:
|
Temperature |
Rainfall |
Soil moisture |
River flows |
|
|
Above average |
40 |
25 |
15 |
15 |
|
Near average |
40 |
35 |
45 |
45 |
|
Below average |
20 |
40 |
40 |
40 |
West Coast, Alps and foothills, inland Otago, Southland
Probabilities are assigned in three categories: above average, near average, and below average.
- Temperatures are equally likely to be above average (40% chance) or near average (40%).
- Rainfall totals are most likely to be in the near normal range (45%).
- Soil moisture levels and river flows are most likely to be near normal (55% chance).
The full probability breakdown is:
|
Temperature |
Rainfall |
Soil moisture |
River flows |
|
|
Above average |
40 |
25 |
15 |
15 |
|
Near average |
40 |
45 |
55 |
55 |
|
Below average |
20 |
30 |
30 |
30 |
Coastal Canterbury, east Otago
Probabilities are assigned in three categories: above average, near average, and below average.
- Temperatures are equally likely to be above average (40% chance) or near average (40%).
- Rainfall totals are about equally likely to be near normal (40% chance) or below normal (35% chance).
- Soil moisture levels and river flows are most likely to be below normal (50% chance).
The full probability breakdown is:
|
Temperature |
Rainfall |
Soil moisture |
River flows |
|
|
Above average |
40 |
25 |
10 |
10 |
|
Near average |
40 |
40 |
40 |
40 |
|
Below average |
20 |
35 |
50 |
50 |
Graphical representation of the regional probabilities
Background
The Southern Oscillation Index (SOI) was slightly positive with a value of +0.2 for October 2018, following negative values during August and September.
Sea surface temperatures (SSTs) in the central Pacific (NINO3.4 Index) warmed notably over the past month, increasing from an anomaly of +0.25oC in September to +0.75oC in October. The anomaly value for October exceeded what international centres consider necessary for the onset of El Niño conditions. The NINO1+2 Index in the eastern Pacific (near South America) continued to show significant variability. This pattern of SST anomalies continues to be consistent with the expected development of El Niño ‘Modoki’, a non-conventional type where the maximum SST anomaly is located in the central Pacific rather than the eastern Pacific.
The impact on New Zealand’s weather patterns may differ from what is typically experienced during a conventional El Niño event.
Warmer than average subsurface ocean waters strengthened and expanded eastward during October. Anomalies of +3.0oC and above now cover a wide area from the Dateline to 100oW at 150m depth in the west and 50m depth in the east. This is associated with large upper-ocean heat content anomalies (+1.5 to 2.0oC), spanning from near the Dateline to about 110oW.
During October, trade winds were weaker than normal across much of the tropical Pacific.
Convective forcing was suppressed over much of the central and western Pacific, which is one metric that goes against the grain of El Niño.Instead, enhanced convection over the Western Hemisphere and Africa occurred as the result of an intraseasonal variation known as the Madden-Julian Oscillation (MJO).
The consensus from international models is for the tropical Pacific to transition towards El Niño over the next three-month period (88% chance over November 2018 – January 2019). The probability for El Niño remains high through autumn 2019, with a 88% chance for El Niño conditions over the March – May 2019 period, with some long-range models indicating the possibility of the event continuing through next winter in the Southern Hemisphere (a protracted El Niño event).
New Zealand coastal waters warmed to above average during October. The most anomalous SSTs were found near the eastern South Island (+0.95oC) and the northern North Island (+0.75oC).
The expectation for warmer than average air temperatures during November will likely result in the continuation of warmer than average SSTs for at least the start of the coming three month period. Thereafter, dynamical models suggest that SSTs are likely to remain above average or near average into the summer season.
Download
Seasonal Climate Outlook - November 2018 - January 2019 [PDF 3MB]
Contact:
Chris Brandolino, Principal Scientist – Forecasting, NIWA National Climate Centre Tel (09) 375 6335, Mobile (027) 886 0014
Dr Brett Mullan, Principal Scientist, NIWA National Climate Centre Tel (04) 386 0508, Mobile (027) 294 1169