Southwest Pacific Tropical Cyclone Outlook: Near-normal tropical cyclone activity overall during November-April, but increased east and reduced west of the Date Line; multiple severe tropical cyclones expected
Forecasters indicate another seven to 11 named tropical cyclones (TC) could occur in the Southwest Pacific basin between November and April, following the very early TC Liua that formed in September.
Analysis by forecasting centres across the Southwest Pacific show tropical cyclone activity is expected to be lower than normal around the northern and eastern Coral Sea margin and elevated east of the International Date Line.
New Caledonia, Fiji, Vanuatu and Tonga may experience two or more cyclones during the season. Three or four severe cyclones reaching Category 3 or higher are expected anywhere across the region during the season, which starts next month and officially lasts until the end of April.
On average, at least one ex-tropical cyclone passes within 550km of New Zealand each year. For the coming season, the risk for an ex-tropical cyclone New Zealand is considered near normal. If an ex-tropical cyclone comes close to the country, it has equal probability of passing east or west of Auckland and the North Island. Significant rainfall, extreme winds, hazardous marine conditions and coastal damage can occur leading up to and during these events.
Oceanic and atmospheric forecasts for ENSO (El Niño-Southern Oscillation) indicate El Niño conditions may develop by summer. At present, sea surface temperature anomalies across the central and eastern equatorial Pacific Ocean and atmospheric circulation patterns over French Polynesia and northern Australia indicate conditions bordering ENSO-neutral or leaning toward El Niño. It is worth noting that if El Niño develops it may be of the El Niño-Modoki (central Pacific based) flavour during early summer.
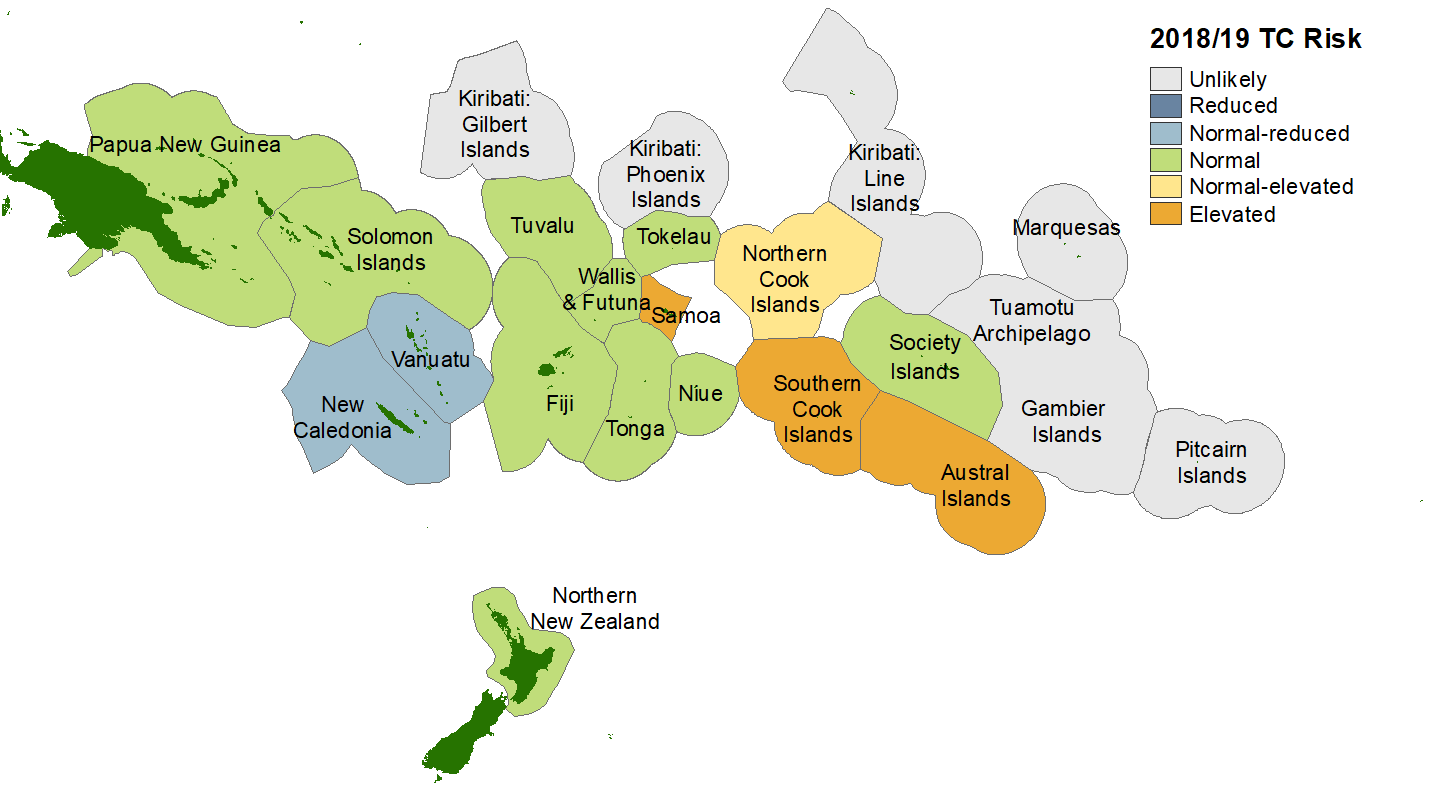
Islands on the fringe of the northern and eastern Coral Sea, including the Solomon Islands, Vanuatu, and New Caledonia may experience slightly decreased tropical cyclone activity. Increased TC activity is expected in some islands east of the International Date Line, especially those east of 160°W longitude, including Samoa, the Cook Islands, and the Austral Islands.
Tropical cyclones are categorised in strength from 1 to 5, with 5 being the most intense. For the coming season, about four storms are anticipated to reach at least Category 3 strength, with mean wind speeds of at least 118 km/h winds. Past years with conditions similar to present suggest some of these storm systems may increase to at least Category 4 strength, with mean wind speeds of 159 km/h. Category 5 strength cyclones, where winds are greater than 196 km/h, have occurred during years with similar conditions ahead of the 2018/19 season (known as ‘analogue’ seasons). Therefore, all communities should remain alert and well-prepared for severe events.
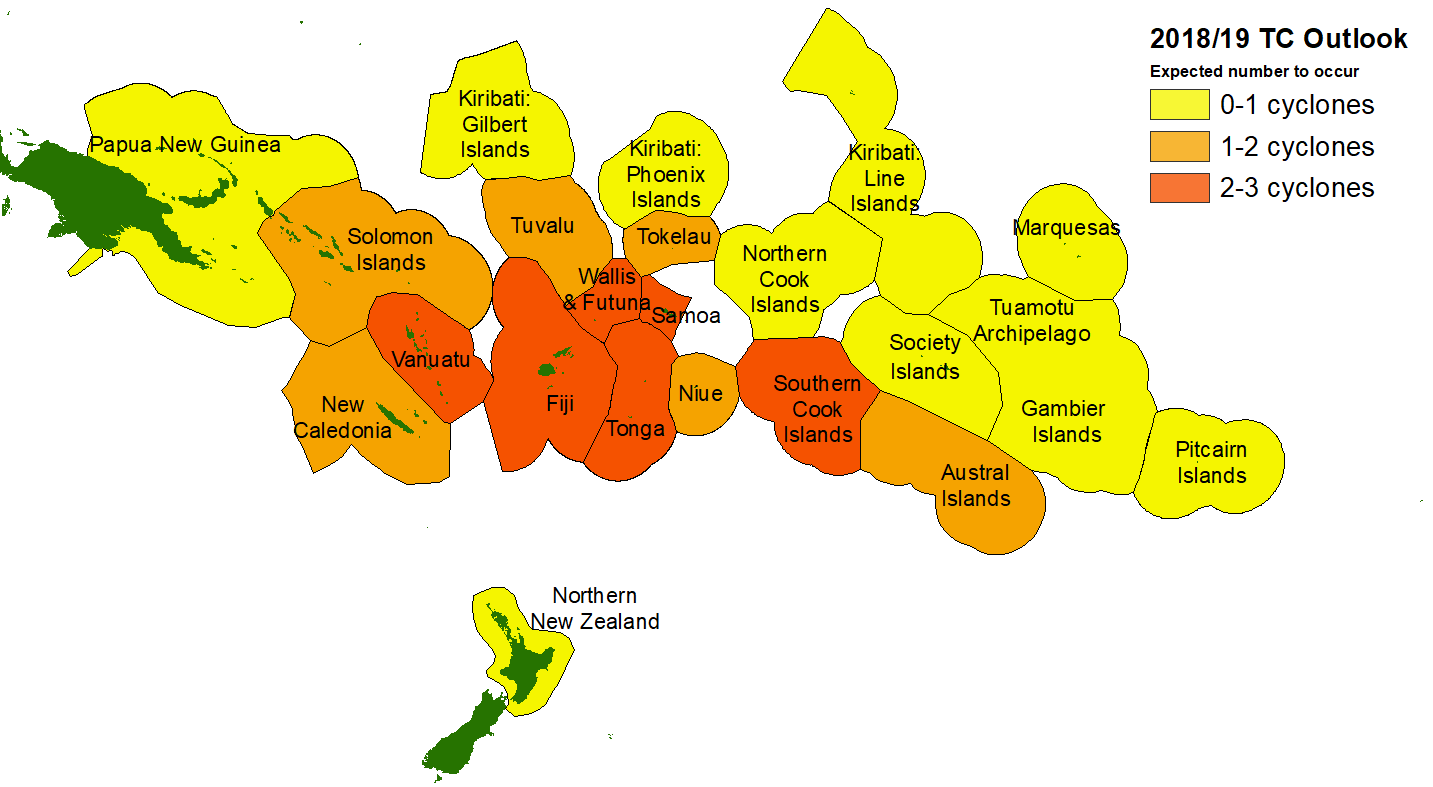
Tropical cyclones have a significant impact across the Southwest Pacific. Vanuatu and New Caledonia typically experience the greatest activity, with an average of two or three named cyclones passing close to land each year. For this season, the Southern Cook Islands and Samoa may experience 2-3 named cyclones, which is higher than average for those islands.
New Zealand should also be vigilant. During some analogue seasons used in the preparation of this outlook, multiple ex-tropical cyclones passed within 550 km of the country (including one during the early season prior to February). Significant wind, waves and rainfall are possible from these systems. Their effects can be spread over a larger area, particularly if the ex-tropical cyclone interacts with separate weather systems in the middle latitudes.
Tropical cyclone activity is expected to be slightly reduced for some countries during this season, especially for some islands west of the International Date Line. However, these islands typically experience multiple cyclones per year, and activity for those areas is still expected. All communities, regardless of changes in TC risk, should remain vigilant and be aware if the regional climate situation (including ENSO) changes. As with most years, activity is expected to increase during the second half of the season, from February-April. Early season activity is expected to be near normal.
NIWA, MetService, MeteoFrance, BoM, NOAA and Pacific Island National Meteorological Services will all continue to track the progression of ENSO and TC activity, with an update to this guidance in January 2019 if needed.
It does not take a direct hit or a severe cyclone to cause significant damage or life-threatening weather. When dangerous weather is forecast, please heed the advice of your local civil defence or disaster management offices.
New Zealand’s National Institute of Water & Atmospheric Research (NIWA) and Meteorological Service of New Zealand (MetService) along with contributions from meteorological forecasting organizations from the Southwest Pacific, including the Australian Bureau of Meteorology, MeteoFrance and the Pacific Island National Meteorological Services have prepared this tropical cyclone outlook.
Contacts
In New Zealand:
Mr. Chris Brandolino, Principal Scientist - Forecasting NIWA Tel: +64 9 375 6335
Mr. Chris Noble, Manager, Specialist Weather Services TCWC (Tropical Cyclone Warning Centre) Wellington MetService New Zealand Tel: +64 4 470 1175
Mrs. Elke Louw, Manager, Marine Weather Services Wellington RSMC (Regional Specialized Meteorological Centre) MetService New Zealand Tel: +64 4 470 0737
Mr. Ben Noll, Meteorologist NIWA Tel: +64 9 375 6334
In the Pacific Islands, please contact your local national meteorological service for information about how this guidance should be interpreted.
For Australia and associated offshore islands, please contact the Australian Bureau of Meteorology for information about how this guidance should be interpreted.
For French Polynesia, Wallis, Futuna and New Caledonia, please contact MeteoFrance regional offices for information about how this guidance should be interpreted.
Additional background information
Modern analogue guidance
TCs in the Southwest Pacific usually develop between November and April, but occasionally they can occur in October and May, very rarely in June – August. An analysis of past TC tracks in the SW Pacific indicate they are exceptionally unlikely in September; however, this year Tropical Cyclone Liua formed “out of season” near the Solomon Islands on 26 September. TC Liua is the first named TC on record that has formed during September, but historic tropical storms strong enough to have been tracked are also noted for this month (the last one having occurred in 1950).
Peak TC season is usually from January to March. In seasons with similar background climate conditions to the present, TC activity was elevated in a zone situated east of the International Dateline and in the western Gulf of Carpentaria. In addition, the strongest TC anomalies were focused in the region between Samoa and the Cook Islands, which is associated with a northeast displacement of the South Pacific Convergence Zone (SPCZ) during El Niño events. There is also a small region of increased TC incidence northern Australia and around the Austral Islands. On average, nearly half of the TCs that developed since the 1969-70 season have reached hurricane force with mean wind speeds of at least 64 knots (118 km/h).
To find past analogues that describe the climate state leading into the upcoming TC season, the past May-September conditions were examined for the tropical Pacific from 1969 to the present. For most of winter and early spring 2018, the ENSO system was in an ENSO-neutral state, with some indicators suggesting El Niño might develop. Available information from international forecasting centres that issue global climate forecast model outputs and ENSO diagnostics are integrated by NIWA’s National Climate Centre. The collective guidance suggests El Niño is likely (68% chance) and a weak-to-moderate event is expected develop by early summer. El Niño, if developed, may be of a central Pacific variety (called El Niño Modoki), during the early summer season. As such, an additional element used to select the TC analogue seasons included tracks that occurred when some form of weak-to-moderate El Niño formed or where neutral seasons were reminiscent of weak El Niño during spring and into austral summer.
We used a joint ENSO index that combines the Southern Oscillation Index (SOI) with the most widely-used oceanic index of sea surface temperature anomalies in the equatorial central-western Pacific (NINO3.4). This joint ENSO index is described in Gergis and Fowler (2005) as the “Coupled ENSO Index” (CEI). Using the CEI, we selected analogue TC seasons for the 2018-19 forecast. We highlighted seasons when the equatorial SSTs and the SOI were indicative of a transition from ENSO-neutral conditions to weak or moderate El Niño conditions.
Seven analogue TC seasons (1986/87; 1990/91; 2003/04; 2004/05; 2006/07; 2009/10; 2014/15) typified the antecedent ENSO development and our expectations for the coming season based on international ENSO forecasts. Note that the selection of analogue seasons relates to the high-quality TC data period in the satellite era beginning in 1969/70 (only 48 seasons), the availability of TC track data (current only to the end of the 2017/18 season), and the limited number of similar analogues to this season. As such, the tropical cyclone guidance for November 2018 to April 2019 is built on the seven analogue seasons identified above.
NIWA’s SW Pacific TC outlook spans four areas of responsibility overseen by international monitoring and forecast agencies (RMSC Nadi, TCWC Brisbane, TCWC Port Moresby and TCWC Wellington). We used a high-quality set of past TC tracks from the International Best Tracks Archive for Climate Stewardship (IBTRACS) which covers 135°E to 120°W longitude to draw on past TC track patterns for this seasonal outlook. This region encompasses a basin that is defined by climatology rather than geopolitical or meteorological boundaries (Diamond et al., 2012). Southwest Pacific islands fringing the northern and eastern edge of the Coral Sea, including the Solomon Islands, Vanuatu and New Caledonia are expected to see near normal or reduced activity (Table 1; Figure 2 & 3). Elevated activity is expected for countries east of the International Date Line including Samoa, the Cook Islands, and the Austral Islands. Tuvalu, all other areas are expected to experience normal risk for a TC interaction. The main TC genesis region is expected to lie within a band between 10 – 12°S (north of Vanuatu) to the west of the International Date Line. Most of the analogue seasons we have identified experienced multiple severe cyclones (≥ Category 3), with all but two years having multiple Category 4 and higher tropical cyclones. A total of 9 named storms on average are expected this coming season; the wide range of variation between analogue seasons suggests 7 to 11 may occur for the total TC count (all named storms) within the TC outlook area, which spans the normal range.
Previous TC research has indicated storm track sinuosity increases during El Niños (Philip Malsale, 2011). This means that many tropical cyclone tracks for the coming season may have more wandering trajectories than normal. Past tracks for years like the present tended to cover a zone ranging from a genesis region north of northern Vanuatu, with extra-tropical transition (ETT) east of the International Date Line (mean longitude of ~178°W upon TC exiting the tropics at 25°S). For the historical TC tracks for the selected analogue seasons, there is a very large spread for the location where each system underwent ETT that presents significant uncertainties for maritime navigation risks.
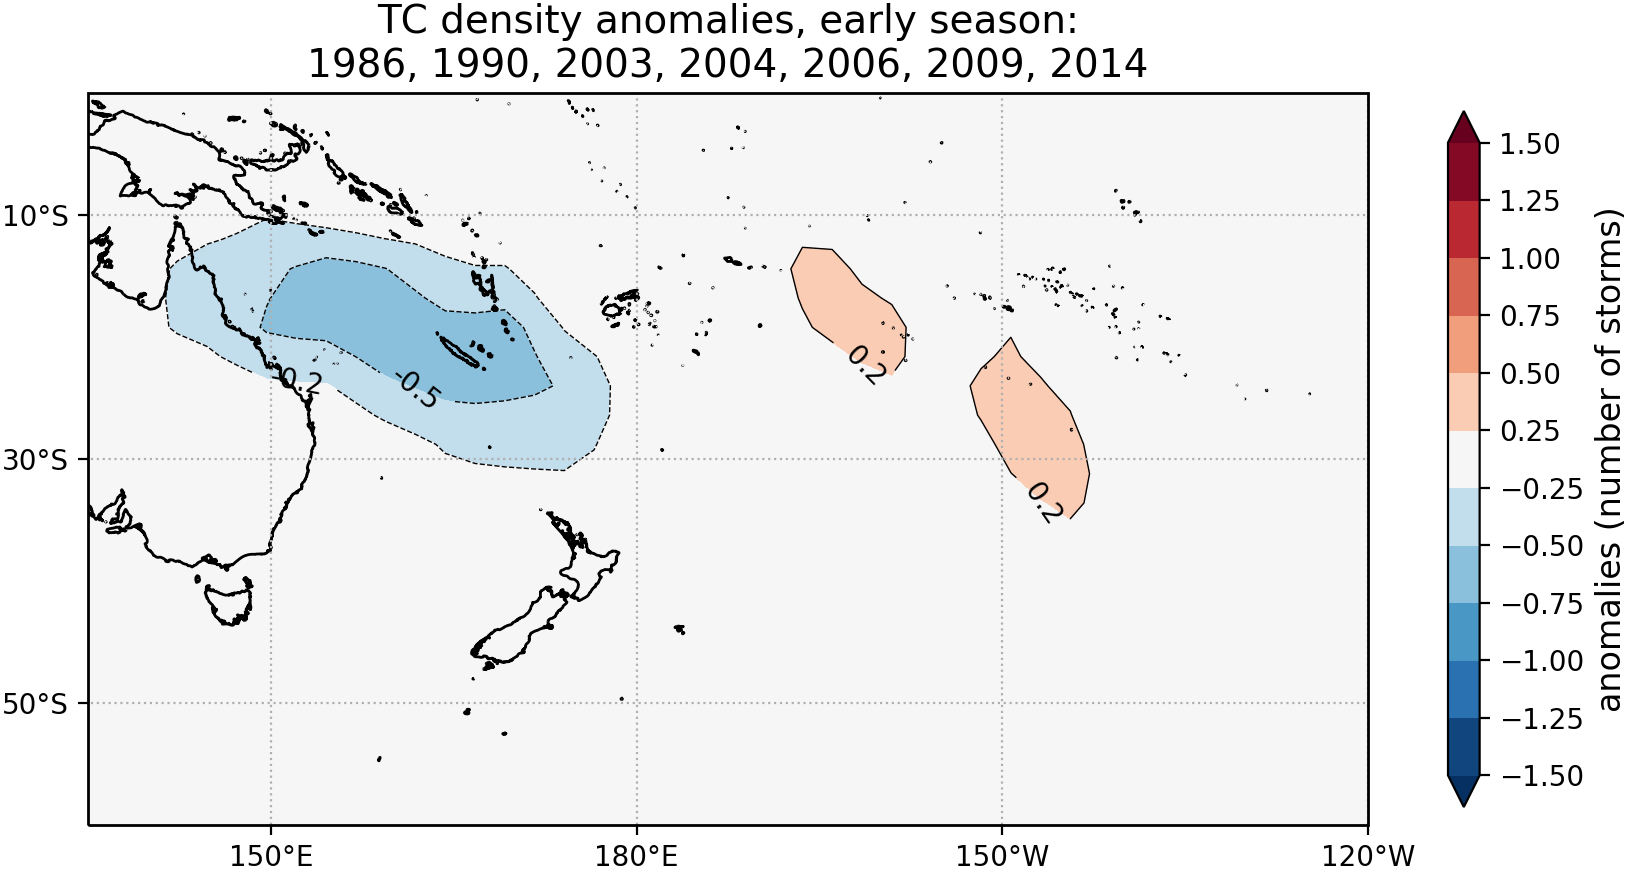
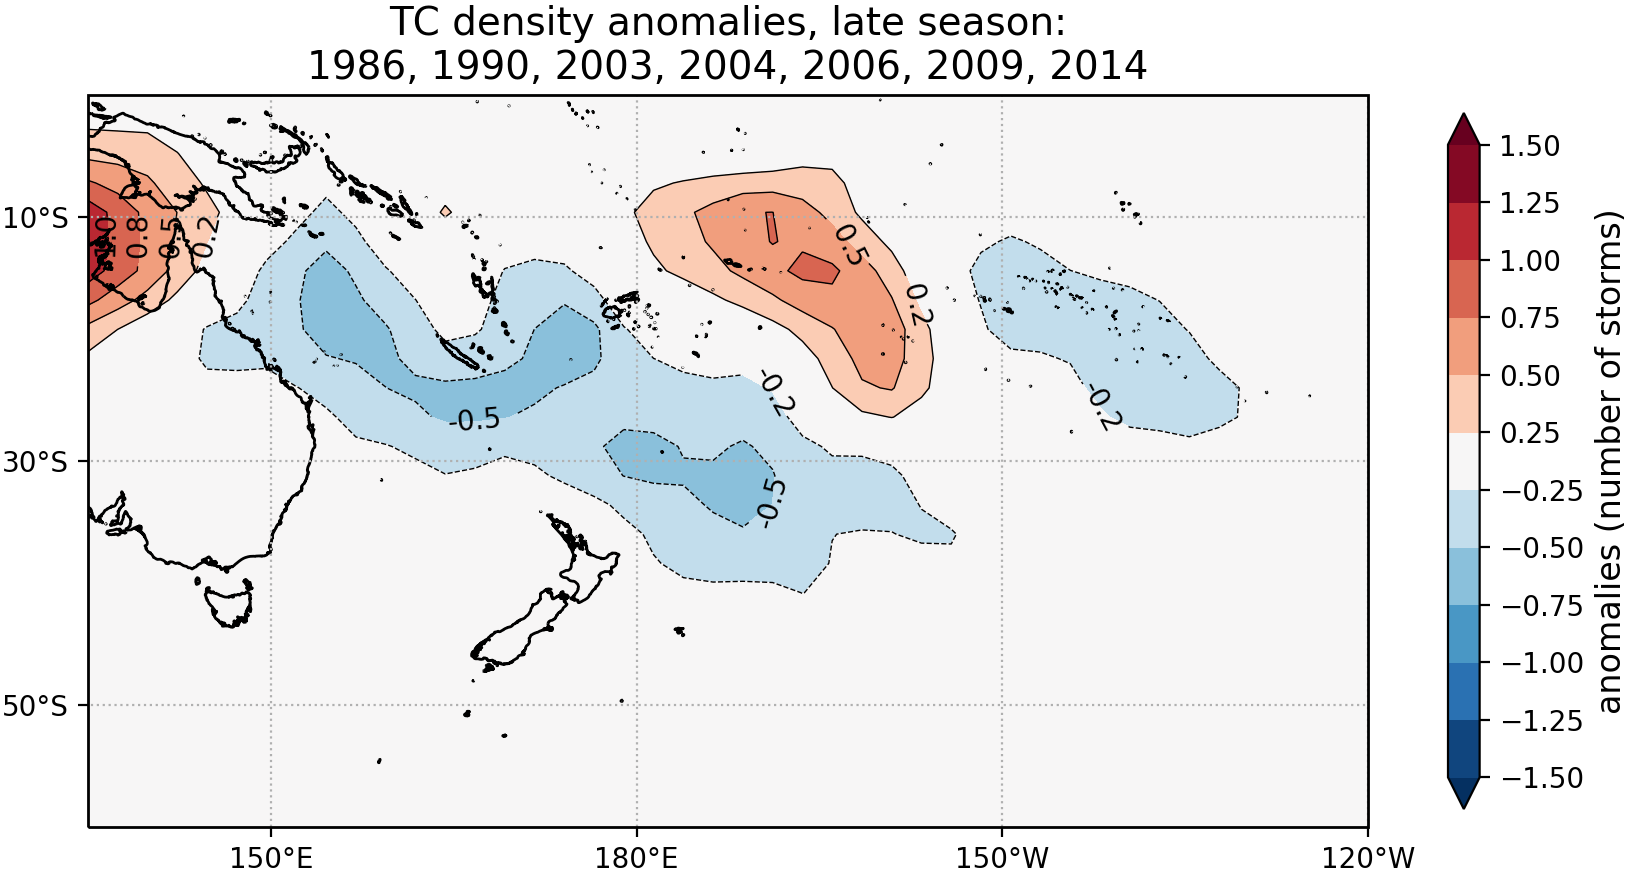
A split of the analogue TC seasons into early (November – January) and late (February – April) periods suggests TC activity will be close to normal for the early part of the TC season (Figure 4). Activity in general is expected to increase east of the International Date Line during the late season. The spatial anomalies for this TC outlook strongly indicate increased risk of storms near Samoa, the Cook Islands and the Austral Islands, while lower-than-normal activity is expected near the southern Solomon Islands, Vanuatu, and New Caledonia.
TC intensity is partly related to how long developing cyclonic systems reside in the tropics and gain support for their growth from underlying warm waters. In addition, the subtropical jet and South Pacific Convergence Zone (SPCZ) mutually interact and contribute to shear during extra-tropical transition. It should also be noted that the interplay of a hemispheric-scale atmospheric circulation with the timing of the short-term Madden-Julian Oscillation (MJO) passage (typically on a 30 to 50-day cycle) has significant bearing on TC activity in the region. Increased and more intense TC activity can be expected during the MJO 6-7 paired phase (Diamond and Renwick, 2015). Real-time monitoring of the MJO is available from the Australian Bureau of Meteorology at http://www.bom.gov.au/climate/mjo/.
Previous work (Lorrey et al., 2014) indicates New Zealand interacts with at least one ex-tropical cyclone passing within 550 km of the country every year. For the coming TC season, the risk for New Zealand is close to normal. If an ex-tropical cyclone passes close to the country, it has an equal probability of passing east (or west) of Auckland city based on the historic tracks selected for this outlook and the expected state of ENSO in the coming season.
Weekly statistical forecasts of TC genesis and TC activity for the SW Pacific basin are produced by MeteoFrance based on phasing of the MJO (Leroy and Wheeler, 2008). This guidance is useful for sub-monthly scale regional tropical cyclone guidance.
Dynamical climate model guidance
There is good agreement between long-range global dynamical climate outlook models that rainfall between November 2018 and April 2019 will be below normal over the Coral Sea. Normal or above normal rainfall is signalled near and east of the Date Line, particularly for the second half of the season.
The European Centre for Medium-Range Weather Forecasts (ECMWF) seasonal TC guidance indicates near average tropical storm frequency in the domain bounded by 160°E-120°W; 4.5 TC’s versus 5.3) for November 2018 through to April 2019. More specifically, ECMWF seasonal guidance indicates below normal tropical storm density over the Coral Sea with a region of enhanced storm density within and north of the Gulf of Carpentaria in the Arafura Sea. For the remainder of the ECMWF forecast domain, near normal tropical storm density is indicated for the majority of the region, with patches of above normal storm density near the Solomon Islands and north of Vanuatu. CFSv2 and CanSIPS models both indicate above average bulk shear in the 850-200 hPa layer for most of the season across a majority of the SW Pacific region.
Cyclone frequency (November 2018 through to April 2019) is forecast to be largely near normal across the SW Pacific, with seasonal accumulated cyclone energy (ACE), a function of tropical cyclone intensity and duration, also forecast to be near normal.
With above average shear forecast, there may be a propensity for poorly defined and weaker tropical cyclones. This is supported by the forecast of near normal seasonal ACE from the ECMWF model. Due to the forecast rainfall anomalies, activity may also be enhanced near and east of the Date Line and reduced west, particularly over the Coral Sea.
Collectively, the guidance from dynamical forecasts supports near average tropical cyclone activity for the Southwest Pacific basin (135°E-120°W) for the 2018/19 tropical cyclone season. This perspective overlaps with the analogue guidance. We also note that during some El Niño events ACE intensity forecasts were not consistent with observations.
Based on the dynamical model guidance, there is a near normal risk that one (1) or more ex-tropical cyclone(s) may pass within 550 km of Auckland this tropical cyclone season.
NB: The ECMWF forecast domain is from 160°E to 120°W. The SW Pacific basin covers 135° to 120°W, thus the SW Pacific forecast generated by NIWA and colleagues extends 25° eastward than the ECMWF forecast domain.
References
Gergis, J., and A. M. Fowler, 2005. Classification of synchronous oceanic and atmospheric El Niño–Southern Oscillation (ENSO) events for palaeoclimate reconstruction. International Journal of Climatology, 25: 1541–1565.
Diamond, H.J., and J.A. Renwick, 2015. The climatological relationship between tropical cyclones in the southwest Pacific and the Madden-Julian Oscillation. International Journal of Climatology, 35: 676-686. doi: 10.1002/joc.4012.
Diamond, H.J., A.M. Lorrey, K.R. Knapp, and D.H. Levinson, 2012. Development of an enhanced tropical cyclone tracks database for the southwest Pacific from 1840-2011. International Journal of Climatology, 32: 2240–2250. doi:10.1002/joc.2412.
Diamond, H.J., A.M. Lorrey, and J.A. Renwick, 2013. A Southwest Pacific tropical cyclone climatology and linkages to the El Niño–Southern Oscillation. Journal of Climate, 26(1): 3-25. doi:10.1175/JCLI-D-12-00077.1.
Leroy, A., and M.C. Wheeler, 2008. Statistical prediction of weekly tropical cyclone activity in the Southern Hemisphere. Monthly Weather Review, 136: 3637-3654.
Lorrey, A.M., G. Griffiths, N. Fauchereau, H.J. Diamond, P.R. Chappell, and J. Renwick, 2014. An ex-tropical cyclone climatology for Auckland, New Zealand. International Journal of Climatology, 34: 1157–1168. doi: 10.1002/joc.3753.
Malsale, P. 2011. Analysis of tropical cyclone track sinuosity in the South Pacific region using ARCGIS. Unpublished MSc Thesis, University of the South Pacific, 155 Pages.
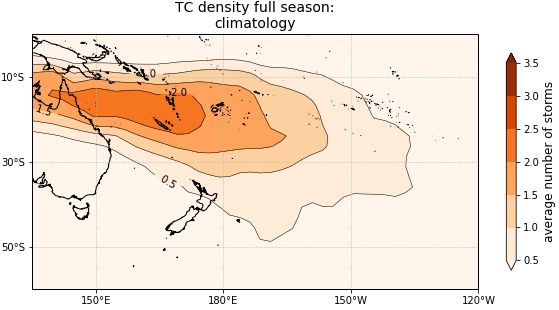
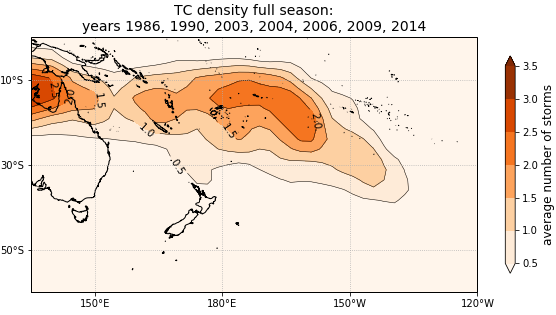
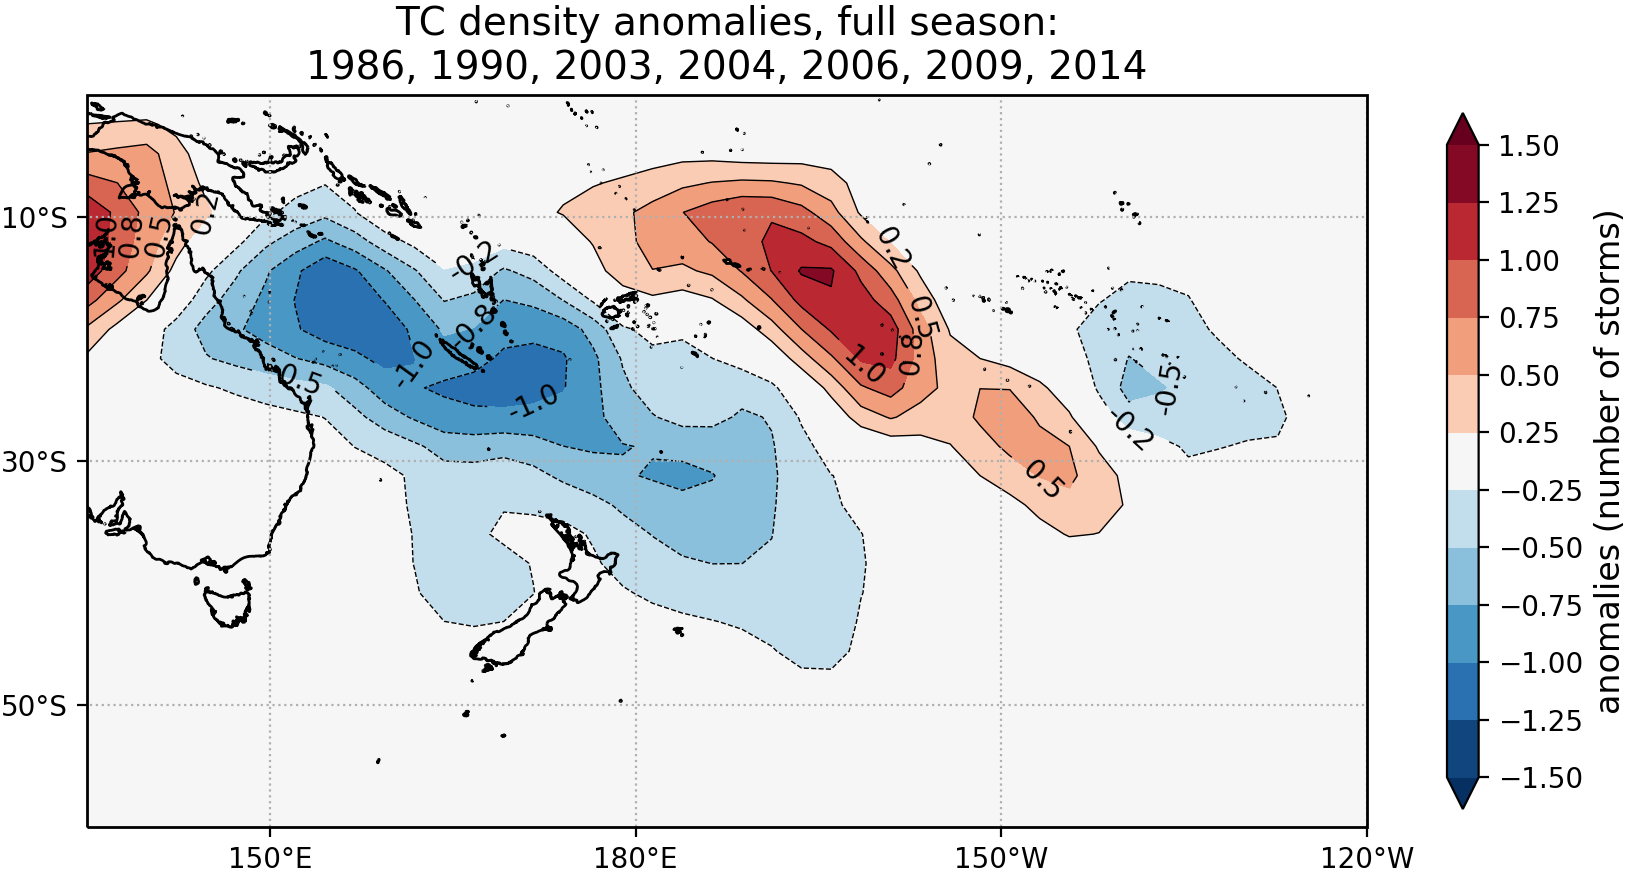
Number of TCs occurring for the main development season (November – April) in the Southwest Pacific (135°E to 120°W): (top panel) average number during 1981 to 2010 (normal); (centre panel) average number over selected five analogue seasons (Table 1); (bottom panel) departure from normal for the analogue seasons (difference between count in centre and top panels). For each year noted, that represents the start of the main development season (i.e. 1986 = November 1986-April 1987)
Table 1: The average number of TCs passing close to the main South Pacific Island groups between November and April. The activity associated with some island groups for the coming season is a subjective assessment, and has been stated to be consistent with the wishes of the national meteorological services involved in generating this regional forecast. In addition, subjective qualification of activity (and associated risk) also recognises the small differences between the actual TC counts for the analogue composites and climatological values. The table is therefore only generally indicative of how many storms might be expected for any given island group for the coming season.
|
Country/ |
Climatology |
Analogue seasons |
Anomaly |
% Difference |
Risk |
|
Territory |
|
|
|
|
|
|
Fiji |
2.5 |
2.5 |
0 |
0 |
Normal |
|
Samoa |
1.7 |
2.5 |
0.8 |
50 |
Elevated |
|
Wallis & Futuna |
2.2 |
2.4 |
0.2 |
10 |
Normal |
|
Vanuatu |
2.9 |
2.3 |
-0.6 |
-20 |
Normal-reduced |
|
S. Cooks |
1.3 |
2.3 |
1 |
75 |
Elevated |
|
Tonga |
2.2 |
2.2 |
0 |
0 |
Normal |
|
New Caledonia |
2.75 |
1.95 |
-0.8 |
-30 |
Normal-reduced |
|
Tokelau |
1.6 |
1.85 |
0.25 |
15 |
Normal |
|
Niue |
1.8 |
1.6 |
-0.2 |
-10 |
Normal |
|
Tuvalu |
1.4 |
1.6 |
0.2 |
15 |
Normal |
|
Papua New Guinea |
0.9 |
0.8 |
0.5 |
-10 |
Normal |
|
Austral Is. |
0.75 |
1.25 |
0.5 |
65 |
Elevated |
|
Solomon Is. |
1.2 |
1.2 |
0 |
0 |
Normal |
|
Society Is. |
0.7 |
0.7 |
0 |
0 |
Normal |
|
N. Cooks |
0.5 |
0.7 |
0.2 |
40 |
Normal-elevated |
|
N. New Zealand |
0.75 |
0.65 |
-0.1 |
-15 |
Normal |
|
W. Kiribati |
0.1 |
0.1 |
0 |
0 |
Unlikely |
|
Tuamotu |
0.2 |
0.1 |
-0.1 |
-50 |
Unlikely |
|
Marquesas |
0.1 |
0.1 |
0 |
0 |
Unlikely |
|
Pitcairn |
0 |
0 |
0 |
N/A |
Unlikely |
|
E. Kiribati |
0 |
0 |
0 |
N/A |
Unlikely |
Table 2: Previous analogue seasons and intensity of TCs and storms that occurred in the Southwest Pacific during the November-April TC season. Categorisation of storms is based on minimum central pressure and aligns to the Australia Bureau of Meteorology (BoM) scale.
|
Season |
Number of named storms |
Right: TC category (BoM scale) |
Cat 1 |
Cat 2 |
Cat 3 |
Cat 4 |
Cat 5 |
|
1986/87 |
15 |
2 |
6 |
3 |
4 |
0 |
|
|
1990/91 |
3 |
0 |
1 |
1 |
1 |
0 |
|
|
2003/04 |
6 |
2 |
2 |
0 |
1 |
1 |
|
|
2004/05 |
12 |
5 |
0 |
1 |
2 |
4 |
|
|
2006/07 |
7 |
1 |
5 |
1 |
0 |
0 |
|
|
2009/10 |
11 |
3 |
3 |
1 |
2 |
2 |
|
|
2014/15 |
8 |
1 |
2 |
1 |
3 |
1 |
|
|
Mean total |
8.9 |
2 |
2.7 |
1.1 |
1.9 |
1.1 |
|
|
Rounded mean totals |
9 |
2 |
3 |
1 |
2 |
1 |
Analogue guidance summary
Based on the guidance NIWA has generated, 7-11 named TCs are expected for the 2018-19 season for the Southwest Pacific basin (135° E – 120° W). The spread for the estimated storm activity comes from the variation between selected analogue seasons. The historic average is just over 10 named cyclones per season for the basin, indicating disagreement between the analogues (and only moderate confidence) for possible outcomes for this coming season across the SW Pacific islands.
Potentially, a combination of up to four cyclones may reach category 3 or higher status. The long-term TC climatology (last 47 seasons) and the analogues we have identified suggests the occurrence of a Category 5 system may occur (see Table 2), with more than half the historic analogue seasons indicating a storm of this magnitude could occur. All the historic analogues selected for the 2018-19 outlook indicate multiple severe TCs equivalent or greater than Category 3 occurred in seasons similar to the present. This lends a moderate-to-high degree of confidence in the outlook for storm strength.
For the selected analogues, half of the years show at least one ex-tropical cyclone came within 550 km of New Zealand. The rounded average interaction for New Zealand is 1 named storm. Some of these past storms also made landfall, one ex-tropical cyclone interaction occurring during the early season and two happening during the latter half of the TC season (February-April). Some of the decaying systems were also associated with high rainfall, damaging winds and amplified coastal wave conditions. The risk of an interaction for New Zealand (at least one storm coming within 550 km of the country) for the 2018-19 season is near normal. There is an equal probability of a decaying ex-tropical cyclone tracking to the east or west of the North Island.
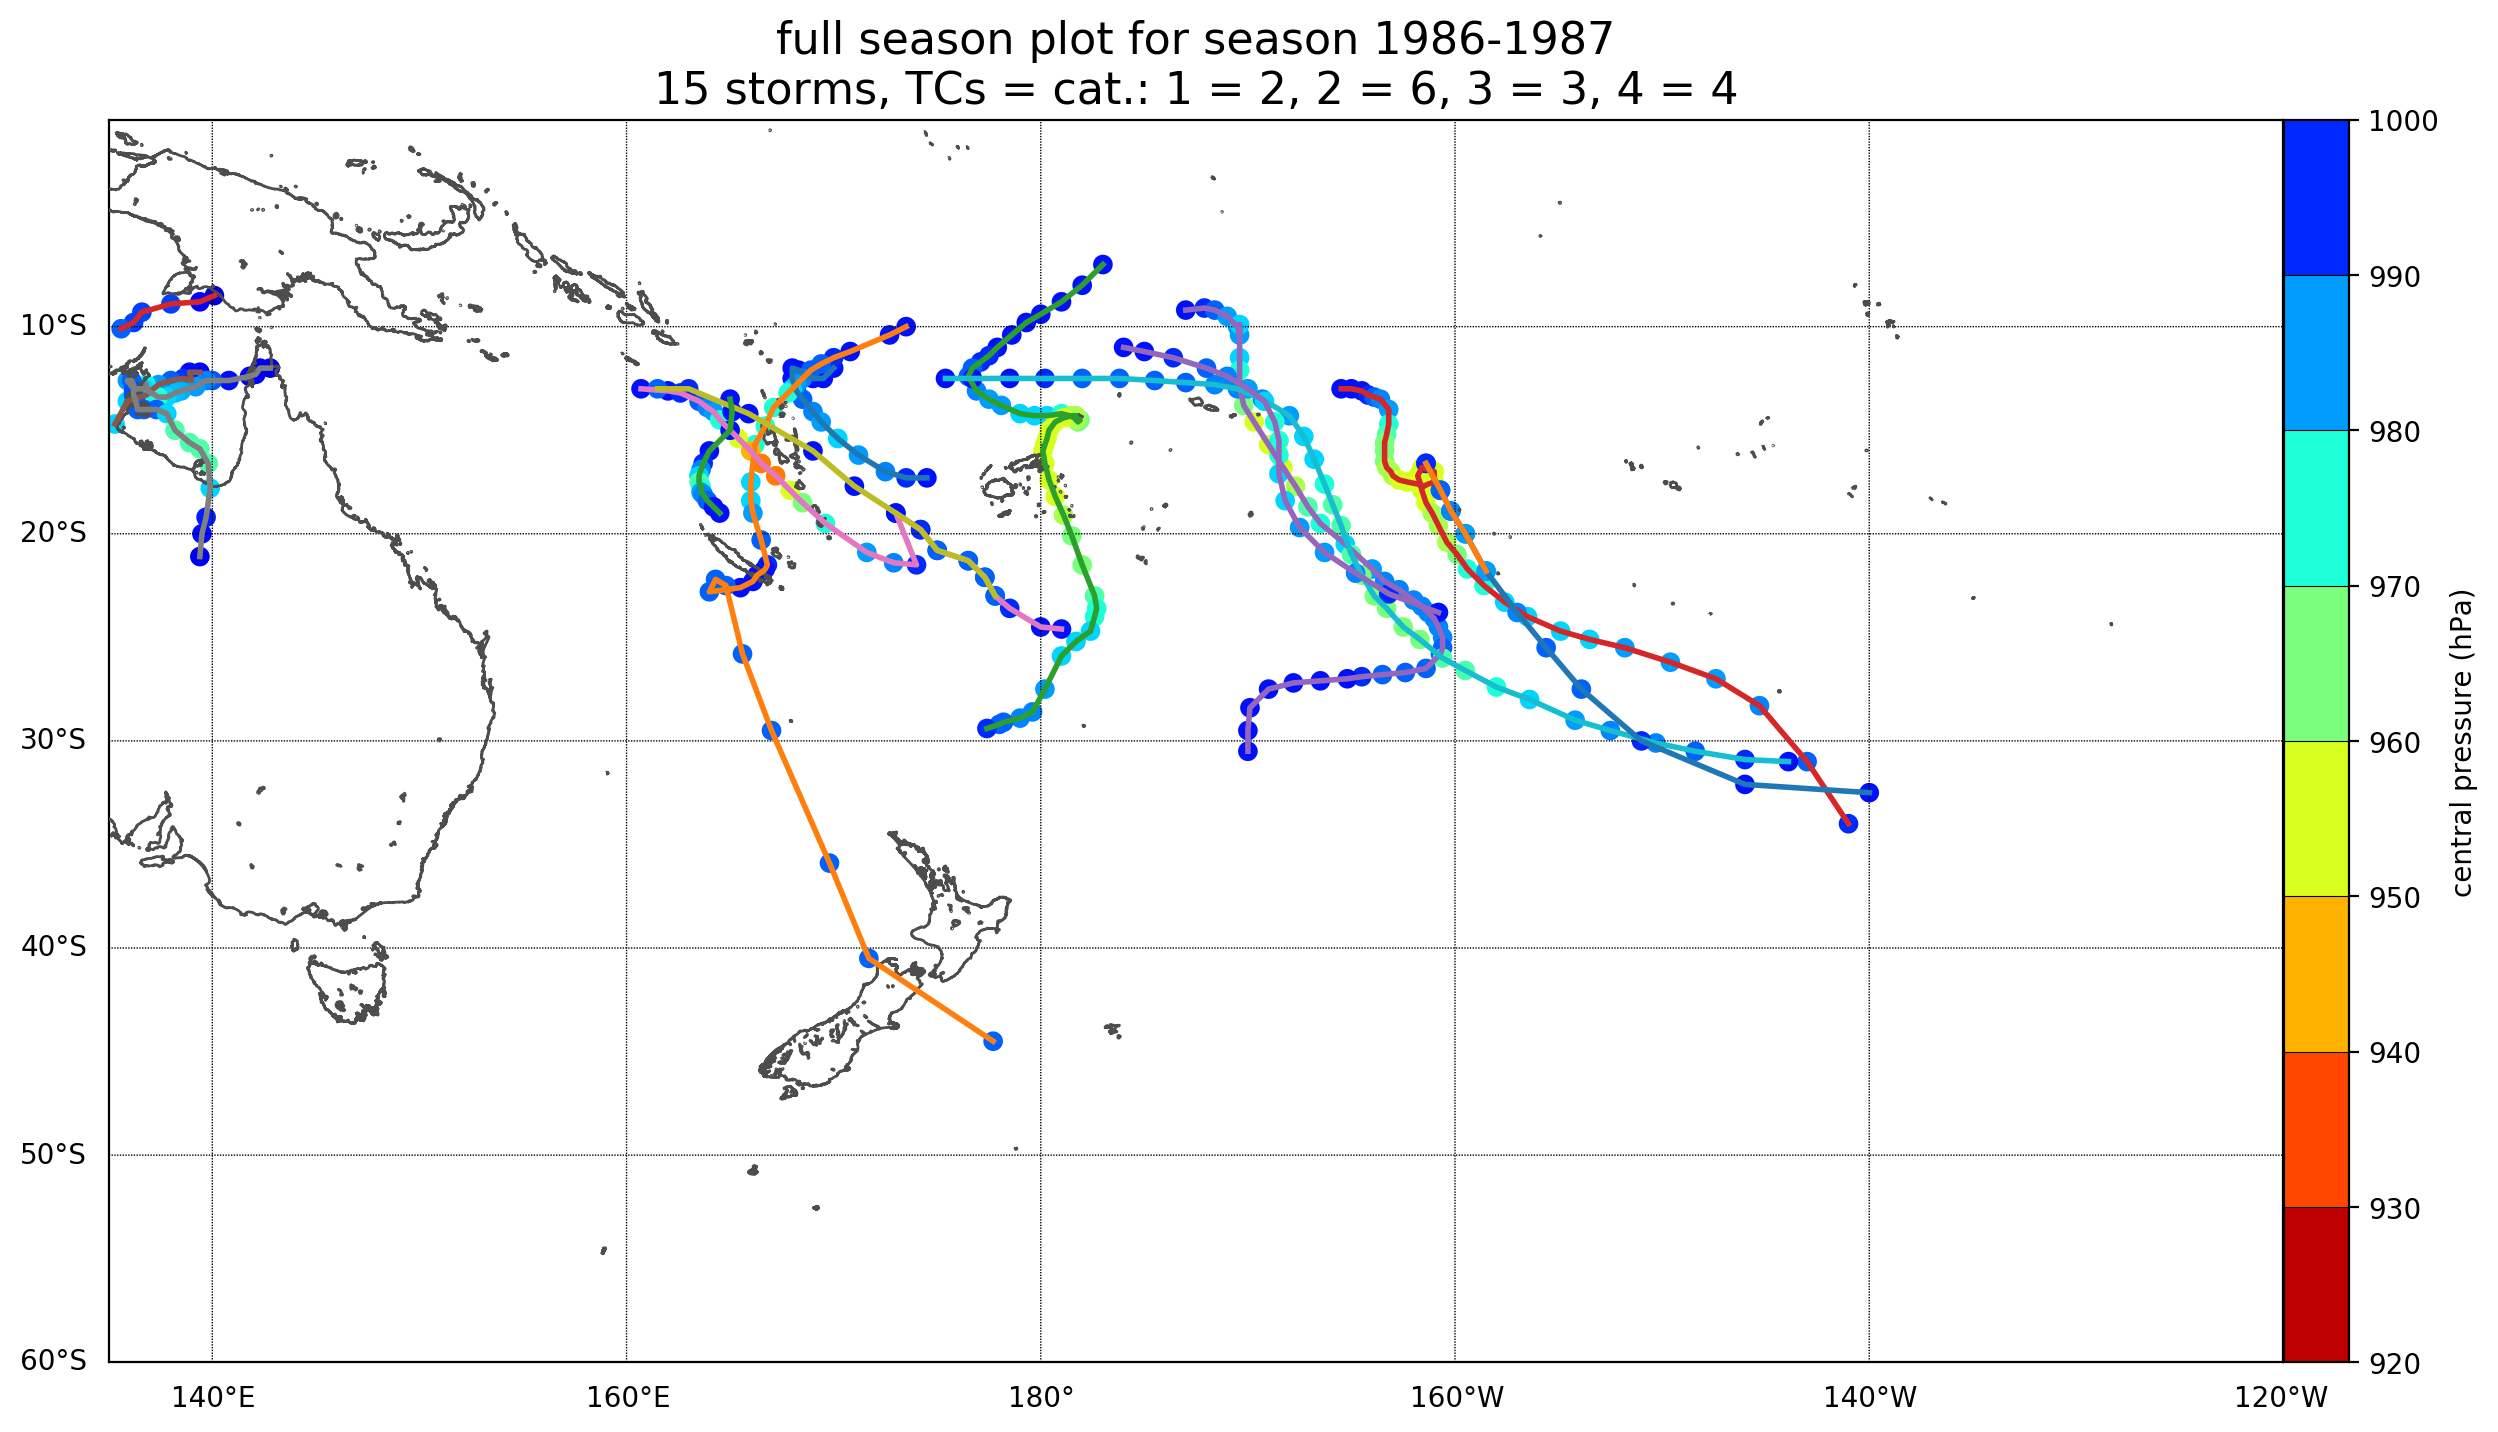
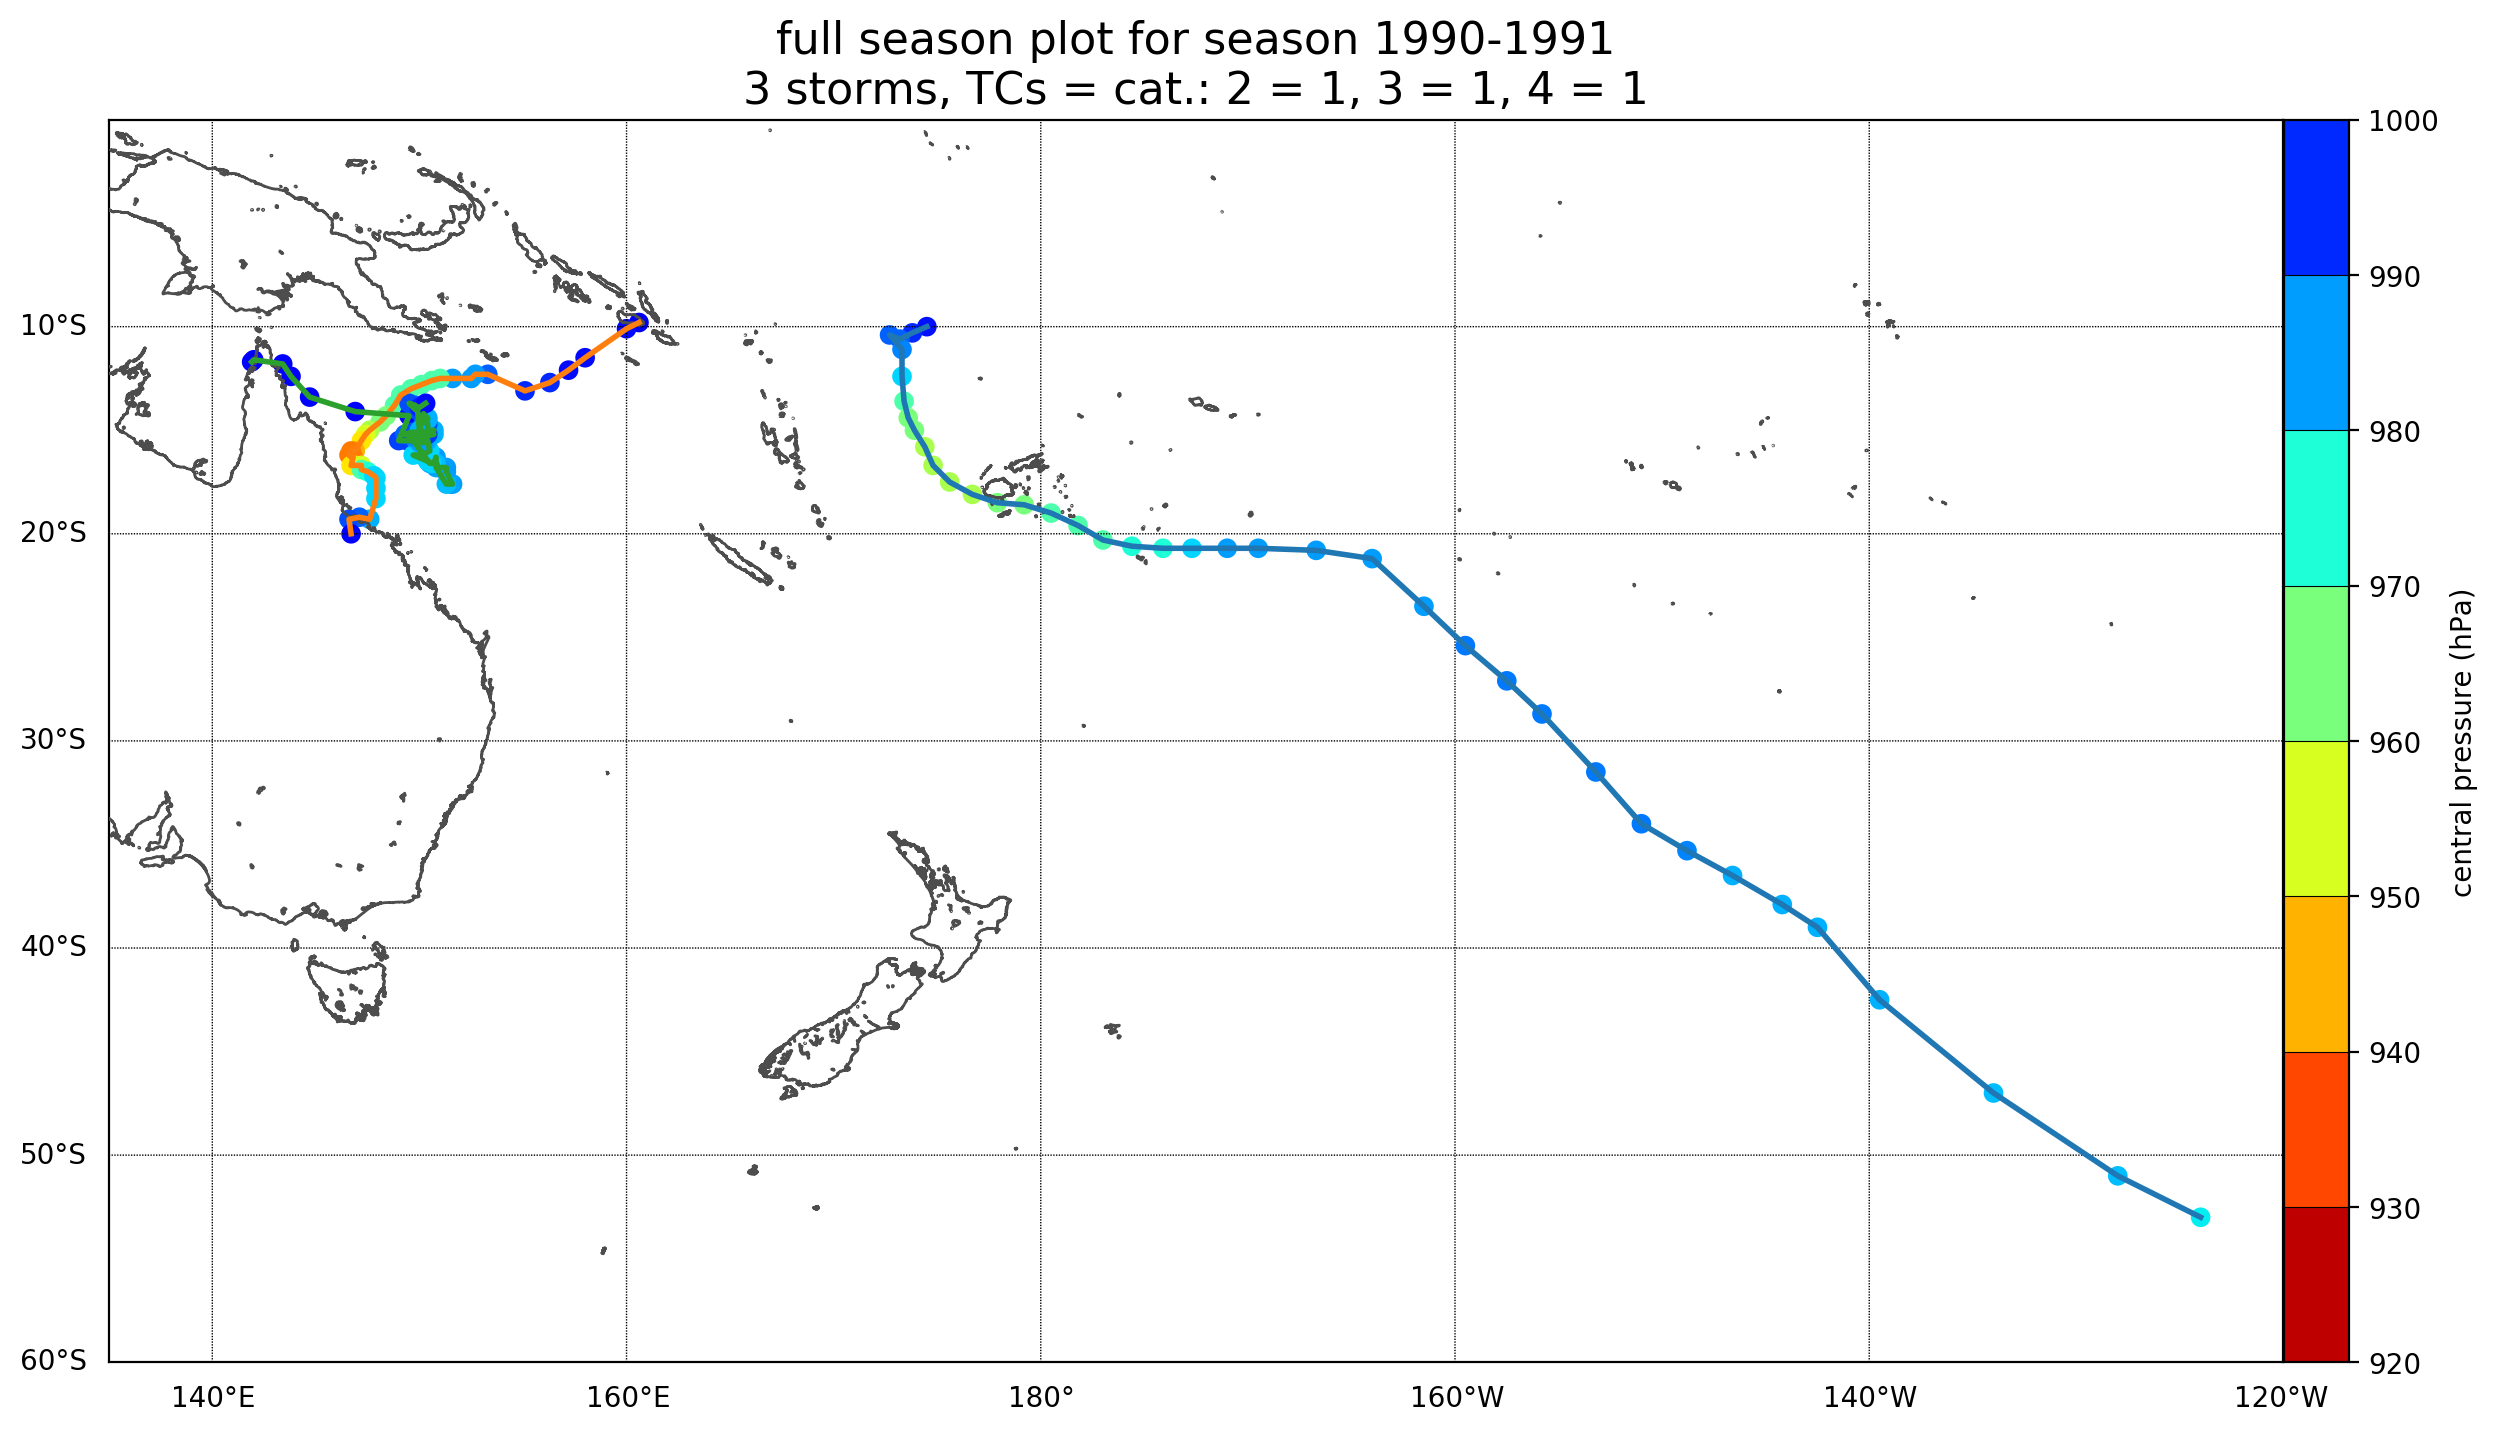
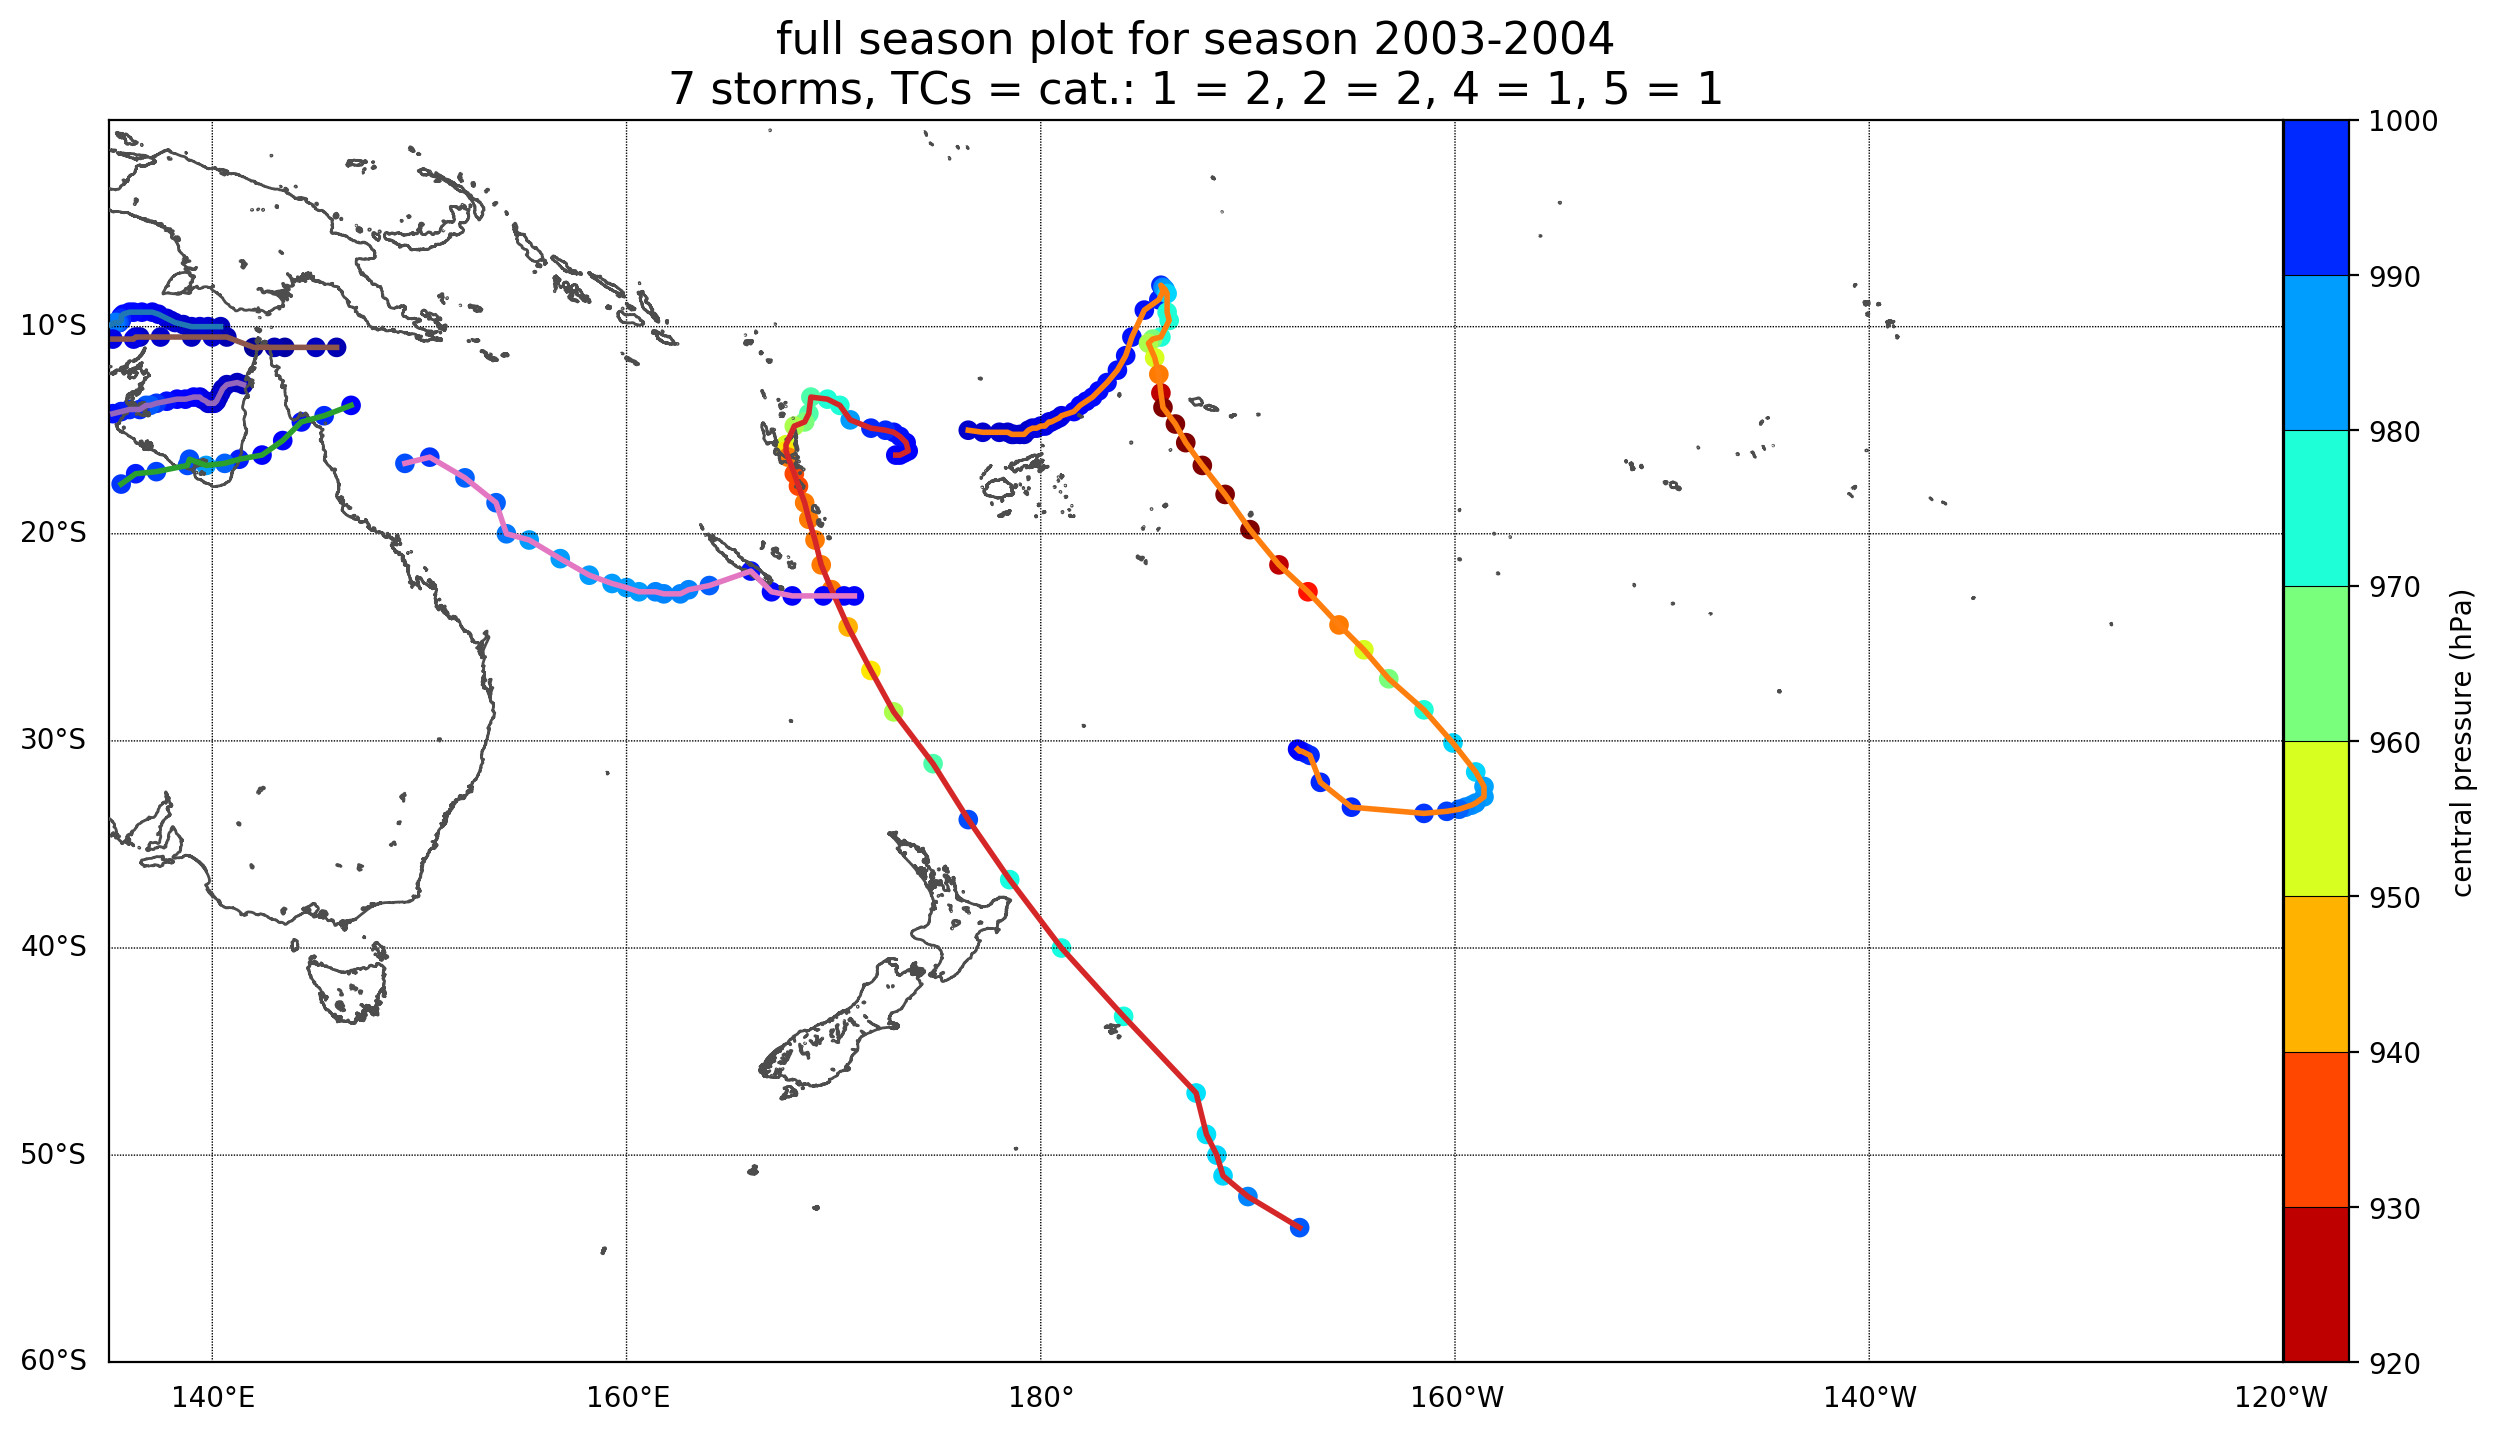
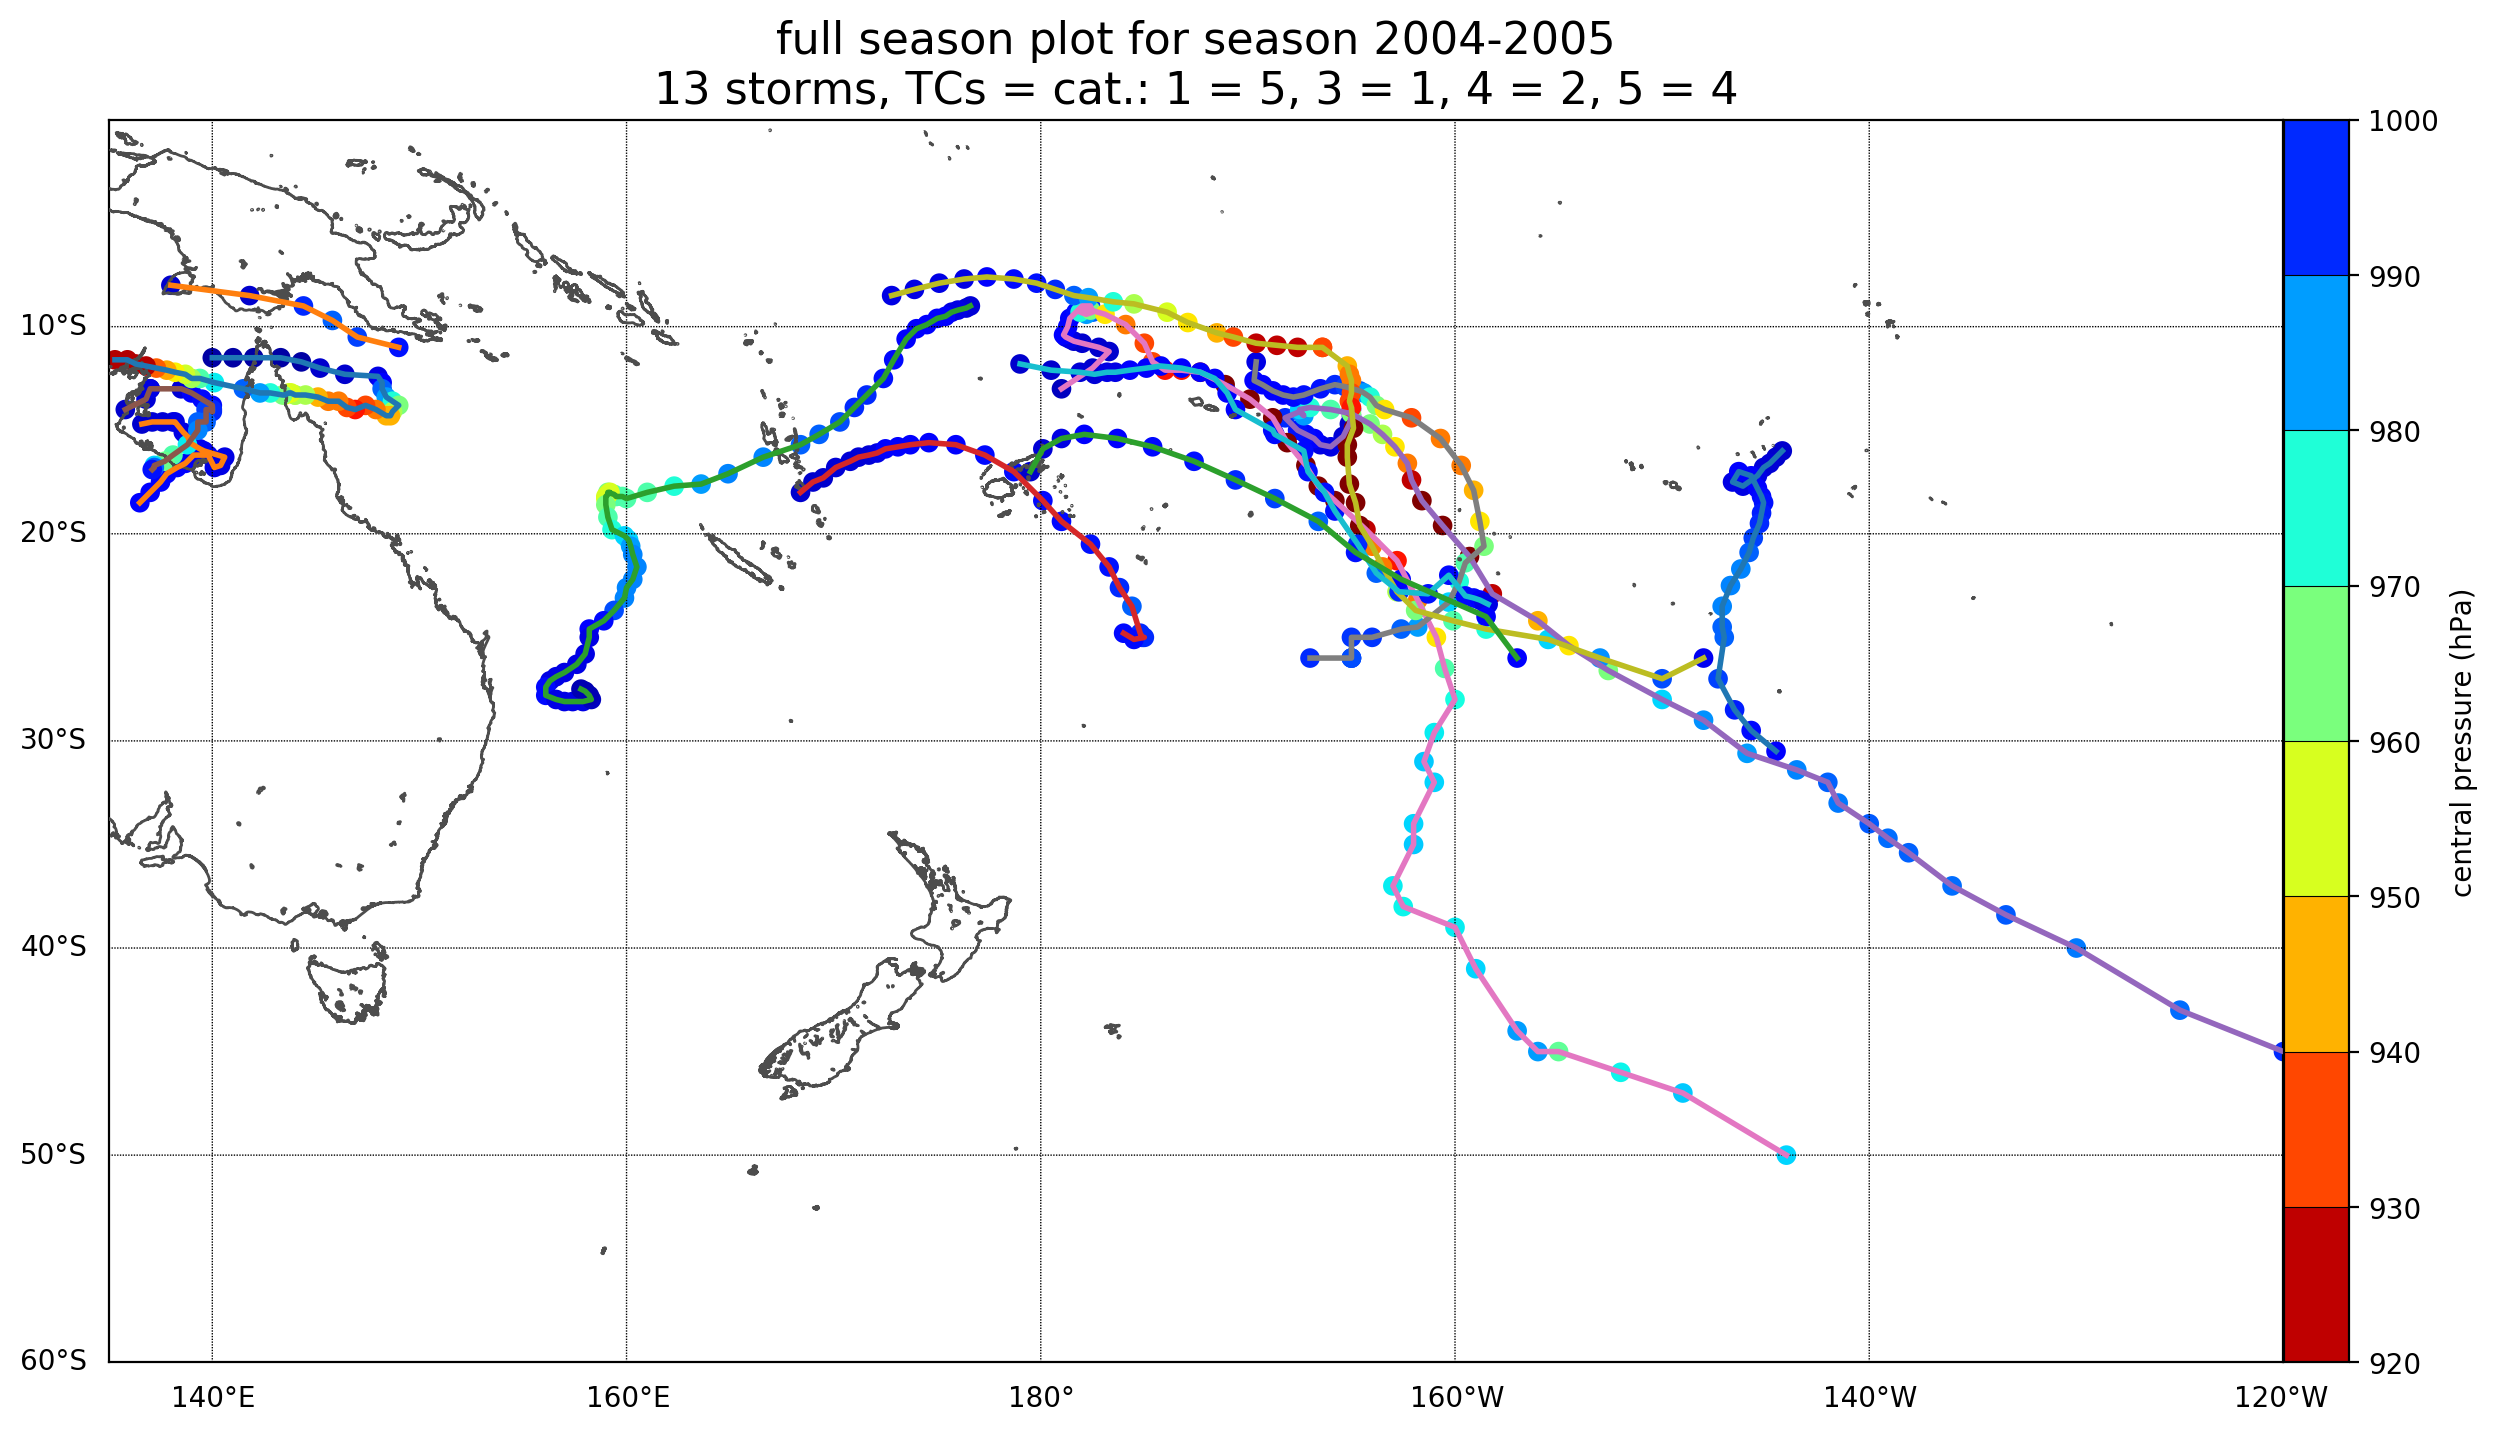
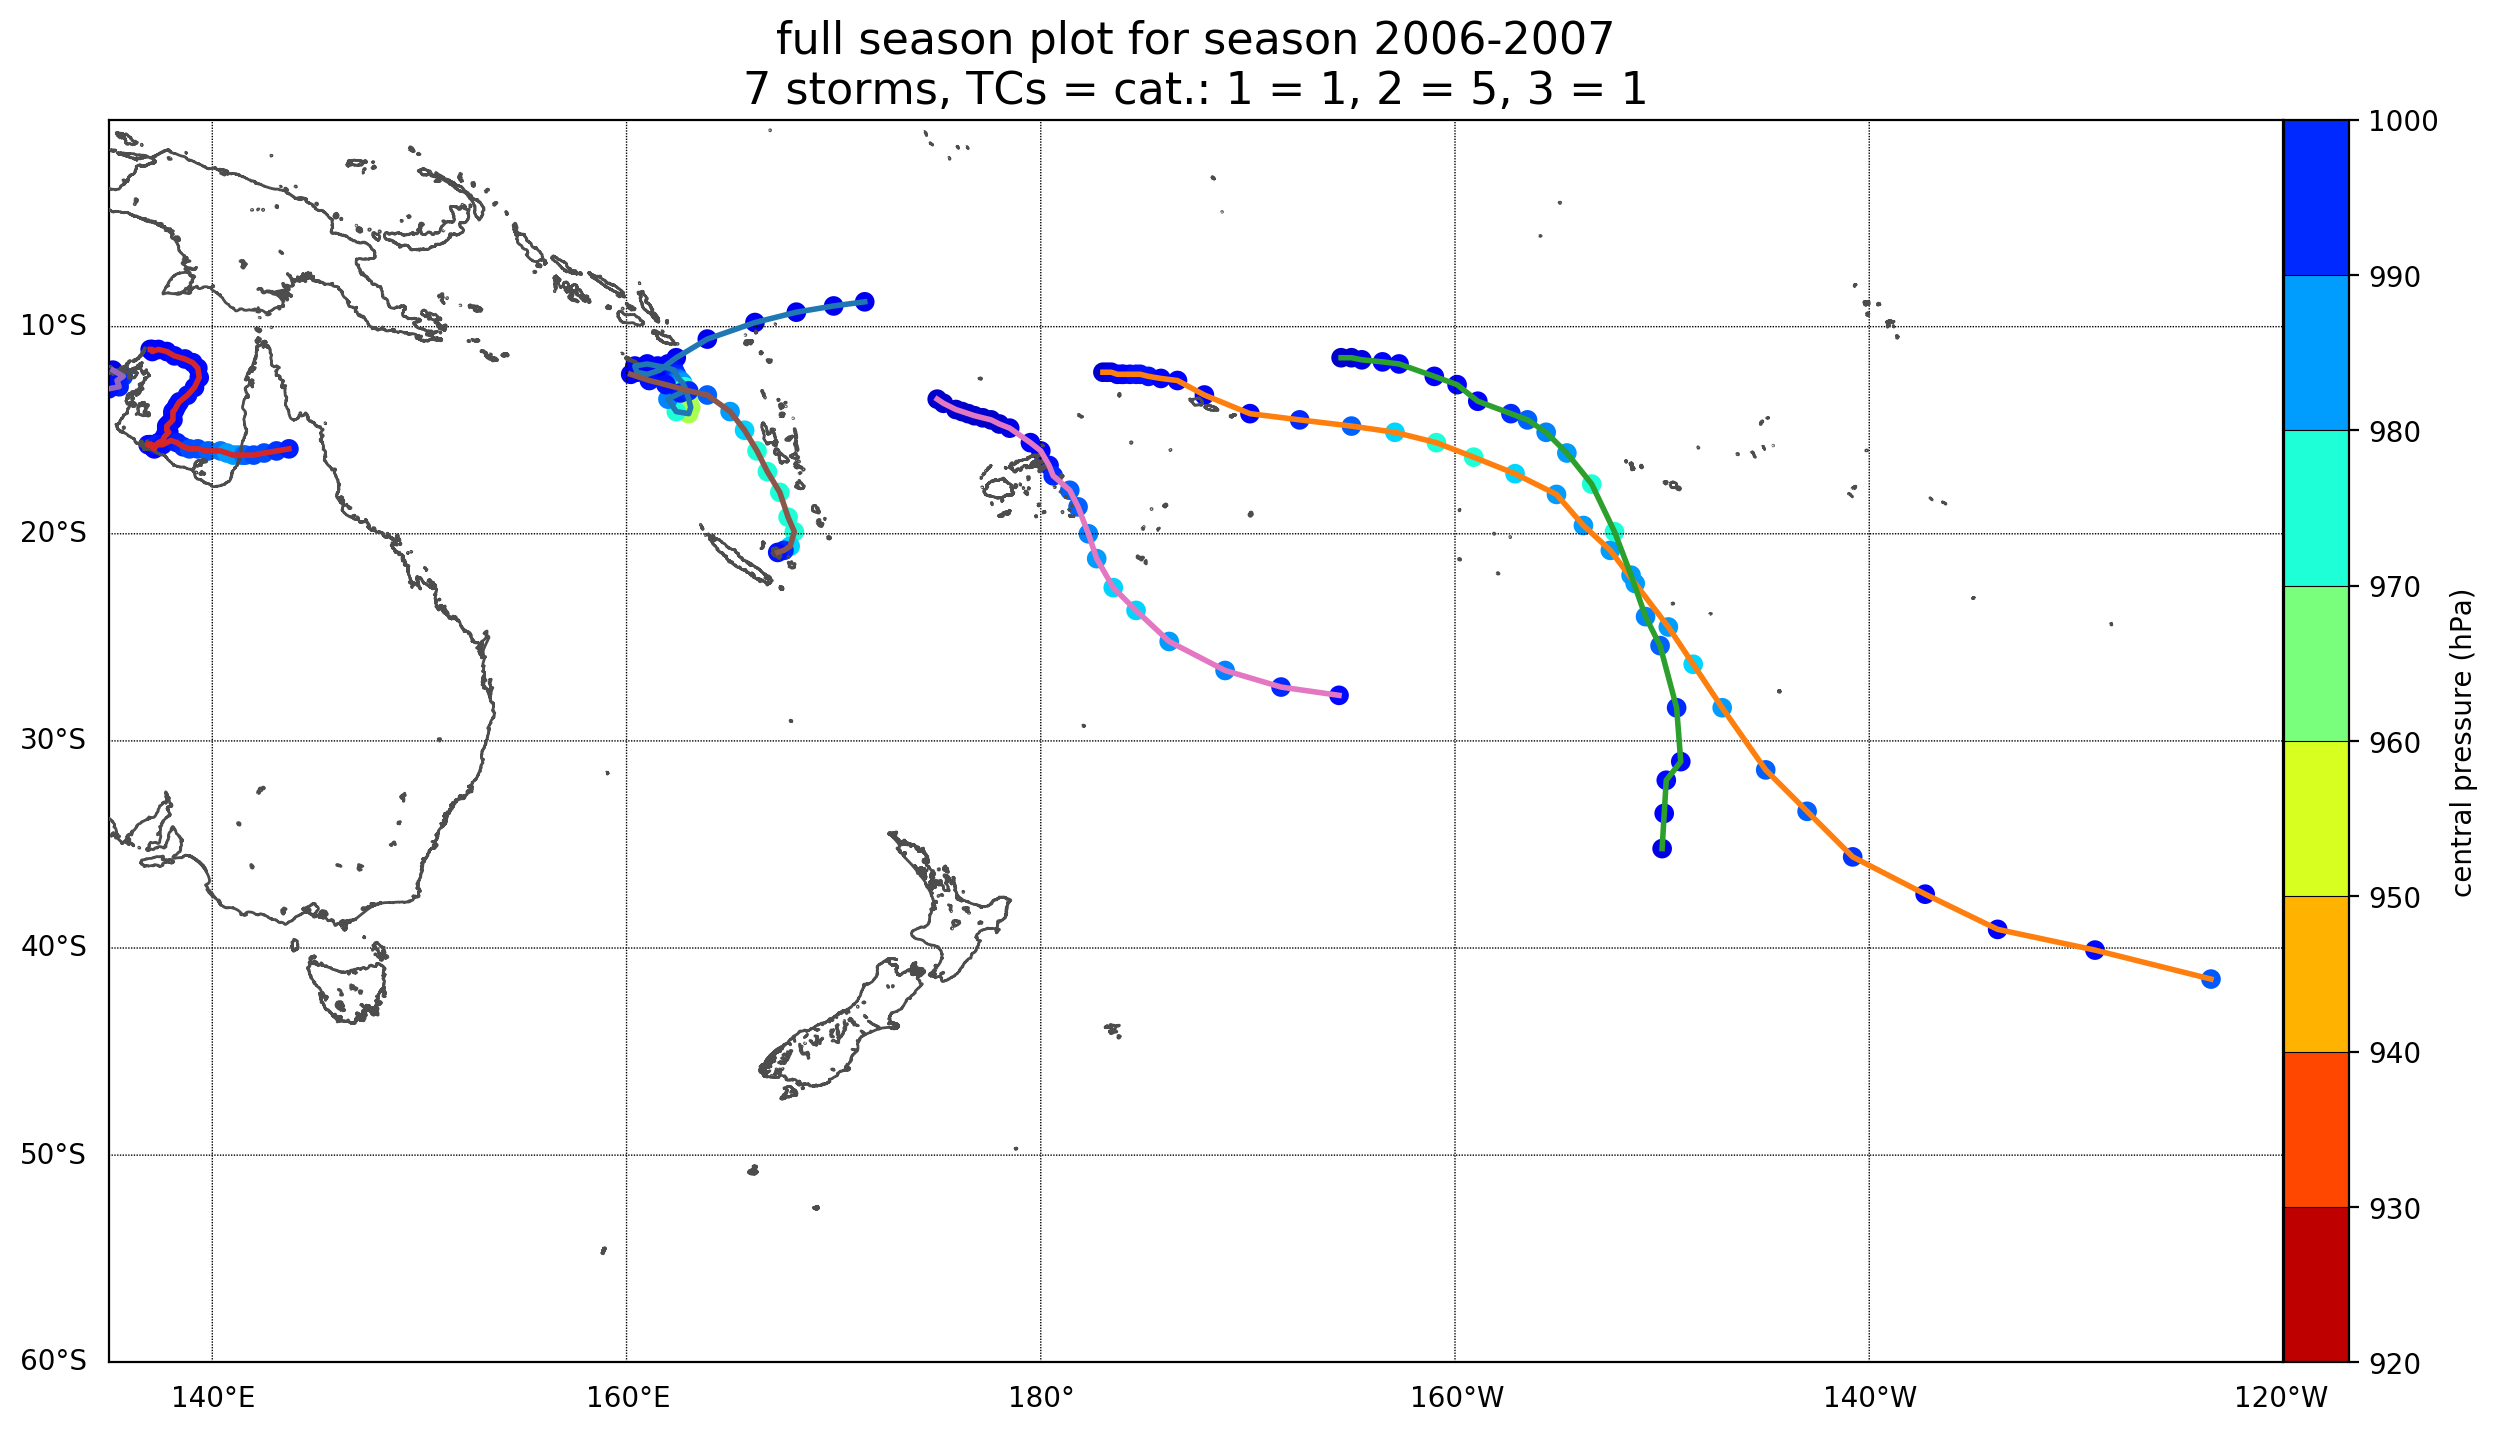
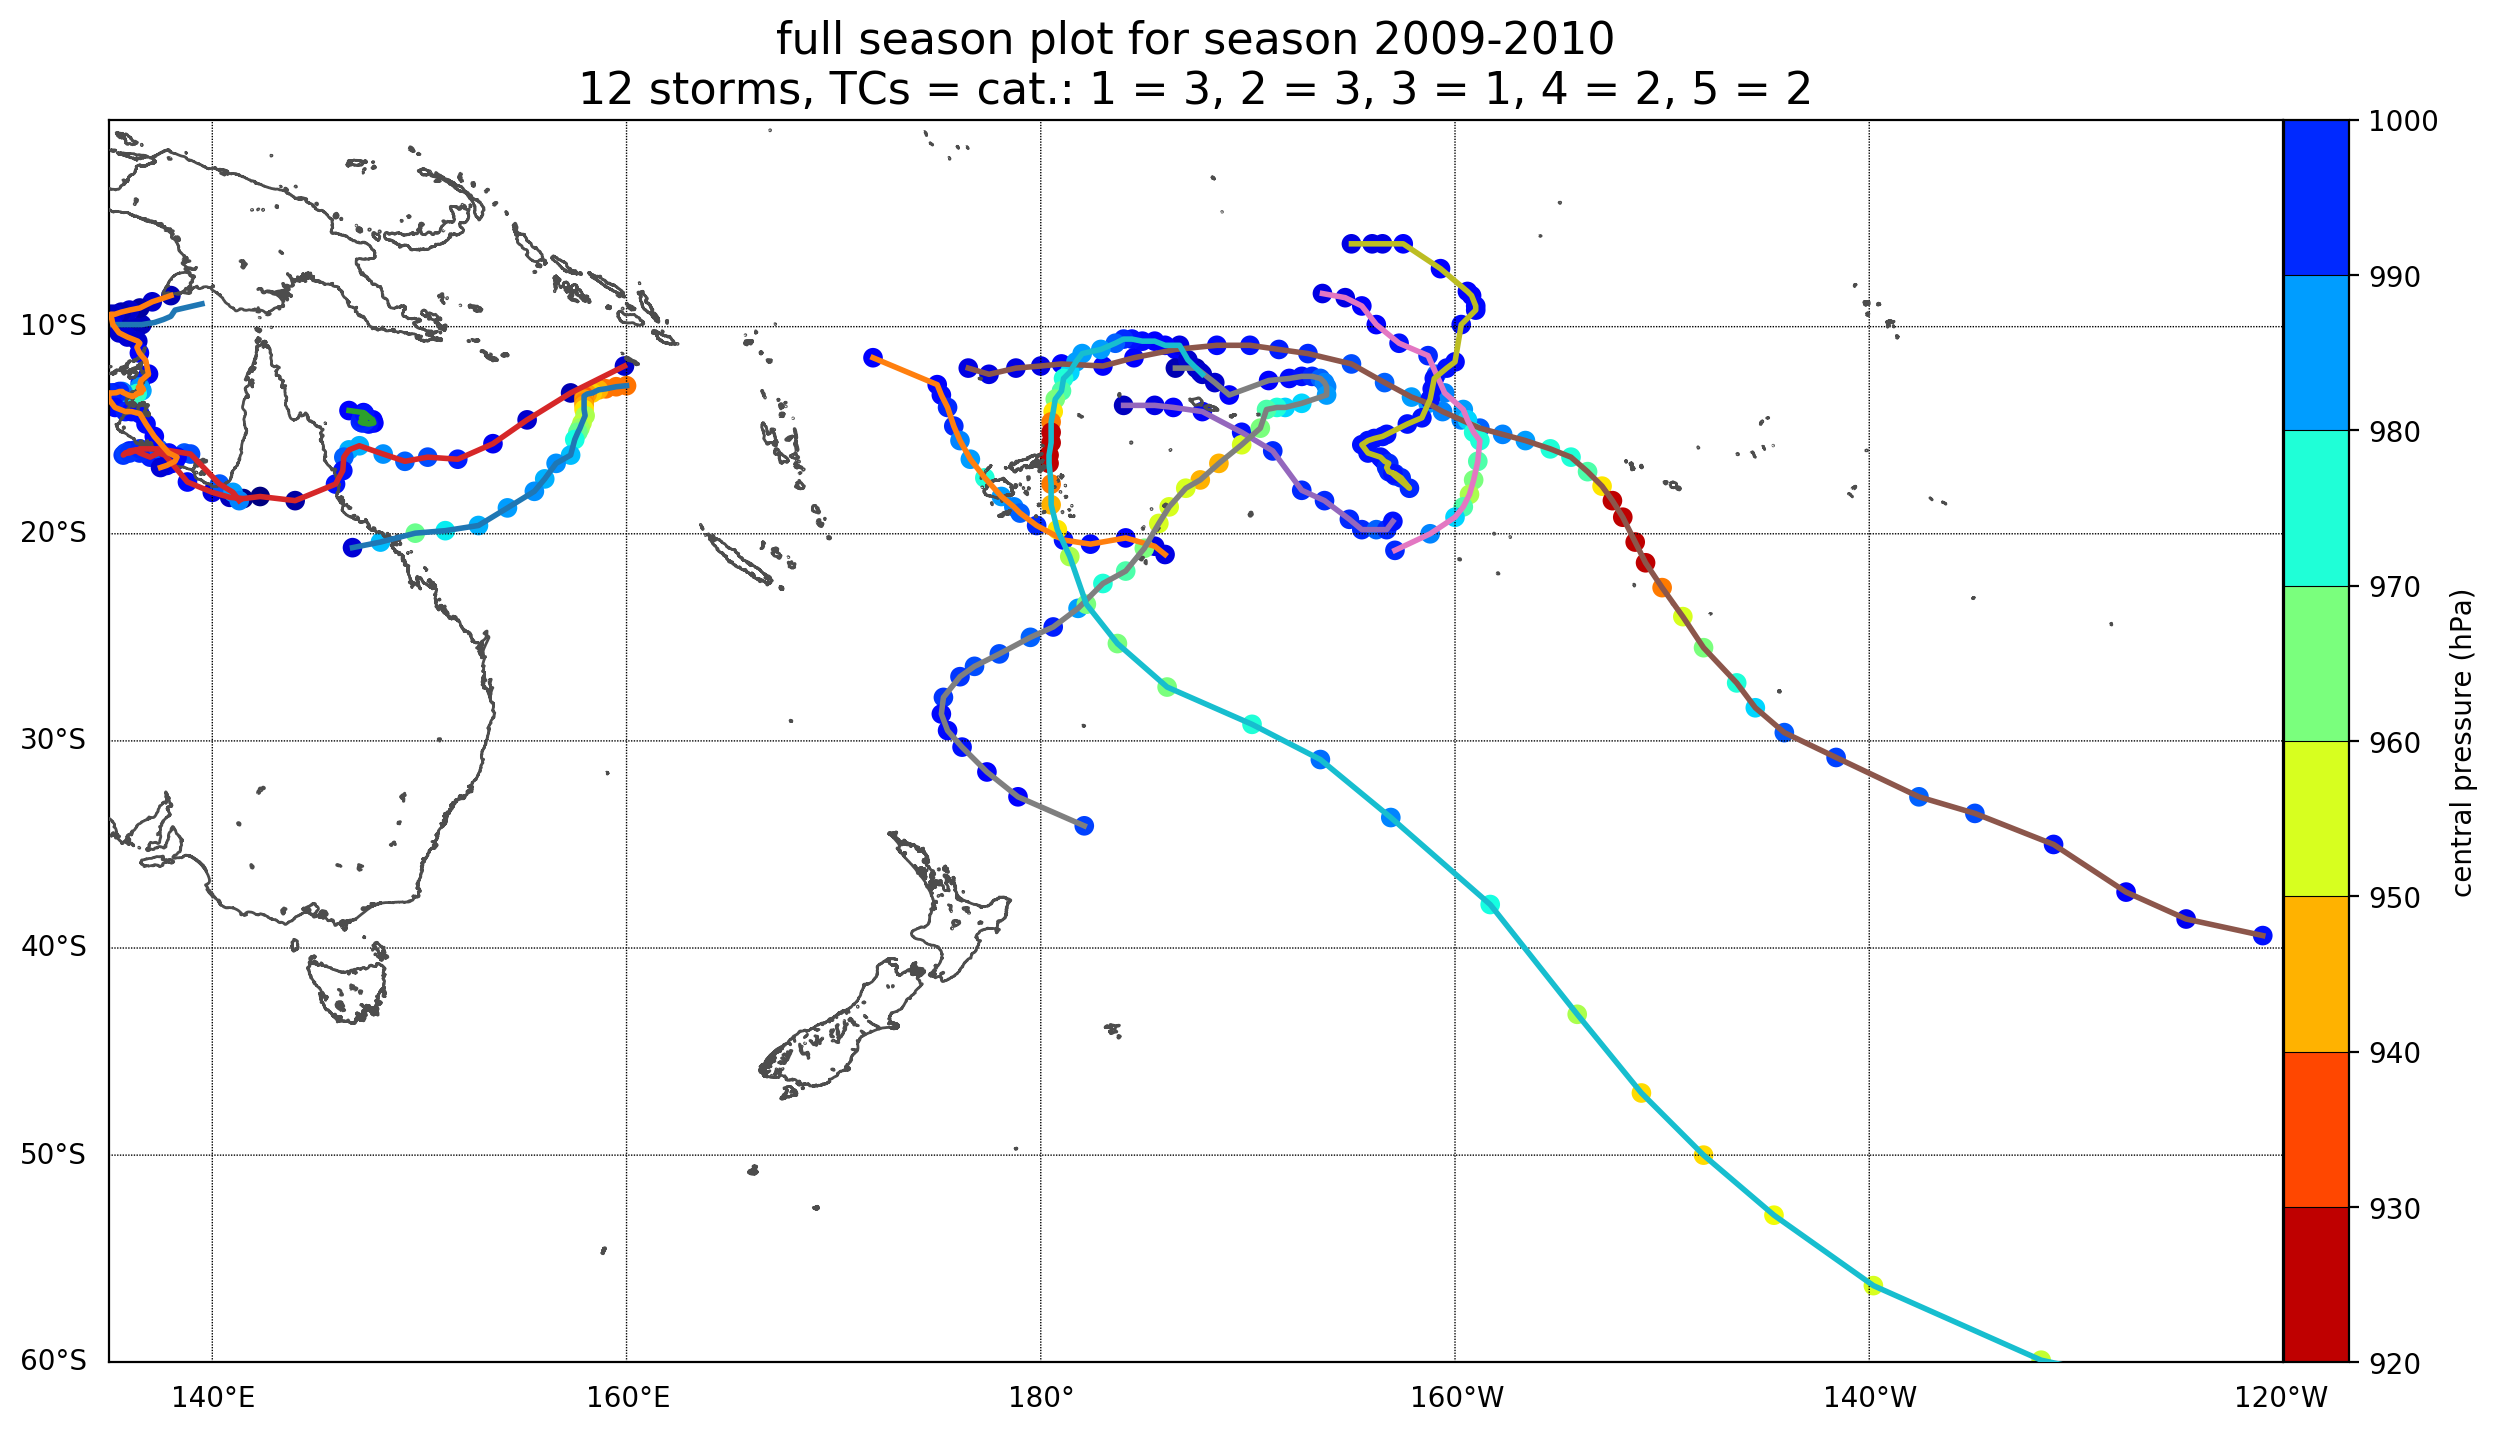
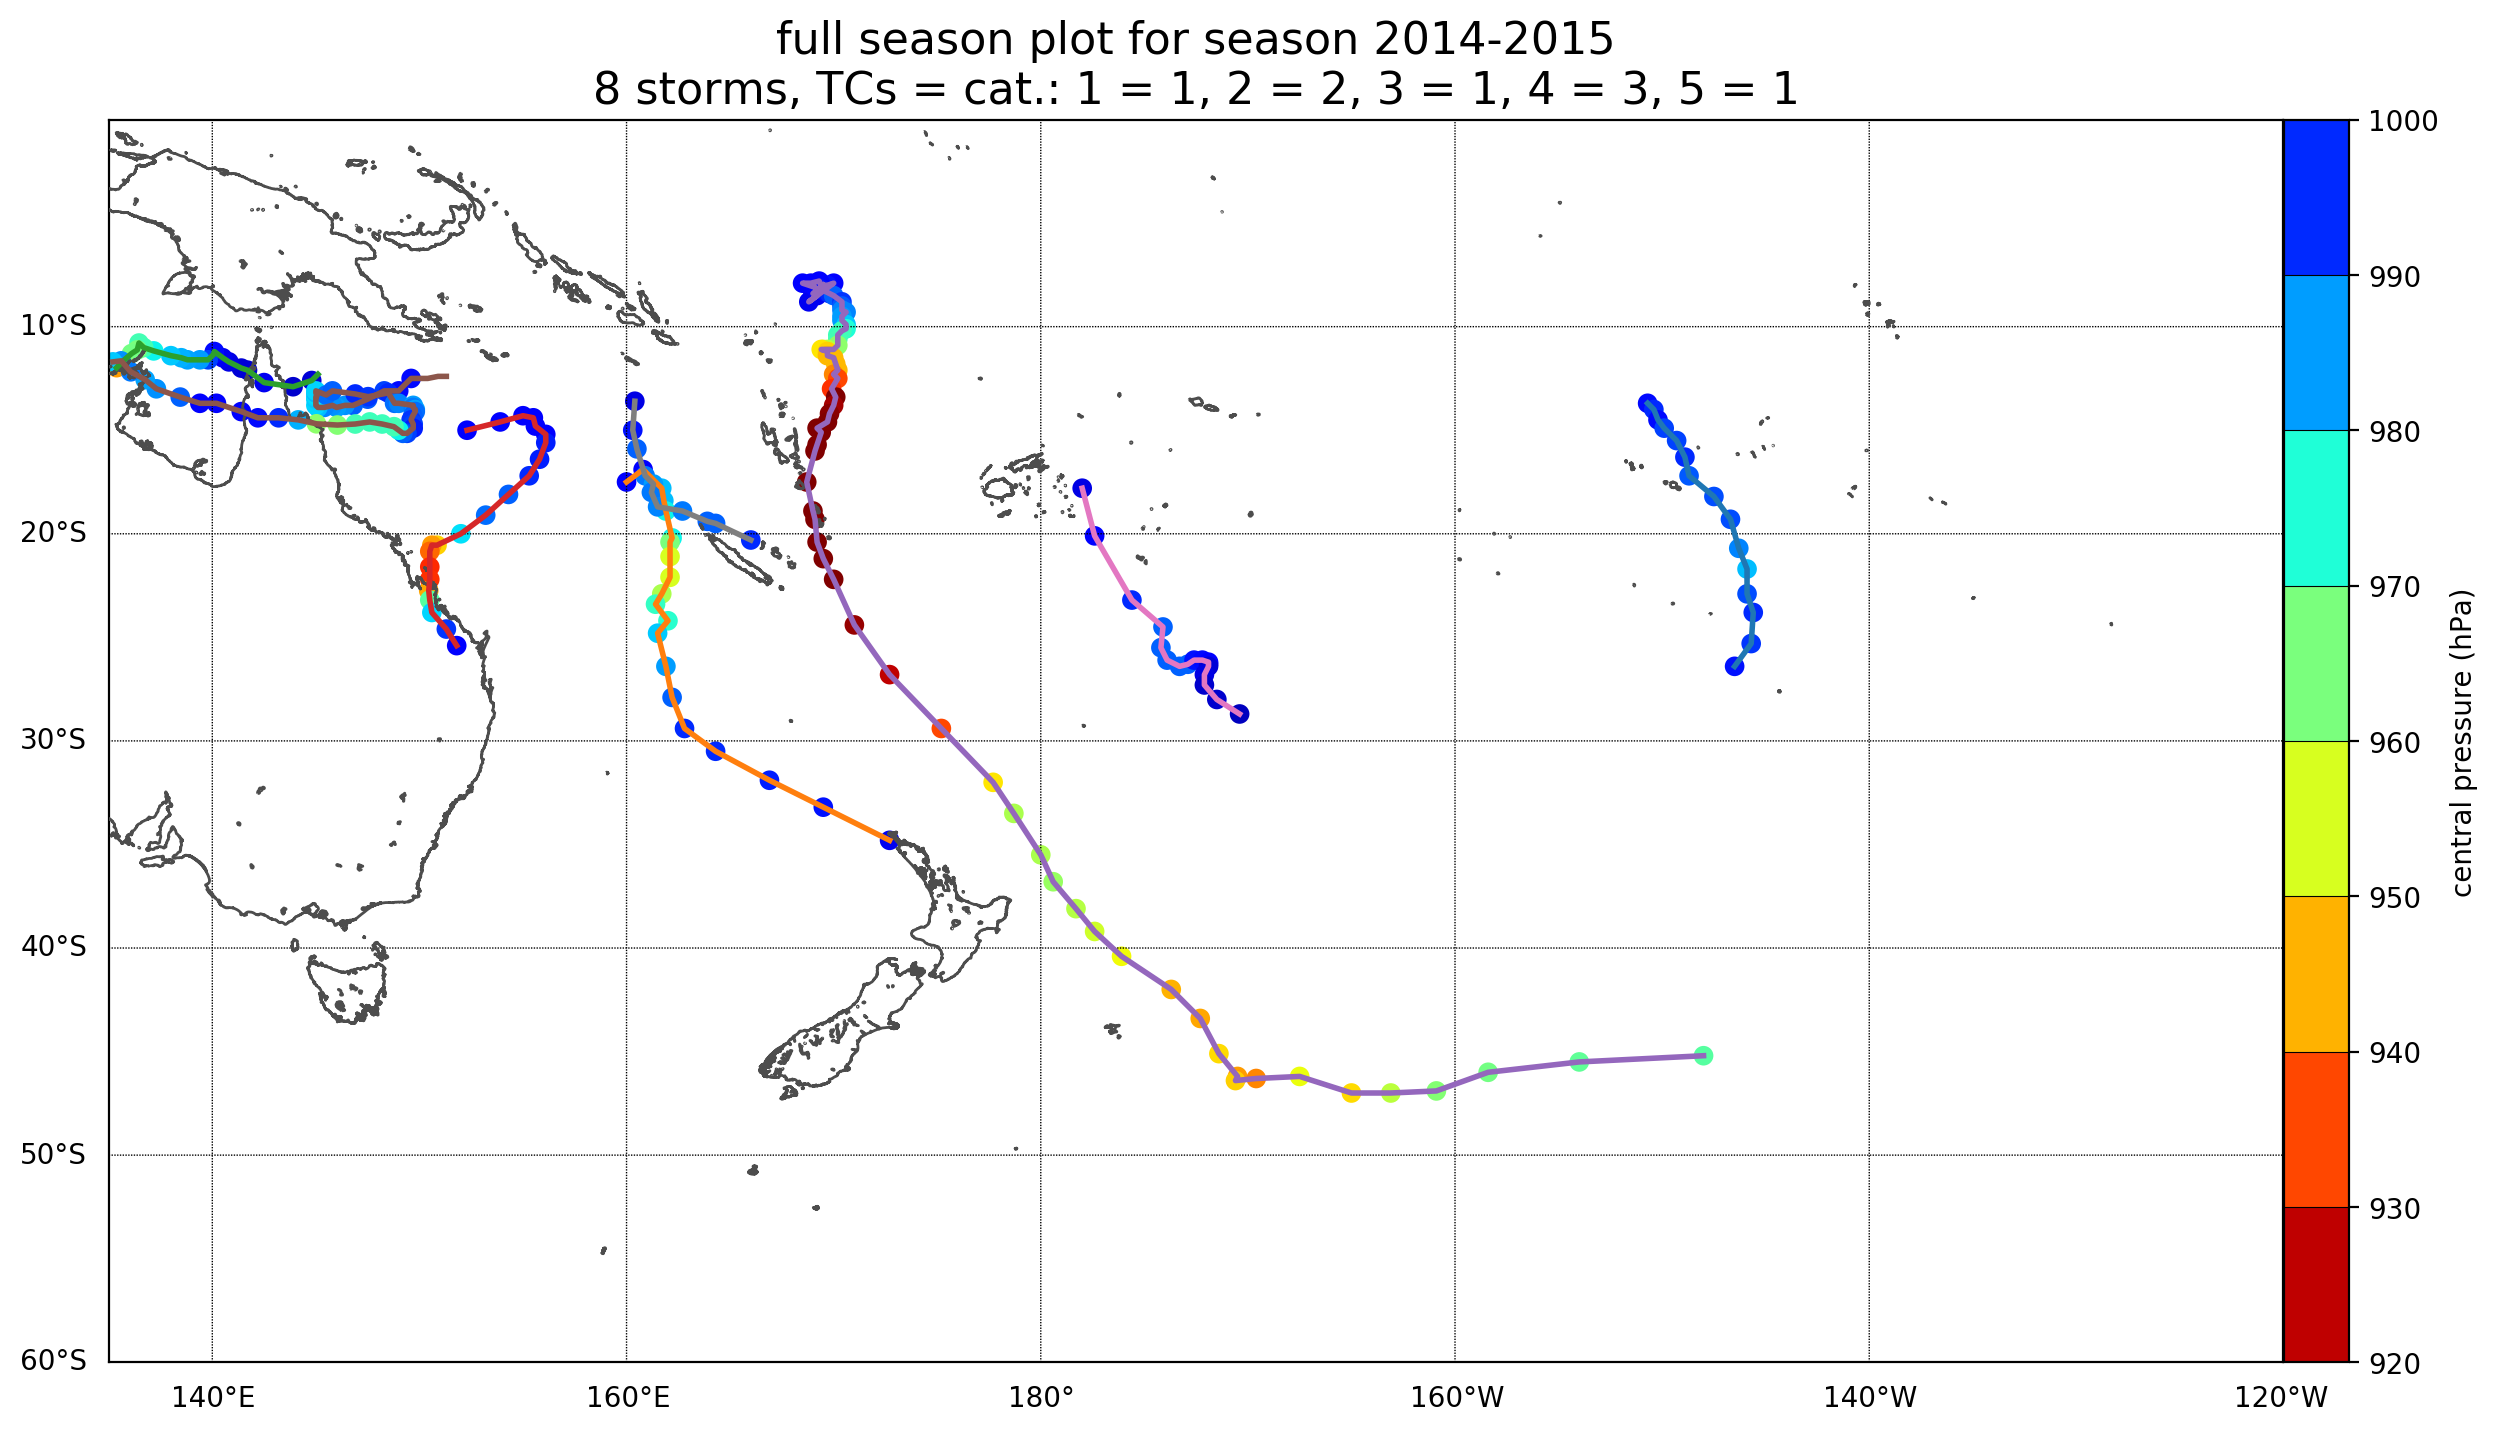
Plots of TC tracks and major storms that were monitored for analogue seasons used in the 2018-19 seasonal forecast for the full season (November - April). Track data are courtesy of International Best Tracks Archive for Climate Stewardship (IBTRACS).