Outlook Summary
- La Niña is expected to transition to ENSO-neutral during March. For Aotearoa New Zealand, this transition is expected to result in more variable air flow, temperature, and rainfall patterns during autumn.
- Low pressure will occur more frequently over the Tasman Sea and the South Island during March, leading to spells of westerly winds – a distinctive change from summer.
- These westerly winds, while not dominant, will bring some more typical cold fronts. Low pressure systems to the western side of both islands are expected to produce rainfall that will gradually ease long-term rainfall deficits in the west and south of the South Island.
- Rainfall is equally likely to be near normal or above normal in the east of the North Island and most likely to be near normal in all other regions.
- This represents a drier signal compared to previous outlooks, but the remnant effect of La Niña could still produce some sub-tropical and/or tropical low pressure systems, occasionally increasing the risk for heavy rain in the North Island.
- While seasonal temperatures are most likely to be above average in the west of the South Island and about equally likely to be near average or above average in all other regions, cold spells will become more common, such as during early-to-mid March. The seasonal transition to autumn will also be accompanied by an increasing risk for frosts.
- Coastal sea surface temperatures (SSTs) ranged from 0.4˚C to 2.9˚C above average during February. A marine heatwave continued near the South Island, which was strongest in the west.
- Soil moisture levels are about equally likely to be near normal or above normal in the north and east of the North Island, most likely to be near normal in the west of the North Island and below normal in the west of the South Island, and about equally likely to be near normal or below normal in the north and east of the South Island.
- River flows are most likely to be above normal in the north and east of the North Island, below normal in the west of the South Island, about equally likely to be near normal or above normal in the west of the North Island, and about equally likely to be near normal or below normal in the north and east of the South Island.


Regional predictions for March – May 2023
Northland, Auckland, Waikato, Bay of Plenty
The table below shows the probabilities (or percent chances) for each of three categories: above average, near average, and below average. In the absence of any forecast guidance there would be an equal likelihood (33% chance) of the outcome being in any one of the three categories. Forecast information from local and global guidance models is used to indicate the deviation from equal chance that is expected for the coming three-month period.The following outcomes are the most likely (but not certain) for this region:
- Temperatures are equally likely to be near average (45% chance) or above average (45% chance).
- Rainfall totals are most likely to be near normal (45% chance). While this represents a drier signal compared to previous outlooks, the remnant effect of La Niña could still produce some sub-tropical and/or tropical low pressure systems that could track near the region, occasionally increasing the risk for heavy rain.
- Soil moisture levels are equally likely to be near normal (45% chance) or above normal (50% chance) while river flows are most likely to be above normal (50% chance).
The full probability breakdown is:
|
Temperature |
Rainfall |
Soil moisture |
River flows |
|
|
Above average |
45 |
30 |
50 |
50 |
|
Near average |
45 |
45 |
45 |
40 |
|
Below average |
10 |
25 |
05 |
10 |
Central North Island, Taranaki, Whanganui, Manawatu, Wellington
Probabilities are assigned in three categories: above average, near average, and below average.
- Temperatures are equally likely to be near average (45% chance) or above average (45% chance).
- Rainfall totals are most likely to be near normal (45% chance). An increase in westerly winds during mid-March may see more frequent fronts reach the region.
- Soil moisture levels are most likely to be near normal (50% chance) while river flows are about equally likely to be near normal (45% chance) or above normal (40% chance).
The full probability breakdown is:
|
Temperature |
Rainfall |
Soil moisture |
River flows |
|
|
Above average |
45 |
25 |
40 |
40 |
|
Near average |
45 |
45 |
50 |
45 |
|
Below average |
10 |
30 |
10 |
15 |
Gisborne, Hawke’s Bay, Wairarapa
Probabilities are assigned in three categories: above average, near average, and below average.
- Temperatures are about equally likely to be near average (40% chance) or above average (45% chance).
- Rainfall totals are equally likely to be near normal (40% chance) or above normal (40% chance). The remnant effect of La Niña could still see some sub-tropical and/or tropical low pressure systems track near the region, occasionally increasing the risk for heavy rain.
- Soil moisture levels are about equally likely to be near normal (45% chance) or above normal (50% chance) while river flows are most likely to be above normal (50% chance).
The full probability breakdown is:
|
Temperature |
Rainfall |
Soil moisture |
River flows |
|
|
Above average |
45 |
40 |
50 |
50 |
|
Near average |
40 |
40 |
45 |
40 |
|
Below average |
15 |
20 |
05 |
10 |
Tasman, Nelson, Marlborough, Buller
Probabilities are assigned in three categories: above average, near average, and below average.
- Temperatures are about equally likely to be near average (40% chance) or above average (45% chance). Spells of cooler air are likely in early-to-mid March.
- Rainfall totals are most likely to be near normal (45% chance). The remnant effect of La Niña could see a sub-tropical and/or tropical moisture plume reach the region at some point during the season, particularly in Marlborough.
- Soil moisture levels and river flows are about equally likely to be near normal (45% chance) or below normal (40% chance).
The full probability breakdown is:
|
Temperature |
Rainfall |
Soil moisture |
River flows |
|
|
Above average |
45 |
30 |
15 |
15 |
|
Near average |
40 |
45 |
45 |
45 |
|
Below average |
15 |
25 |
40 |
40 |
West Coast, Alps and foothills, inland Otago, Southland
Probabilities are assigned in three categories: above average, near average, and below average.
- Temperatures are most likely to be above average (55% chance). Marine heatwave conditions continued in February, increasing the odds for above average autumn air temperatures. However, spells of cooler air are likely in early-to-mid March.
- Rainfall totals are most likely to be near normal (45% chance). During March, an increase in westerly winds will likely bring more frequent fronts and low pressure systems to the west and south of the South Island, easing some of the recent rainfall deficits.
- Soil moisture levels and river flows are most likely to be below normal (45-50% chance).
The full probability breakdown is:
|
Temperature |
Rainfall |
Soil moisture |
River flows |
|
|
Above average |
55 |
20 |
20 |
20 |
|
Near average |
30 |
45 |
30 |
35 |
|
Below average |
15 |
35 |
50 |
45 |
Coastal Canterbury, east Otago
Probabilities are assigned in three categories: above average, near average, and below average.
- Temperatures are about equally likely to be near average (40% chance) or above average (45% chance each). Spells of cooler air are likely in early-to-mid March.
- Rainfall totals are most likely to be near normal (45% chance). An increase in westerly winds will see some dry spells develop during the season, but the remnant effect of La Niña will still result in onshore wind flows and rain at times.
- Soil moisture levels and river flows are about equally likely to be near normal (45% chance) or below normal (40-45% chance).
The full probability breakdown is:
|
Temperature |
Rainfall |
Soil moisture |
River flows |
|
|
Above average |
45 |
30 |
15 |
10 |
|
Near average |
40 |
45 |
45 |
45 |
|
Below average |
15 |
25 |
40 |
45 |
Graphical representation of the regional probabilities

Background
The NINO3.4 Index anomaly (which covers the west-central equatorial Pacific) over the last month (through 27 February) was -0.46˚C (climatology: 1991-2020), in neutral territory for the first time since July-August 2022. The remnant central Pacific “cool pool” is now flanked by warmer than average seas, with the NINO 1+2 Index (eastern Pacific) reaching +0.65˚C, the warmest 30-day value since March 2019.
The February monthly Southern Oscillation Index (SOI) was +1.0 and +1.2 from December-February (climatology: 1991-2020), both in La Niña range. Although equatorial SSTs have faded to near-neutral values, the atmosphere has continued to show La Niña-like patterns; this lag effect is expected to continue during autumn.
February trade winds were stronger than normal in the equatorial Pacific. However, significantly reduced trade winds and a possible westerly wind burst are predicted for March. This is linked to a pulse of the Madden-Julian Oscillation (MJO) crossing the Pacific. This radical change in equatorial circulation represents the first real sign that the ocean-atmosphere system has a chance of moving toward El Niño during 2023. First and foremost, however, will be a likely transition to ENSO-neutral conditions during March.
In the subsurface equatorial Pacific, La Niña’s decay continued during February. Sub-surface water temperatures were above average across the entire basin, with waters in the upper 100 m of the eastern equatorial Pacific becoming more anomalously warm as compared to January. Closer to the surface, warmer than average waters spread toward the central Pacific, leading to a contraction of La Niña’s remnant cool pool of water.
NIWA’s analysis indicates that La Niña will transition to ENSO-neutral during autumn (95% chance), most likely during March. The chance for El Niño conditions then increases to over 60% during winter, continuing through spring. That chance is supported by the trends in sub-surface ocean conditions and trade winds. It should be noted that ENSO forecasts made just before and during Northern Hemisphere spring have lower skill (known as the spring predictability barrier).
During December-February, tropical forcing was influenced by La Niña superimposed with pulses of the Madden-Julian Oscillation (MJO). This was associated with an anomalously strong Walker Circulation, observed through rising air across the eastern tropical Indian Ocean, Maritime Continent, and West Pacific, coupled with sinking air over the eastern Pacific.
During February, the MJO was active over the Maritime Continent and West Pacific, leading to conditions which spawned severe Tropical Cyclone Gabrielle. At the end of the month, another strong MJO pulse was developing over the West Pacific, creating a more favourable environment for tropical cyclone activity in the Southwest Pacific resulting in severe Tropical Cyclone Judy. This wave was forecast to move eastward and stand strongly over the eastern Pacific Ocean and South America during the 2nd and 3rd week of March (MJO phases 8-1). During March, MJO phase 8 is expected to be associated with below normal air pressure and temperatures and a strong south-to-southwest air flow anomaly around New Zealand. The MJO may move toward phase 1 during mid-to-late March, which is associated with stronger westerly winds during the autumn season.
From late March into early April, a convective pulse associated with the MJO may move over the Indian Ocean, Maritime Continent, and West Pacific once more, bringing La Niña-like patterns and briefly increasing the risk for tropical cyclones in the Southwest Pacific. Another MJO phase 8-1 sequence in mid-to-late April could usher in cooler than average temperatures for New Zealand.
Holistically, MJO trends support more variable air flow patterns, temperatures, and rainfall distribution in the coming months as the effect of La Niña wanes.
The Southern Annular Mode (SAM) was negative for about a week in early-to-mid February, around the time when ex-Tropical Cyclone Gabrielle impacted New Zealand. This was the first time the index was negative this summer. A negative SAM is signalled during the first half of March, in association with low pressure across the wider New Zealand region. Following numerous seasons during which the SAM was predominantly positive, some negative SAM spells are likely during autumn as the effect of La Niña wanes.
During February, marine heatwave conditions persisted in the South Island coastal waters. February SSTs were the warmest on record in the west and east of the South Island and second warmest on record in the north of the South Island. For more information, see the NIWA Sea Surface Temperature Update.
NZ 30-day coastal SST anomalies (to 27 February)
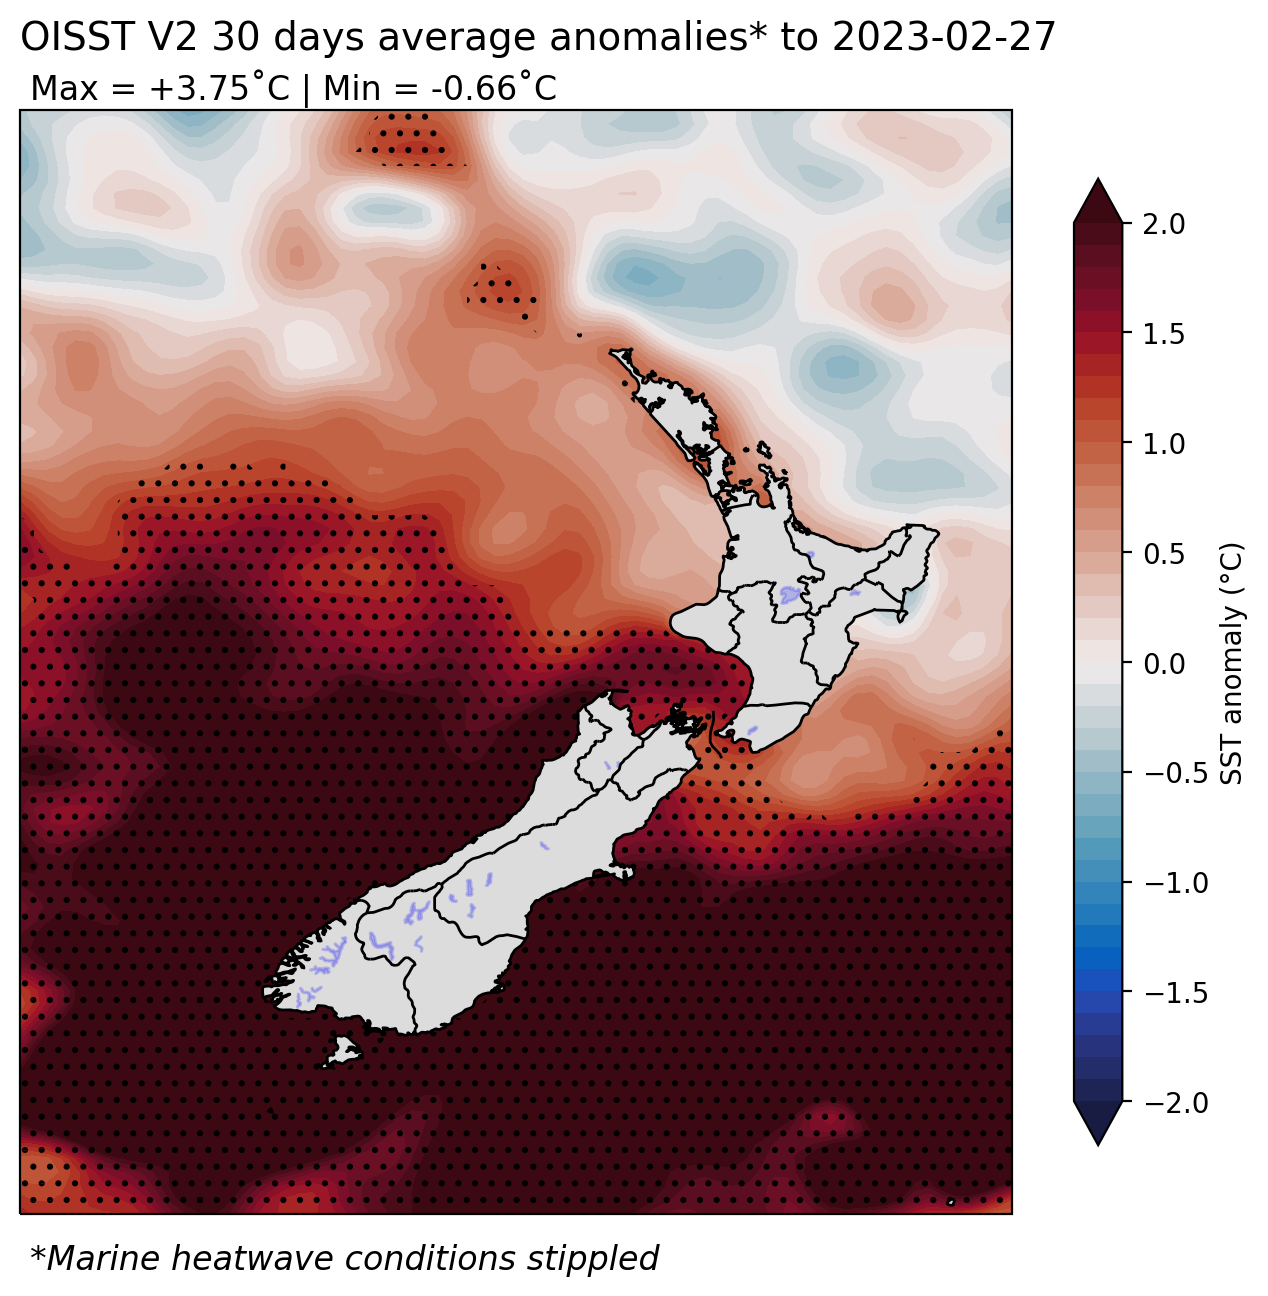
|
North NI |
+0.51˚C |
|
West NI |
+1.21˚C |
|
East NI |
+0.38˚C |
|
North SI |
+1.69˚C |
|
West SI |
+2.87˚C |
|
East SI |
+2.20˚C |
Forecast Confidence
Temperature
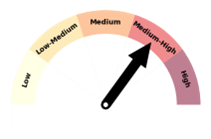
|
Forecast confidence for temperatures is medium to high. While a colder than average season is very unlikely, a change in circulation patterns associated with the end of La Niña conditions may lead to more variable air flow patterns and changeable temperatures across New Zealand. That makes it more challenging to synthesize a seasonal outlook. |
Rainfall
|
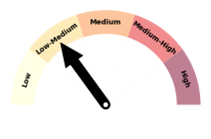
|
Forecast confidence for rainfall is low-to-medium. The easing of La Niña means that our climatic variability will be driven by other factors. This may lead to more changeable weather patterns and a mix of westerly and easterly winds, unlike recent seasons during which easterlies were more dominant. The net effect is less certainty in the rainfall outlook. |
