Outlook Summary
- The atmospheric circulation around New Zealand is forecast to be characterised by slightly higher than normal pressure to the southwest and southeast of New Zealand and lower pressure than normal to the northeast of the country. Weak easterly-quarter air flows are favoured.
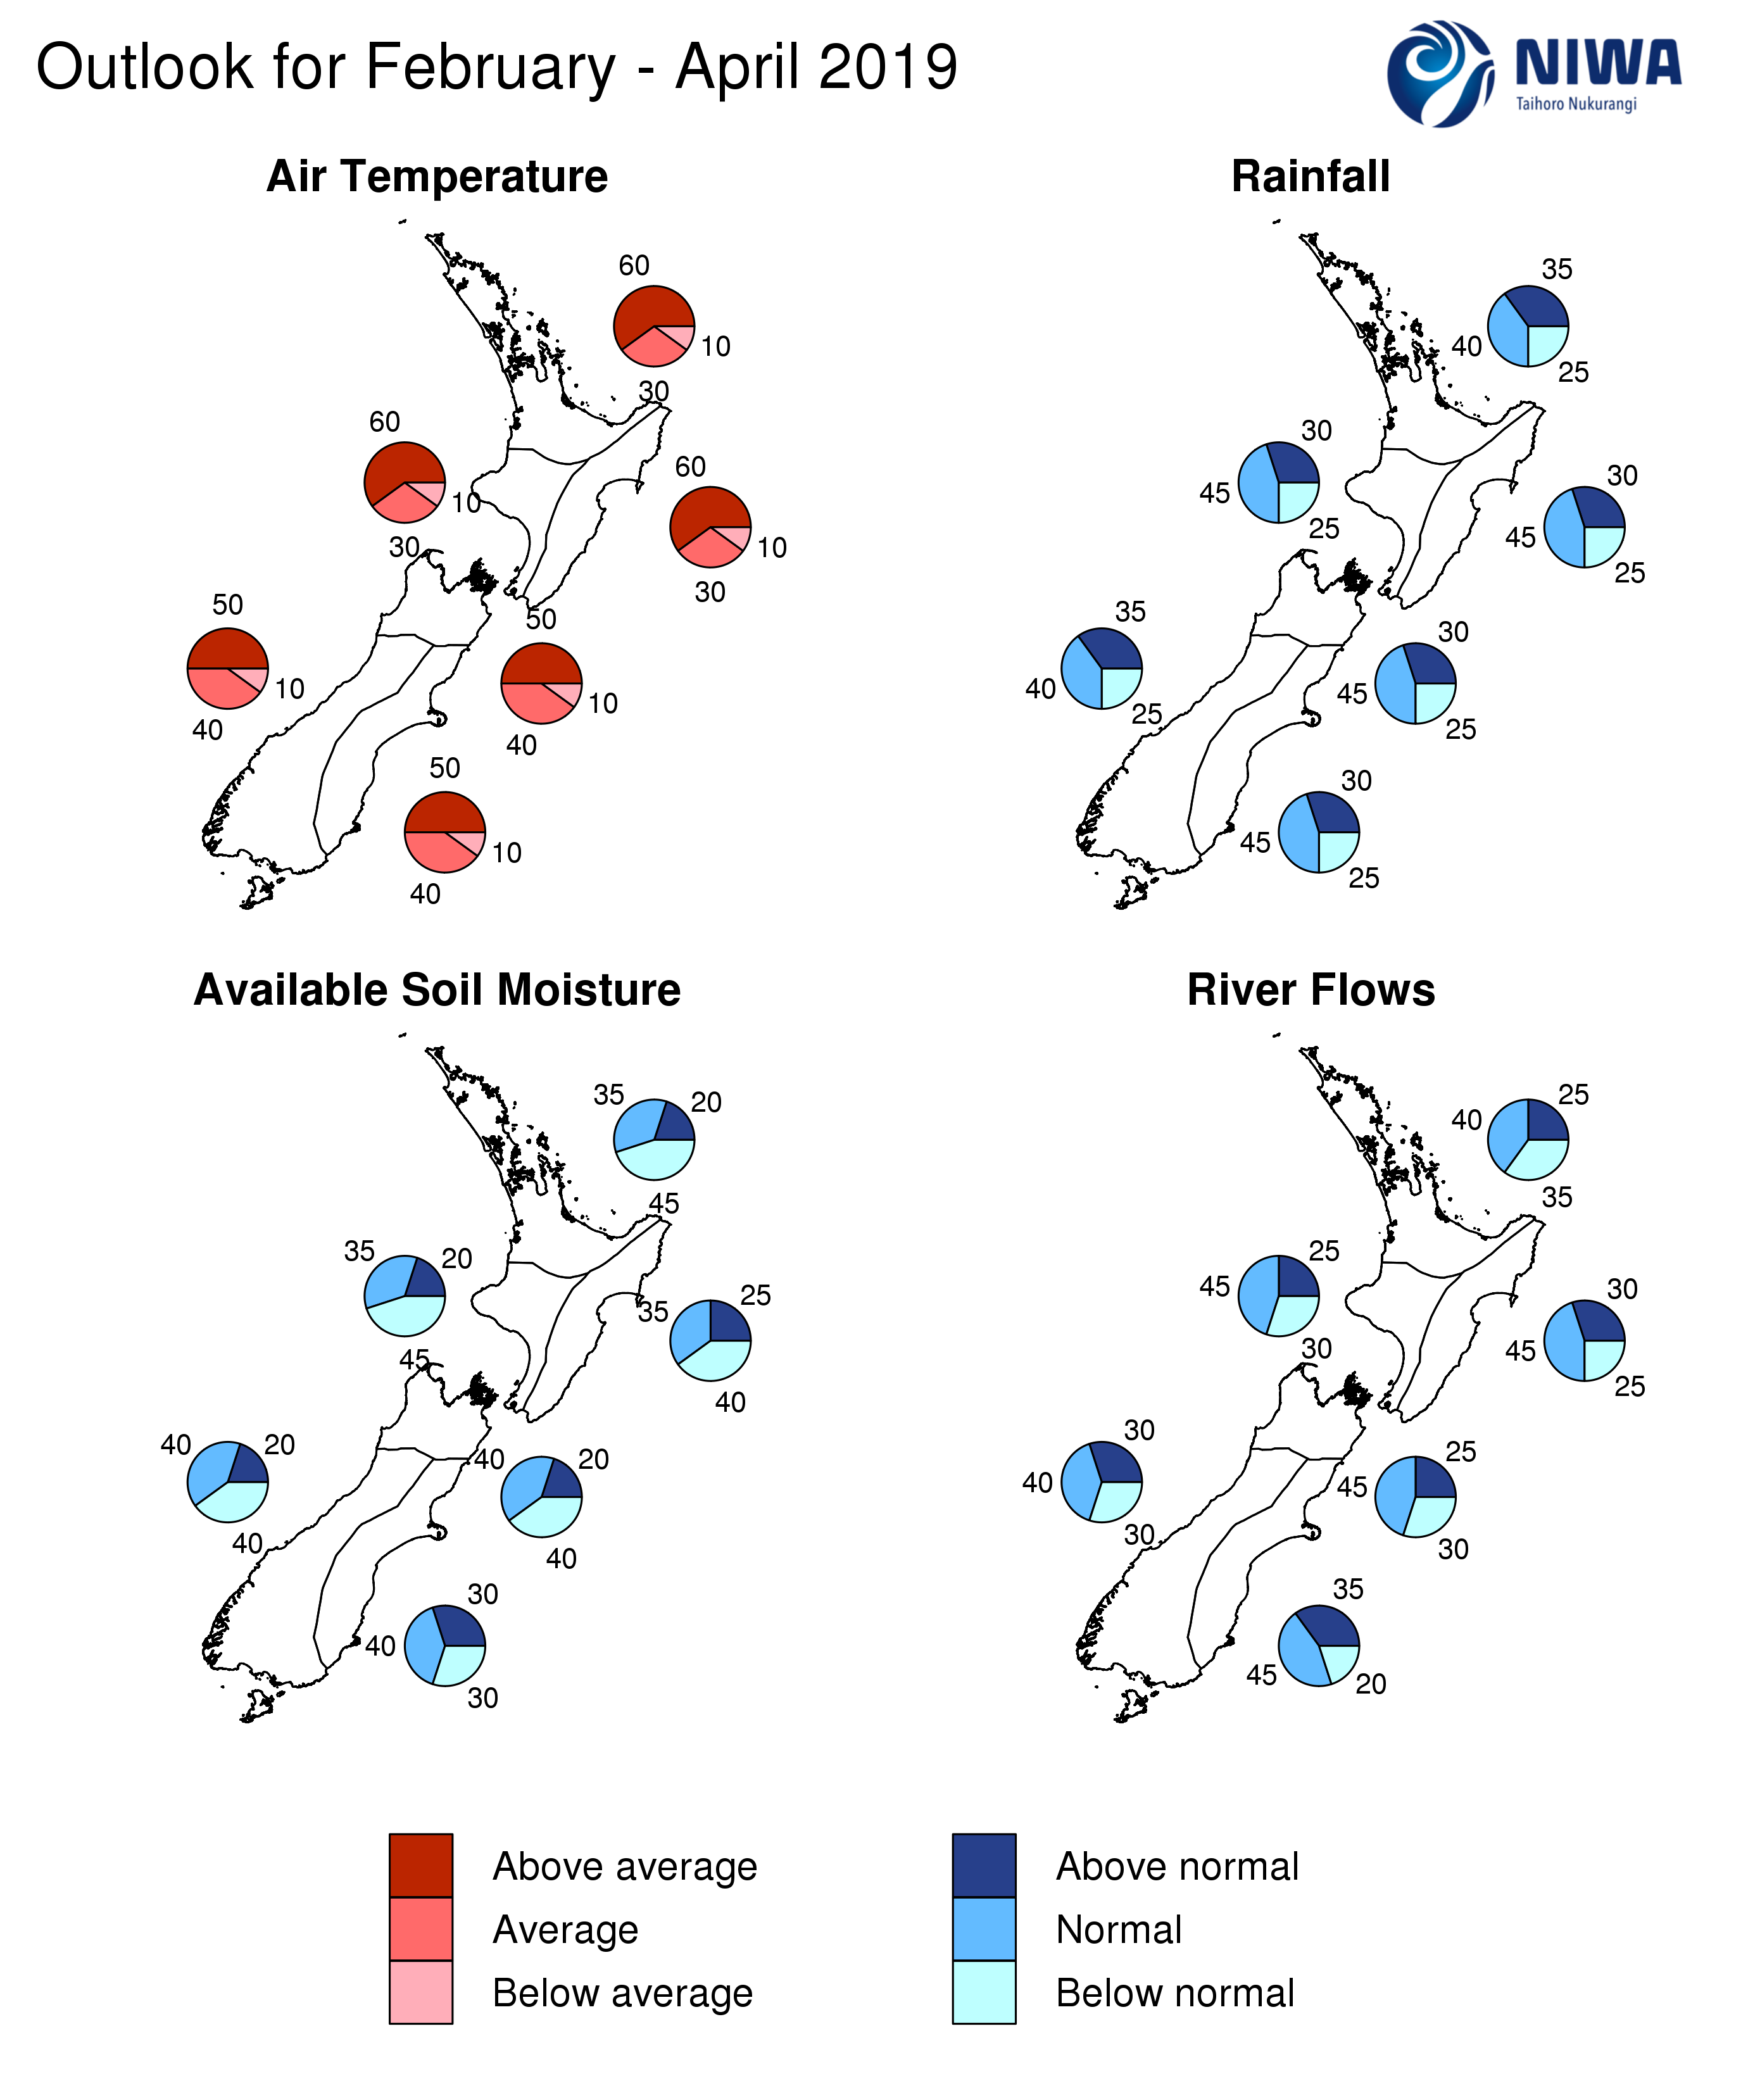
- Summer-like warmth and humidity may continue into autumn as mean temperatures through to April 2019 are most likely to be above average for all regions of New Zealand.
- February through April 2019 rainfall has about equal chances of being near normal or above normal in the north of the North Island and west of the South Island and near normal for all other regions.
- The Tasman Sea and sub-tropics north of New Zealand may become more active heading into late February and/or autumn, which may increase the risk for heavy rainfall events.
- While the ocean retreated from weak El Niño conditions during January 2019, the atmosphere responded to warmer than average waters in the central and western tropical Pacific. For New Zealand, El Nino is not expected to be a significant driver of circulation and climate over the next three months, but atmospheric patterns may occasionally be influenced by the tropics.
- The continuation of much warmer than average sea surface temperatures in the Tasman Sea and in New Zealand coastal waters may contribute extra warmth, moisture, and invigorate low pressure systems as they approach the country heading into autumn.
- For the current tropical cyclone season (November 2018 to April 2019), NIWA’s Southwest Pacific Tropical Cyclone Outlook indicates that the risk for New Zealand is near normal. On average, at least one ex-tropical cyclone passes within 550 km of New Zealand each year. Significant rainfall, damaging winds, and coastal damage can occur during these events.
February – April 2019 soil moisture levels are forecast to be below normal (45% chance) in the north and west of the North Island, about equally likely to be below normal or near normal (35-40% chance) in the east of the North Island, and north and west of the South Island, and most likely to be near normal in the east of the South Island.
February – April 2019 river flows are about equally likely to be normal (40% chance) or below normal (35% chance) in the north of the North Island and most likely to be near normal for all other regions of New Zealand.
Regional predictions for the February – April 2019 season
Northland, Auckland, Waikato, Bay of Plenty
The table below shows the probabilities (or percent chances) for each of three categories: above average, near average, and below average. In the absence of any forecast guidance there would be an equal likelihood (33% chance) of the outcome being in any one of the three categories. Forecast information from local and global guidance models is used to indicate the deviation from equal chance expected for the coming three-month period, with the following outcomes the most likely (but not certain) for this region:
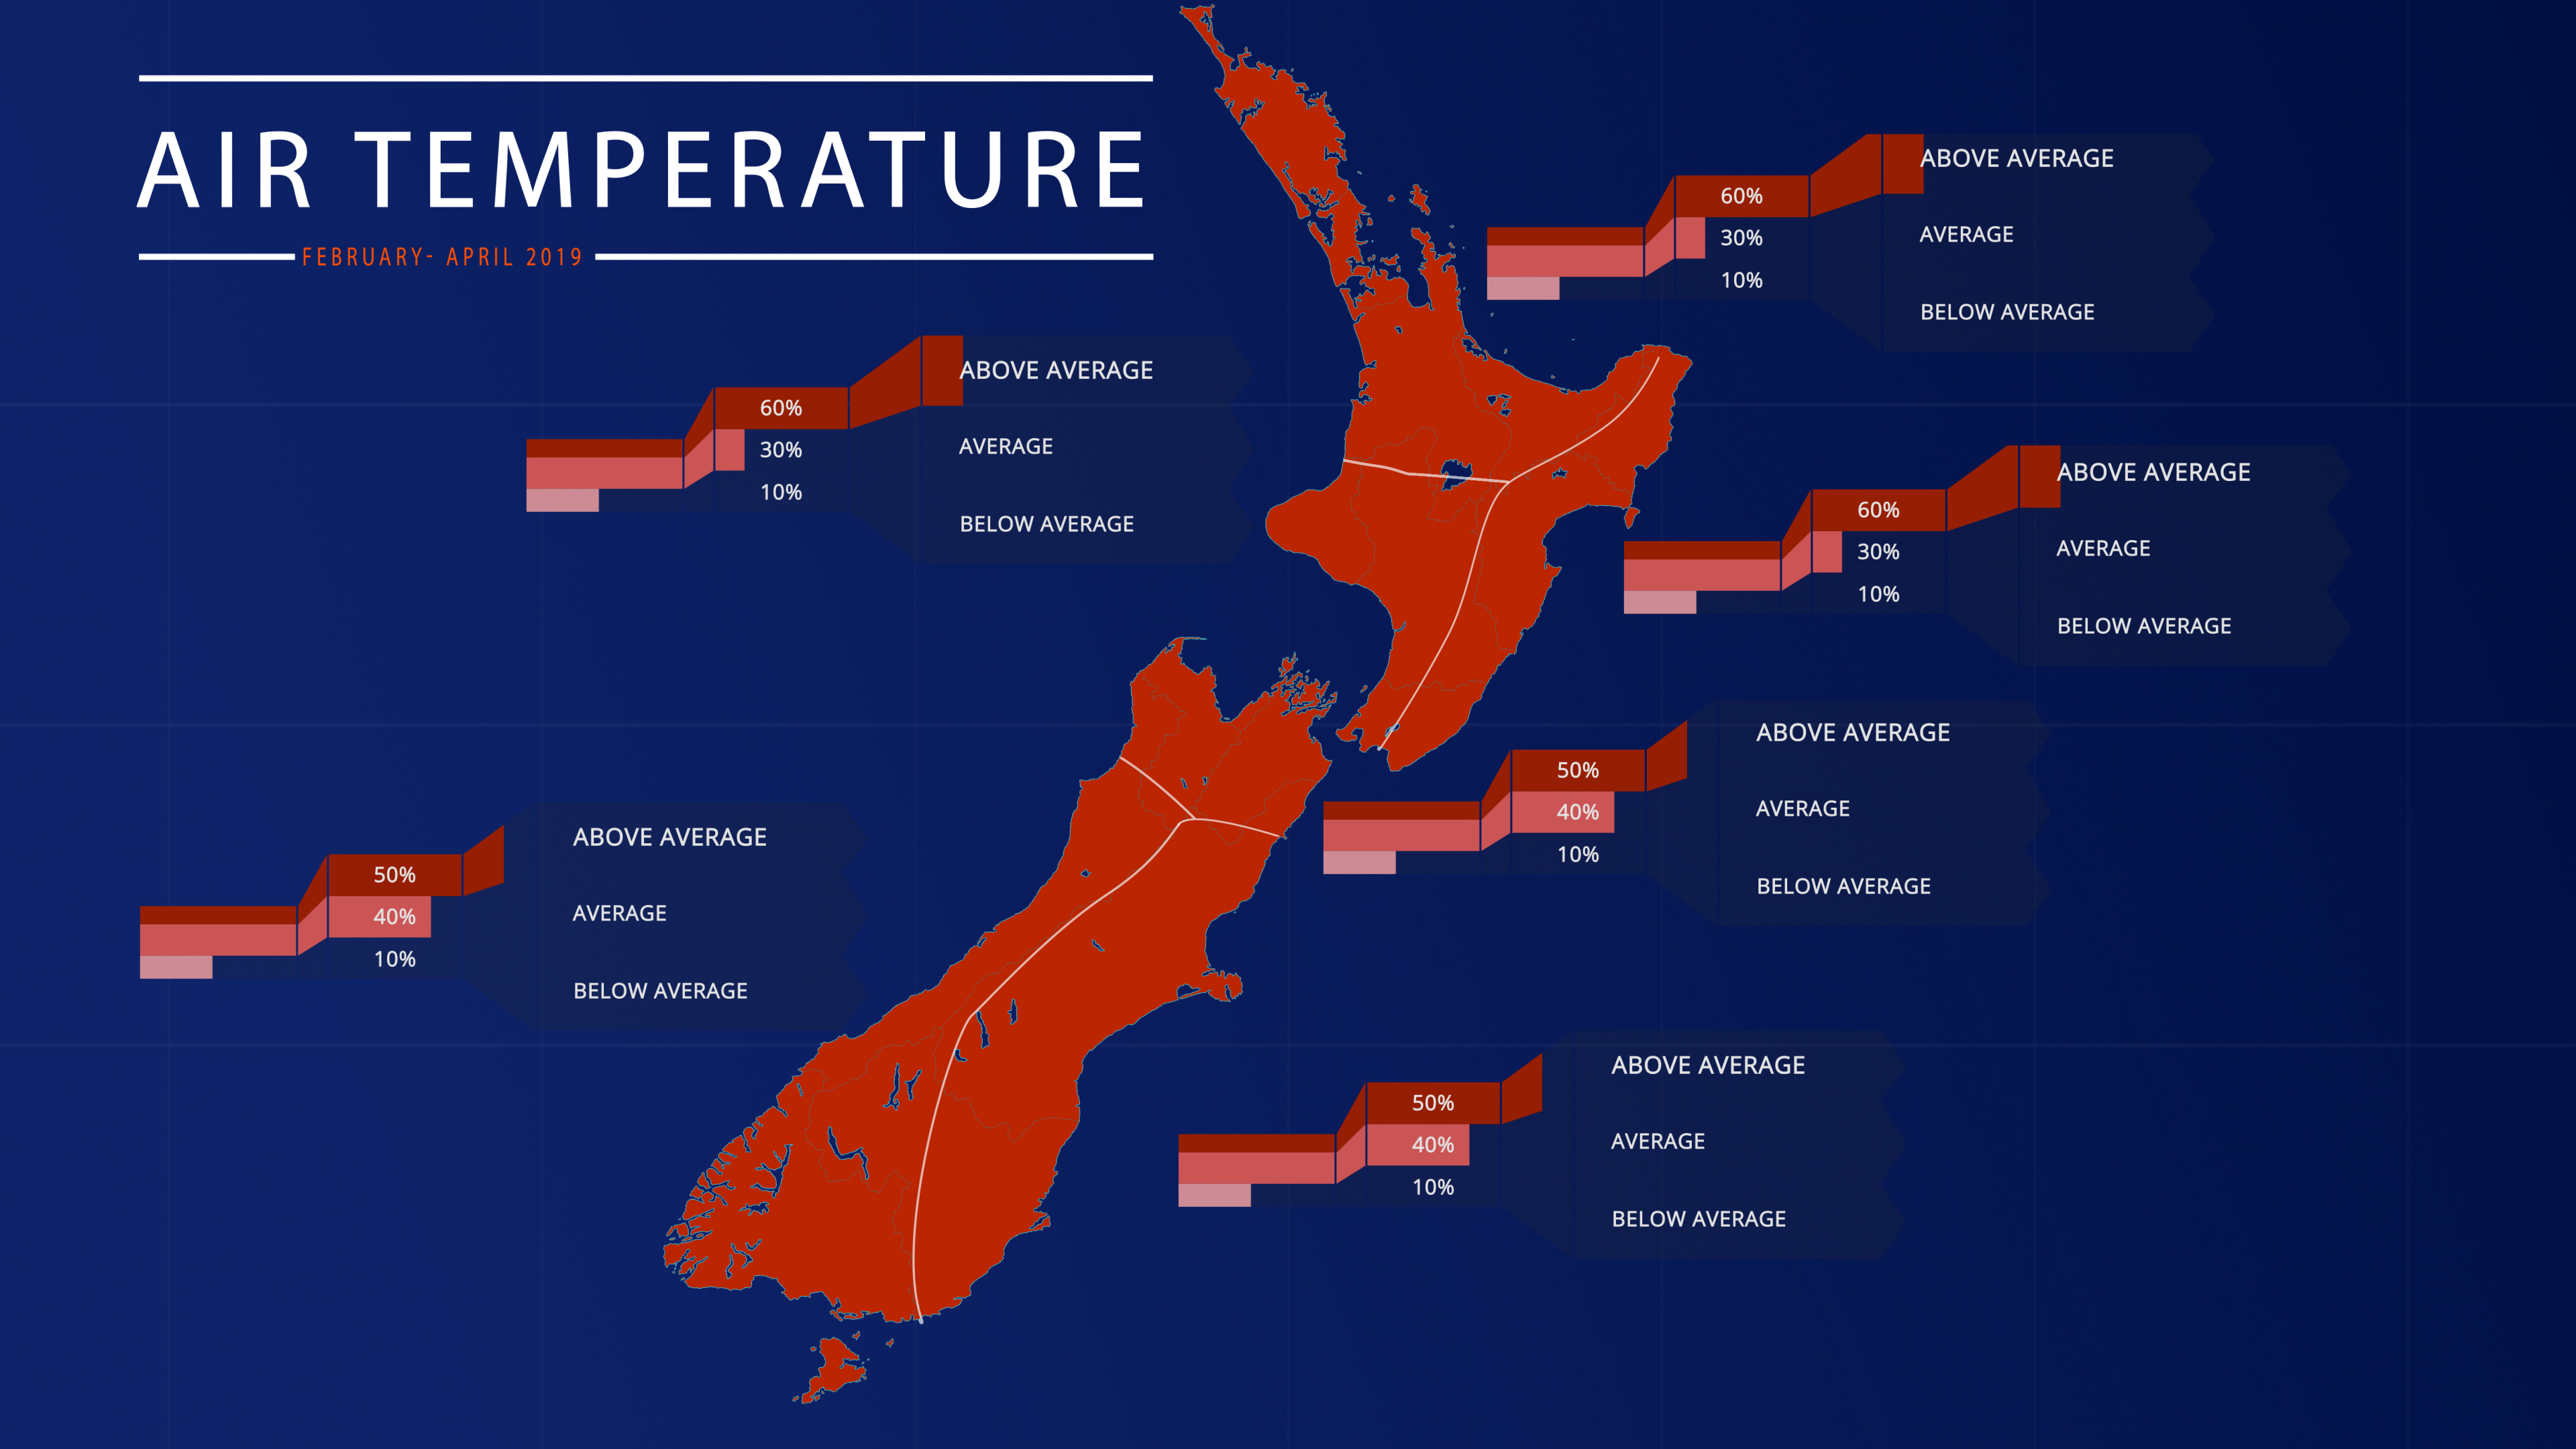
- Temperatures are very likely to be above average (60% chance).
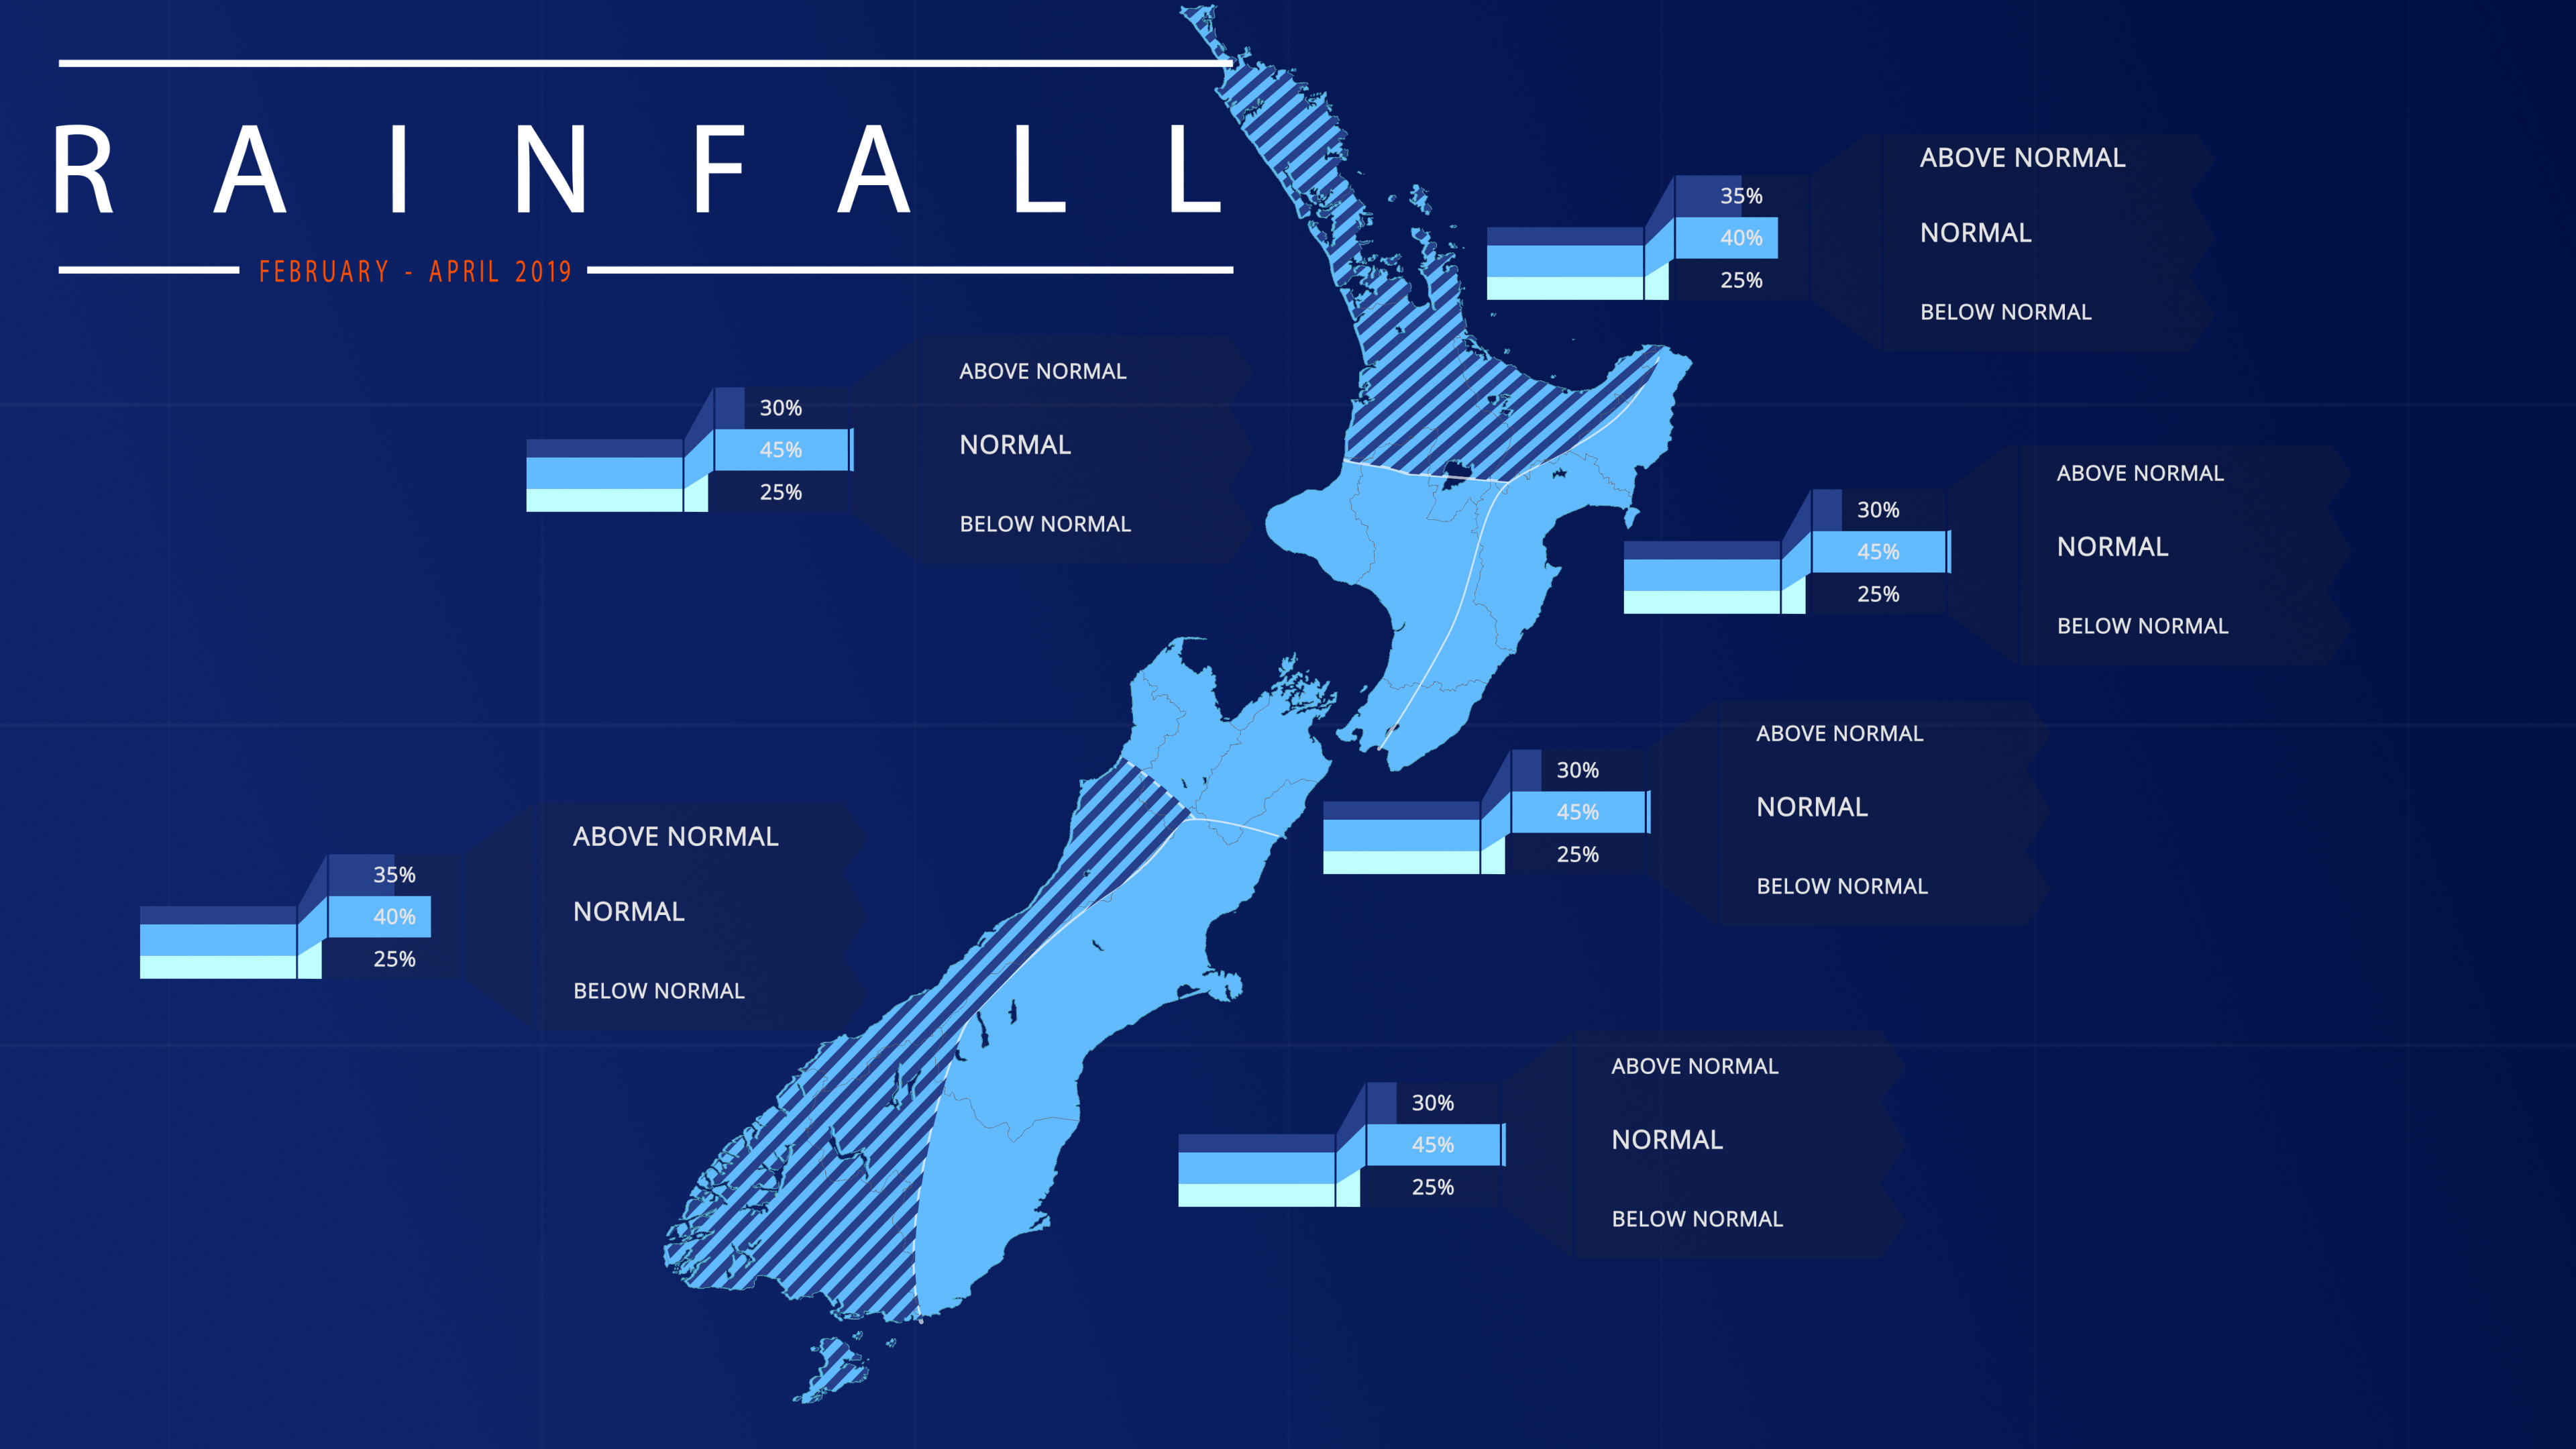
- Rainfall totals are about equally likely to be near normal (40% chance) or above normal (35% chance).
- Soil moisture levels are most likely to be below normal (45% chance).
- River flows are about equally likely to be near normal (40% chance) or below normal (35% chance).
The full probability breakdown is:
|
Temperature |
Rainfall |
Soil moisture |
River flows |
|
|
Above average |
60 |
35 |
20 |
25 |
|
Near average |
30 |
40 |
35 |
40 |
|
Below average |
10 |
25 |
45 |
35 |
Central North Island, Taranaki, Whanganui, Manawatu, Wellington
Probabilities are assigned in three categories: above average, near average, and below average.
- Temperatures are very likely to be above average (60% chance).
- Rainfall totals are most likely to be in the near normal range (45% chance).
- Soil moisture levels are most likely to be below normal (45% chance).
- River flows are most likely to be near normal (45% chance).
The full probability breakdown is:
|
Temperature |
Rainfall |
Soil moisture |
River flows |
|
|
Above average |
60 |
30 |
20 |
25 |
|
Near average |
30 |
45 |
35 |
45 |
|
Below average |
10 |
25 |
45 |
30 |
Gisborne, Hawke’s Bay, Wairarapa
Probabilities are assigned in three categories: above average, near average, and below average.
- Temperatures are very likely to be above average (60% chance).
- Rainfall totals are most likely to be in the near normal range (45% chance).
- Soil moisture levels are about equally likely to be below normal (40% chance) or near normal (35% chance).
- River flows are mostly likely to near normal (45% chance).
The full probability breakdown is:
|
Temperature |
Rainfall |
Soil moisture |
River flows |
|
|
Above average |
60 |
30 |
25 |
30 |
|
Near average |
30 |
45 |
35 |
45 |
|
Below average |
10 |
25 |
40 |
25 |
Tasman, Nelson, Marlborough, Buller
Probabilities are assigned in three categories: above average, near average, and below average.
- Temperatures are most likely to be above average (50% chance).
- Rainfall totals are most likely to be in the near normal range (45% chance).
- Although the coming three month period may start drier than normal in the north of the South Island, the Tasman Sea and sub-tropics to the north of New Zealand may become more active, increasing the risk for heavy rainfall events.
- Soil moisture levels are equally likely to be below normal (40% chance) or near normal (40% chance).
- River flows are most likely to be near normal (45% chance).
The full probability breakdown is:
|
Temperature |
Rainfall |
Soil moisture |
River flows |
|
|
Above average |
50 |
30 |
20 |
25 |
|
Near average |
40 |
45 |
40 |
45 |
|
Below average |
10 |
25 |
40 |
30 |
West Coast, Alps and foothills, inland Otago, Southland
Probabilities are assigned in three categories: above average, near average, and below average.
- Temperatures are most likely to be above average (50% chance).
- Rainfall totals are about equally likely to be near normal (40% chance) or above normal (35% chance).
- Soil moisture levels are equally likely to be below normal (40% chance) or near normal (40% chance).
- River flows are most likely to be near normal (40% chance).
The full probability breakdown is:
|
Temperature |
Rainfall |
Soil moisture |
River flows |
|
|
Above average |
50 |
35 |
20 |
30 |
|
Near average |
40 |
40 |
40 |
40 |
|
Below average |
10 |
25 |
40 |
30 |
Coastal Canterbury, east Otago
Probabilities are assigned in three categories: above average, near average, and below average.
- Temperatures are most likely to be above average (50% chance).
- Rainfall totals are most likely to be in the near normal range (45% chance).
- Soil moisture levels and river flows are most likely to be in the near normal range (40-45% chance).
The full probability breakdown is:
|
Temperature |
Rainfall |
Soil moisture |
River flows |
|
|
Above average |
50 |
30 |
30 |
35 |
|
Near average |
40 |
45 |
40 |
45 |
|
Below average |
10 |
25 |
30 |
20 |
Graphical representation of the regional probabilities
Background
Sea Surface Temperatures (SSTs) remained above average in the equatorial Pacific Ocean during January 2019, particularly near and west of the International Dateline, although declined slightly below the conventional threshold for El Niño.
The NINO3.4 Index anomaly weakened to +0.5˚C during January, meaning that NIWA’s technical oceanic definition for El Niño has ended after four months (September-December 2018). The largest SST anomalies persisted across the central and western part of the tropical Pacific Ocean, lending to the idea that the oceanic El Niño was much closer to the Modoki type rather than the canonical type (maximum SST anomalies located in the eastern Pacific). The NINO4 Index (in the western Pacific: 5oN-5oS, 170oW-120oW) observed an anomaly of +0.7˚C during January.
The atmosphere responded to the warm pool of water in the central and western Pacific for the second consecutive month. During traditional El Niño events, this response tends to take place farther east. Given that the current ENSO (El Niño – Southern Oscillation) event is relatively late in its life cycle, it appears quite unlikely that a classical coupling will occur over the next 3 months.
The probability for oceanic El Niño conditions, according to the consensus from international models, is 74% over February – April period. Compared to last month, the probabilities decreased for autumn 2019 (now 66%, down from 85%) and winter 2019 (now 48%, down from 62%).
However, later in 2019, long-range models indicate the potential re-emergence of oceanic El Niño conditions, which suggests the potential for a ‘protracted’ event. This means that above average SSTs may persist for more than a year across the equatorial Pacific.
The Southern Oscillation Index (SOI) decreased substantially from a positive value of +0.8 during December to -0.1 during January. Trade winds were close to normal east of the Dateline during January, however a westerly wind burst earlier in January in the far western Pacific triggered a downwelling Kelvin wave which was responsible for warming at depth (100-150 m) near and just east of the International Dateline.
New Zealand’s coastal waters for January 2019 remained much warmer than average, with marine heatwave conditions likely being reached in the east of the North Island. SSTs in the Tasman Sea were also well above average, particularly in the central and west, with anomalies of +2.0 to 3.0˚C at month’s end. For the month as a whole, the anomalies do not exceed those observed during the marine heatwave of summer 2017-18.
The forecast models are consistent in predicting above to well above average regional ocean temperatures over the next three-month period (February – April 2019). In the absence of a coupled ENSO event, these regional SSTs are likely to be a dominant driver of New Zealand’s climate over the next three month period.
For the second consecutive month, the Southern Annular Mode (SAM) remained largely positive, seeing only a brief negative spell in mid-January. The SAM is forecast to remain positive over the next two weeks, which favours settled weather in New Zealand.
Download
Seasonal climate outlook - February - April 2019 [3.5MB PDF]
Contacts
Chris Brandolino, Principal Scientist – Forecasting, NIWA National Climate Centre Tel (09) 375 6335, Mobile (027) 886 0014
Dr Brett Mullan, Principal Scientist, NIWA National Climate Centre Tel (04) 386 0508, Mobile (027) 294 1169
Notes to reporters and editors
- NIWA’s outlooks indicate the likelihood of climate conditions being at, above, or below average for the season as a whole. They are not ‘weather forecasts’. It is not possible to forecast precise weather conditions three months ahead of time.
- The outlooks are the result of the expert judgment of NIWA’s climate scientists. They take into account observations of atmospheric and ocean conditions and output from global and local climate models. The presence of El Niño or La Niña conditions and the sea surface temperatures around New Zealand can be a useful indicator of likely overall climate conditions for a season.
- The outlooks state the probability for above average conditions, near average conditions, and below average conditions for rainfall, temperature, soil moisture, and river flows. For example, for winter (June–July–August) 2007, for all the North Island, we assigned the following probabilities for temperature: · Above average: 60 per cent · Near average: 30 per cent · Below average: 10 per cent We therefore concluded that above average temperatures were very likely.
- This three-way probability means that a random choice would be correct only 33 per cent (or one-third) of the time. It would be like randomly throwing a dart at a board divided into three equal parts, or throwing a dice with three numbers on it. An analogy with coin tossing (a two-way probability) is not correct.
- A 50 per cent ‘hit rate’ is substantially better than guesswork, and comparable with the skill level of the best overseas climate outlooks. See, for example, analysis of global outlooks issued by the International Research Institute for Climate and Society based in the US published in the Bulletin of the American Meteorological Society (Goddard, L., A. G. Barnston, and S. J. Mason, 2003: Evaluation of the IRI’s “net assessment” seasonal climate forecasts 1997–2001. Bull. Amer. Meteor. Soc., 84, 1761–1781).
- Each month, NIWA publishes an analysis of how well its outlooks perform. This is available online and is sent to about 3500 recipients of NIWA’s newsletters, including many farmers. See www.niwa.co.nz/our-science/climate/publications/all/cu
- All outlooks are for the three months as a whole. There will inevitably be wet and dry days, and hot and cold days, within a season. The exact range in temperature and rainfall within each of the three categories varies with location and season. However, as a guide, the “near average” or middle category for the temperature predictions includes deviations up to ±0.5°C for the long-term mean, whereas for rainfall the “near normal” category lies between approximately 80 per cent and 115 per cent of the long-term mean.
- The seasonal climate outlooks are an output of a scientific research programme, supplemented by NIWA’s Capability Funding. NIWA does not have a government contract to produce these outlooks.
- Where probabilities are within 5% of one another, the term “about equally” is used.
Visit our media centre