Outlook summary
- The central Pacific El Niño event that arrived in March 2019 has ended, giving way to ENSO neutral conditions, owing to cooling sea surface temperatures (SSTs) in the tropical Pacific and a neutral Southern Oscillation Index (SOI) during August.
- SSTs in the central equatorial Pacific were 0.2˚C above average and the SOI was -0.2 for the month of August, both within the neutral range.
- Oceanic ENSO neutral will most likely continue (60% chance) over the next three months.
- An area of warmer than average seas in the west-central tropical Pacific is expected to occasionally influence New Zealand’s weather patterns, contributing to sub-tropical low pressure systems that can bring heavy rainfall.
- For September to November, air pressure is forecast to be lower than normal in, and particularly south of, the New Zealand region. This is forecast to bring more southwest quarter winds than normal for the season as a whole, although periodic easterly quarter winds are probable.
- September and at least the start of October are forecast to be particularly unsettled, along with an elevated risk for sharp cold snaps. Those with interests in New Zealand’s primary sectors (e.g. agriculture) should pay close attention to weather forecasts to assist with mitigating potential impacts.
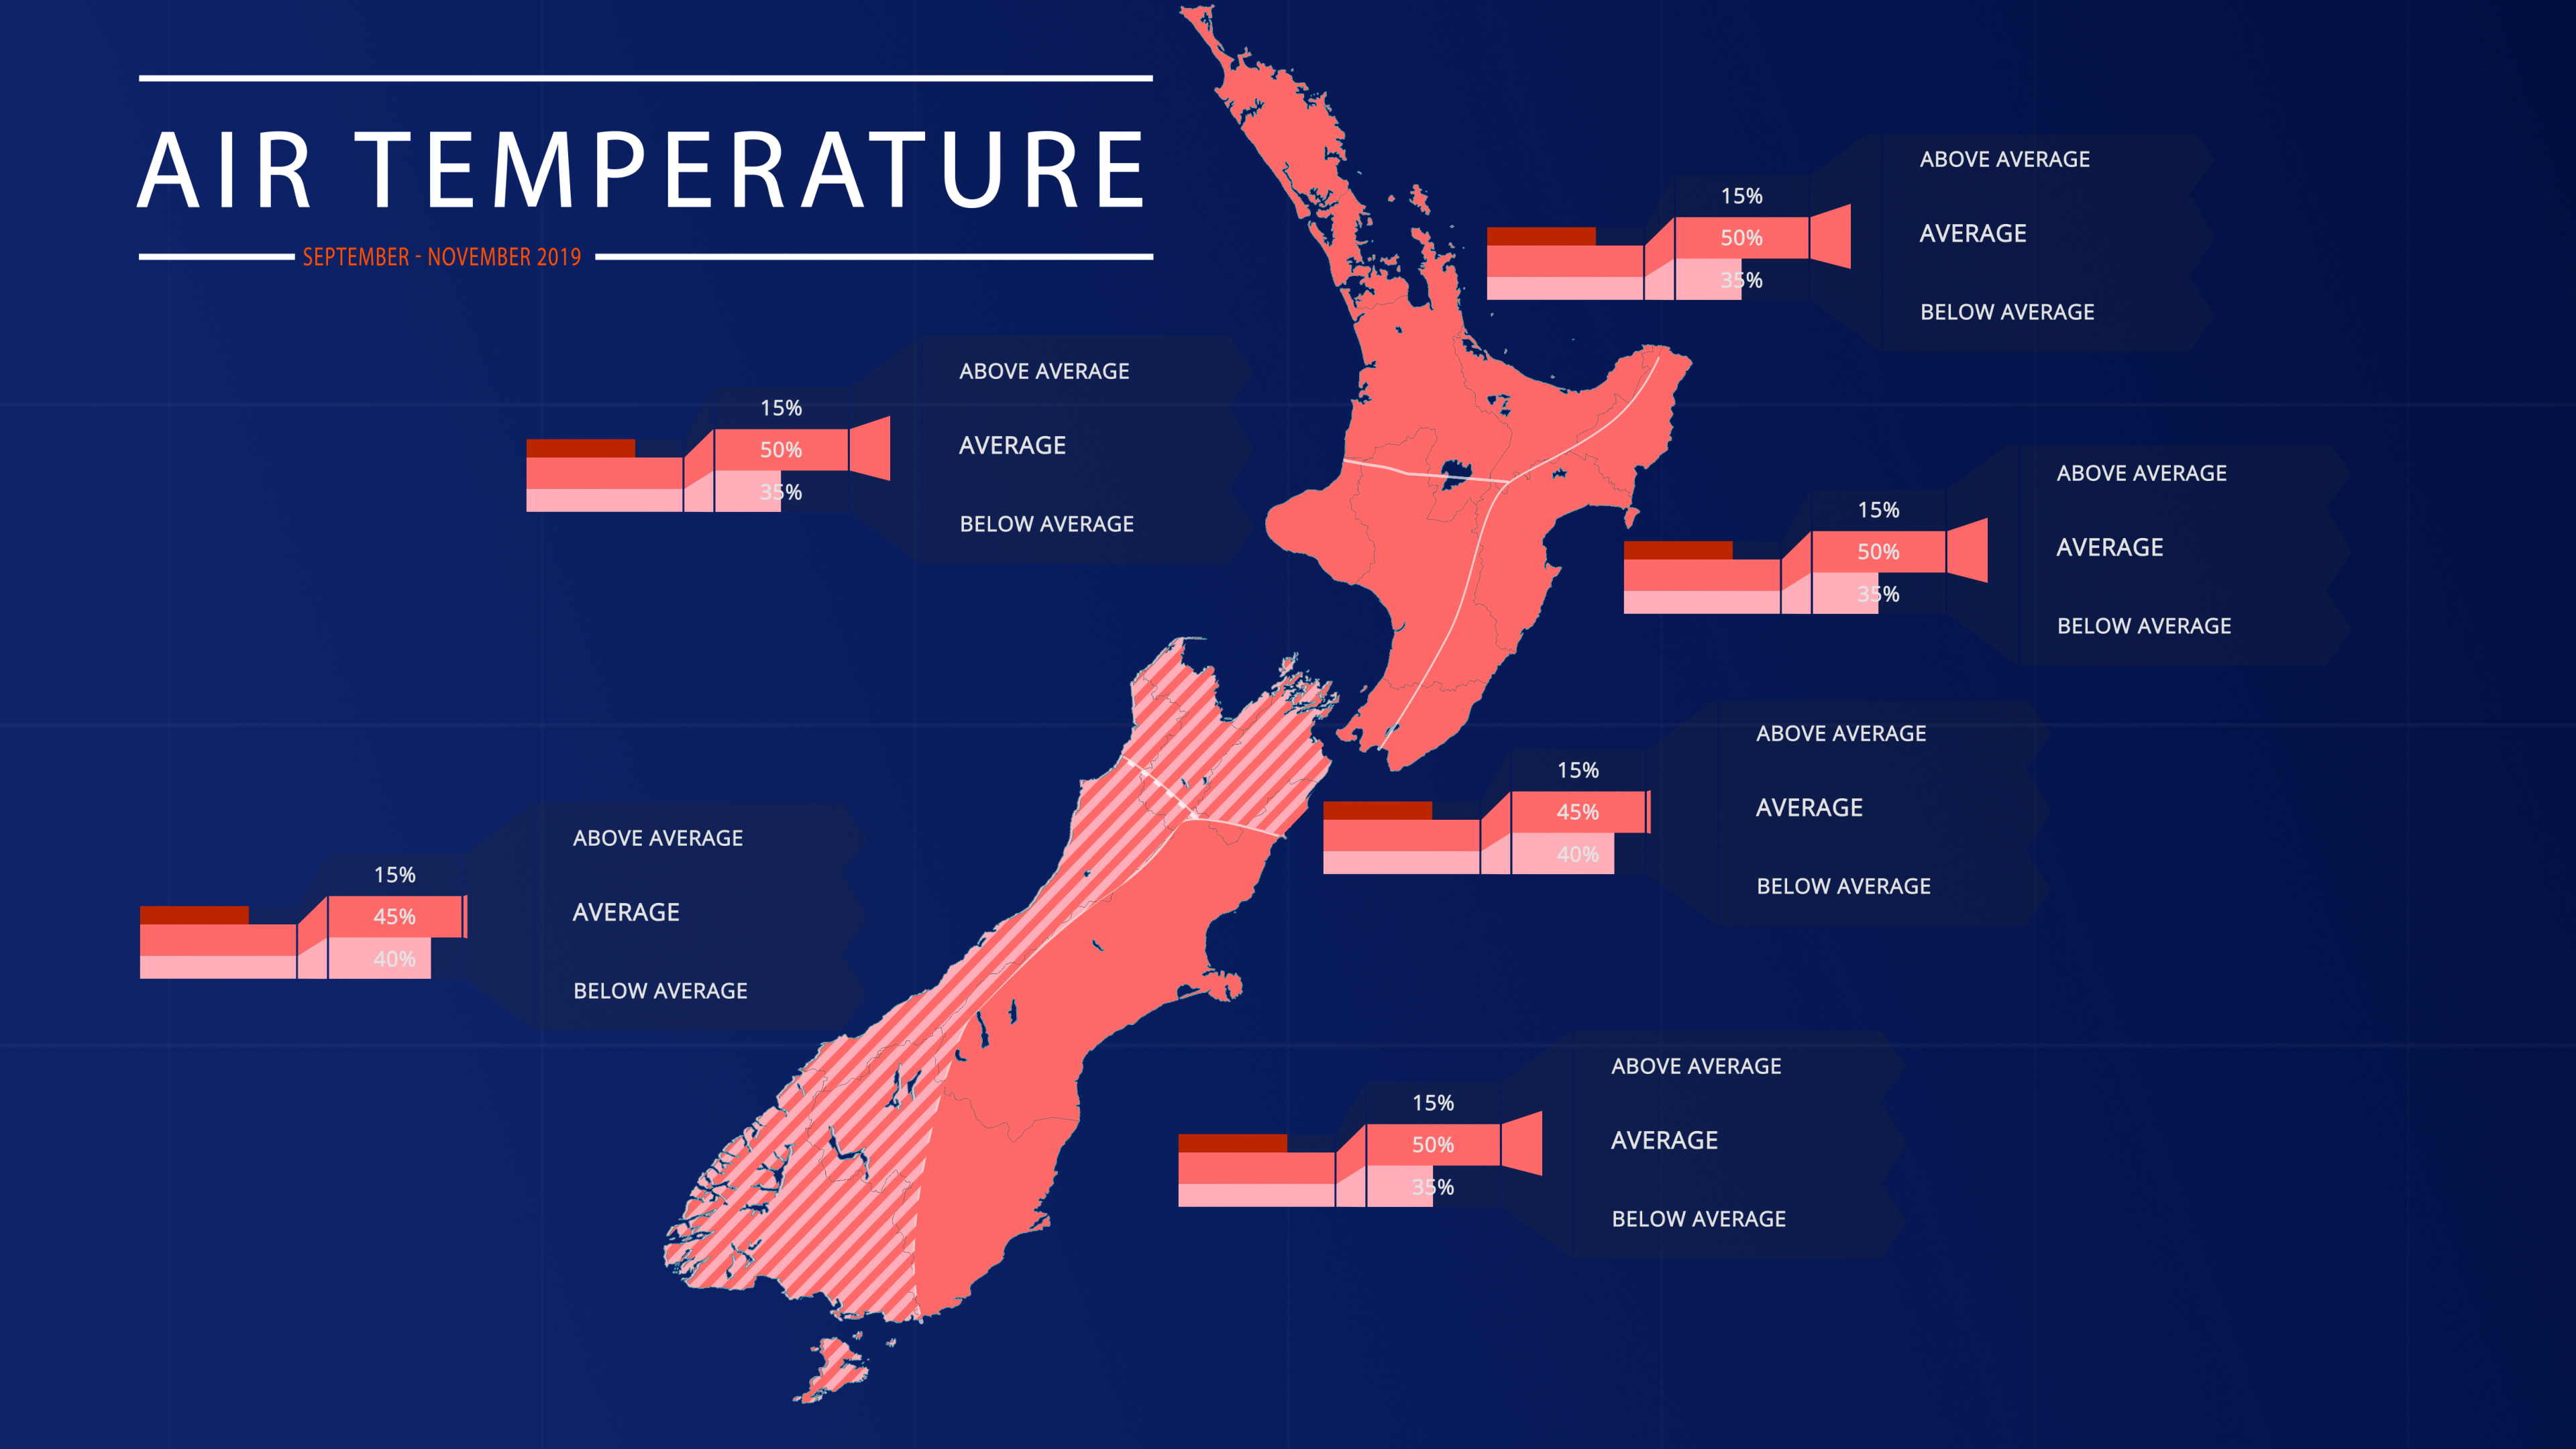
- Temperatures for the coming three month period are forecast to be near average for most of the country except the north and west of the South Islnd, where near average or below average temperatures are about equally likely.
- Rainfall is forecast to near or above normal for most of New Zealand except for the west of the South Island where near normal rainfall is most likely.
NIWA Principal Scientist – Forecasting Chris Brandolino and Meteorologist Ben Noll host New Zealand's seasonal climate outlook for September - November 2019.
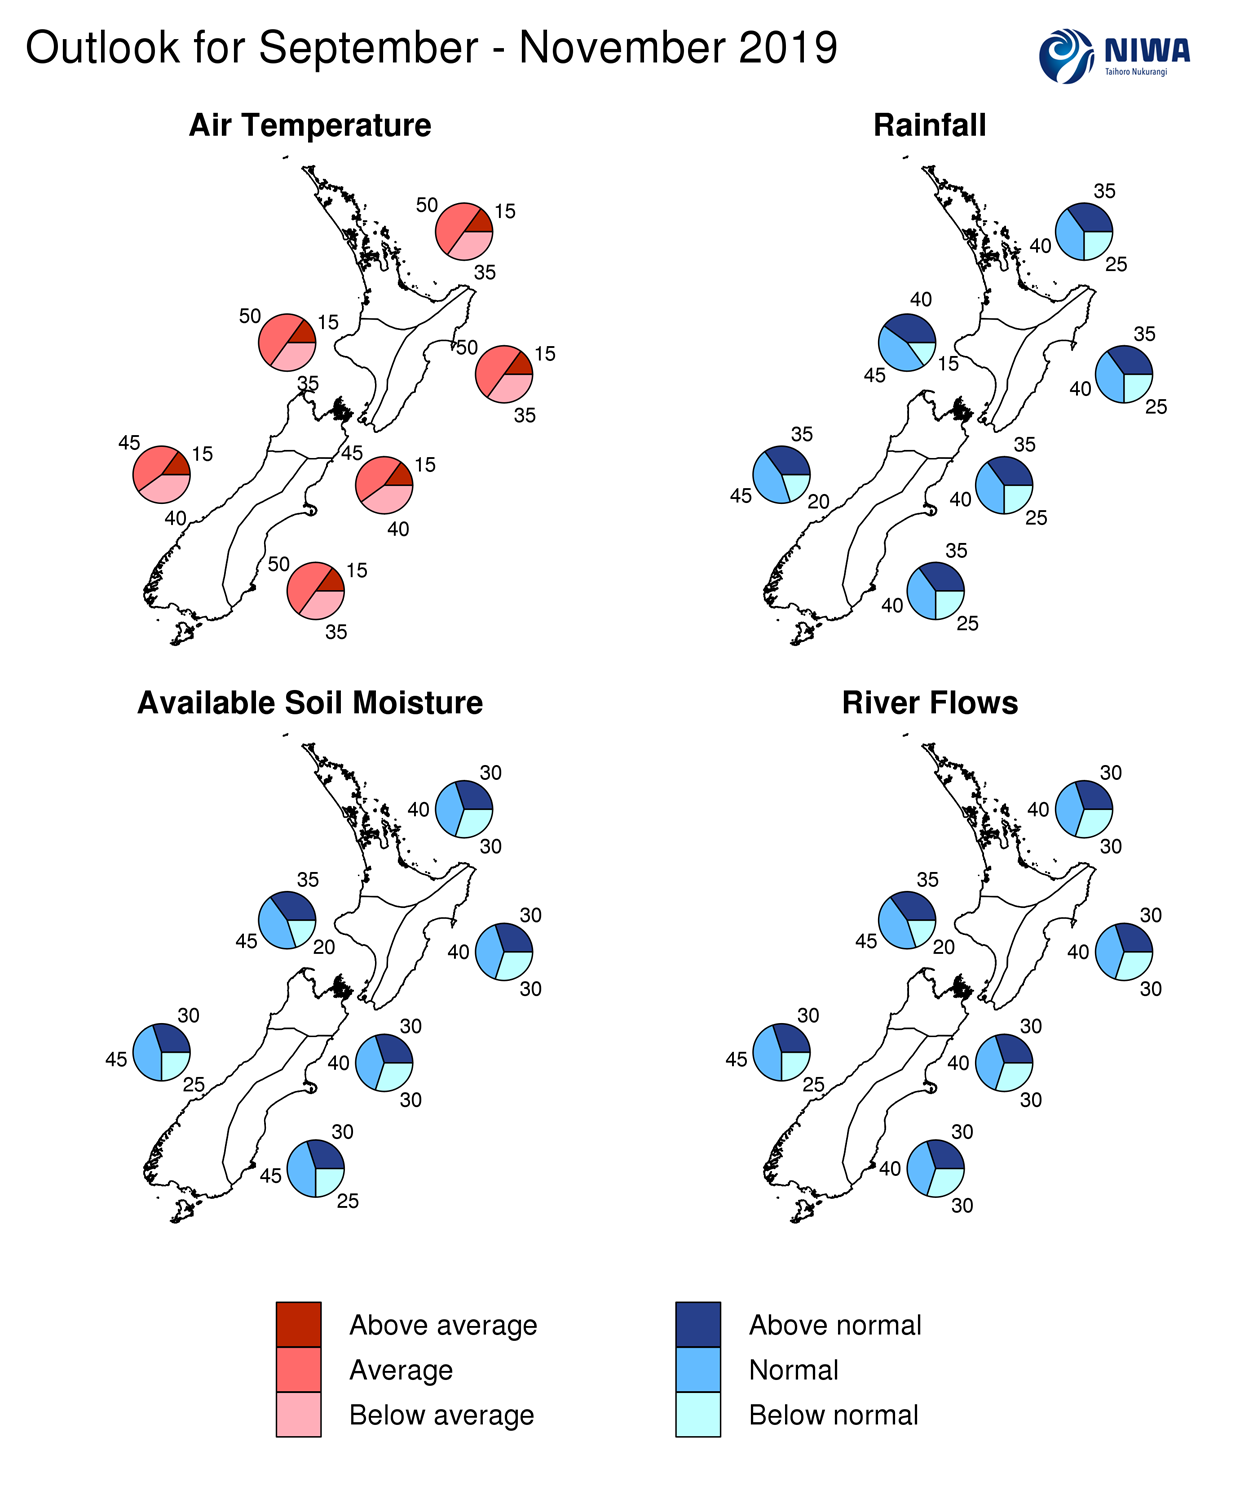
September – November 2019 temperatures have about equal chances of being near average (45% chance) or below average (40% chance) for the north and west of the South Island. All other regions of New Zealand will most likely experience near average temperatures (50% chance). There is an elevated risk for sharp cold snaps, especially for the South Island, during the first half of the season.
September – November 2019 rainfall is about equally likely to be near normal (40-45% chance) or above normal (35-40% chance) for much of New Zealand except for the west of the South Island where near normal rainfall (45% chance) is most likely.

September – November 2019 soil moisture levels and river flows are most likely to be near normal (40-45% chance) for all regions of New Zealand.
Regional predictions for the September – November 2019 season
Northland, Auckland, Waikato, Bay of Plenty
The table below shows the probabilities (or percent chances) for each of three categories: above average, near average, and below average. In the absence of any forecast guidance there would be an equal likelihood (33% chance) of the outcome being in any one of the three categories. Forecast information from local and global guidance models is used to indicate the deviation from equal chance expected for the coming three-month period, with the following outcomes the most likely (but not certain) for this region:
- Temperatures are most likely to be near average (50% chance).
- Rainfall totals are about equally likely to be near normal (40% chance) or above normal (35% chance).
- Soil moisture levels and river flows are most likely to be near normal (40% chance).
The full probability breakdown is:
|
Temperature |
Rainfall |
Soil moisture |
River flows |
|
|
Above average |
15 |
35 |
30 |
30 |
|
Near average |
50 |
40 |
40 |
40 |
|
Below average |
35 |
25 |
30 |
30 |
Central North Island, Taranaki, Whanganui, Manawatu, Wellington
Probabilities are assigned in three categories: above average, near average, and below average.
- Temperatures are most likely to be near average (50% chance).
- Rainfall totals are about equally likely to be near normal (45% chance) or above normal (40% chance).
- Soil moisture levels and river flows are most likely to be near normal (45% chance).
The full probability breakdown is:
|
Temperature |
Rainfall |
Soil moisture |
River flows |
|
|
Above average |
15 |
40 |
35 |
35 |
|
Near average |
50 |
45 |
45 |
45 |
|
Below average |
35 |
15 |
20 |
20 |
Gisborne, Hawke’s Bay, Wairarapa
Probabilities are assigned in three categories: above average, near average, and below average.
- Temperatures are most likely to be near average (50% chance).
- Rainfall totals are about equally likely to be near normal (40% chance) or above normal (35% chance).
- Soil moisture levels and river flows are most likely to be near normal (40% chance).
The full probability breakdown is:
|
Temperature |
Rainfall |
Soil moisture |
River flows |
|
|
Above average |
15 |
35 |
30 |
30 |
|
Near average |
50 |
40 |
40 |
40 |
|
Below average |
35 |
25 |
30 |
30 |
Tasman, Nelson, Marlborough, Buller
Probabilities are assigned in three categories: above average, near average, and below average.
- Temperatures are about equally likely to be near average (45% chance) or below average (40% chance).
- Rainfall totals are about equally likely to be near normal (40% chance) or above normal (35% chance).
- Soil moisture levels and river flows are most likely to be near normal (40% chance).
The full probability breakdown is:
|
Temperature |
Rainfall |
Soil moisture |
River flows |
|
|
Above average |
15 |
35 |
30 |
30 |
|
Near average |
45 |
40 |
40 |
40 |
|
Below average |
40 |
25 |
30 |
30 |
West Coast, Alps and foothills, inland Otago, Southland
Probabilities are assigned in three categories: above average, near average, and below average.
- Temperatures are about equally likely to be near average (45% chance) or below average (40% chance).
- Rainfall totals are most likely to be in the near normal range (45% chance).
- Soil moisture levels and river flows are most likely to be near normal (45% chance).
The full probability breakdown is:
|
Temperature |
Rainfall |
Soil moisture |
River flows |
|
|
Above average |
15 |
35 |
30 |
30 |
|
Near average |
45 |
45 |
45 |
45 |
|
Below average |
40 |
20 |
25 |
25 |
Coastal Canterbury, east Otago
Probabilities are assigned in three categories: above average, near average, and below average.
- Temperatures are most likely to be near average (50% chance).
- Rainfall totals are about equally likely to be near normal (40% chance) or above normal (35% chance).
- Soil moisture levels and river flows are most likely to be near normal (45% chance).
The full probability breakdown is:
|
Temperature |
Rainfall |
Soil moisture |
River flows |
|
|
Above average |
15 |
35 |
30 |
30 |
|
Near average |
50 |
40 |
45 |
45 |
|
Below average |
35 |
25 |
25 |
25 |
Graphical representation of the regional probabilities
Background
The NINO3.4 Index anomaly (in the central Pacific) for the month of August (to the 25th) was +0.20˚C, suggesting that oceanic ENSO neutral conditions have arrived. Warmth was steadfast in the NINO4 region (west-central Pacific) with a monthly value of +0.75˚C.
Upper-oceanic heat content anomalies continued to decrease, but remained slightly above average in the west-central equatorial Pacific. In the eastern part of the basin, heat content was below normal for the time of year. Overall, this distribution of heat content across the Pacific reflects ENSO neutral conditions, but with a slight lean toward El Niño-Modoki.
During August, above normal rainfall occurred from the eastern Maritime Continent into the western Pacific, with below normal rainfall just north of the equator in the central Pacific. This remained broadly consistent with El Niño Modoki conditions.
Trade winds were slightly weaker than normal in the eastern Pacific and slightly stronger than normal in the west-central Pacific. During September, reduced trades are forecast to west of the International Dateline, which may help to sustain the warm pool of water in the NINO4 region.
On the other hand, stronger than normal trade winds are expected in the east-central tropical Pacific, which may lead to additional cooling of SSTs.
According to the consensus from international models, oceanic ENSO-neutral conditions are most likely at 59% chance for the September – November period with El Niño at 33% chance. For the December 2019 – February 2020 period, the probability for neutral conditions is 49% with the chance for El Niño increasing to 41%. For the March – May 2020 period, the probability for neutral conditions and El Niño is 55% and 43%, respectively.
New Zealand’s coastal water temperatures for August 2019 cooled compared to July for all regions except the east of the North Island, where a slight increase occurred. The east of the South Island remains the most anomalously warm coastal region with the rest of New Zealand experiencing near or slightly above average coastal SSTs. Elsewhere, SSTs in the Southwest Pacific remain above average for the time of year and near or above average in the Tasman Sea.
In other words, the warm seas that helped to modify sub-Antarctic air masses earlier in the season have now cooled.
New Zealand Coastal Sea Surface Temperatures during August 2019. [Derived by interpolating daily SSTs from NOAA OISSTv2 to coastal grid-points and averaging along the coastlines of the 6 forecast regions].
|
North NI |
West NI |
East NI |
North SI |
West SI |
East SI |
|
+0.20˚C |
+0.32˚C |
+0.11˚C |
+0.31˚C |
+0.22˚C |
+0.76˚C |
The Southern Annular Mode (SAM) was negative for most of August. For September, the SAM is forecast to become strongly negative during the first week. This supports unsettled weather around New Zealand.
The Madden Julian Oscillation’s weak signature during August is expected to become more active as the month of September progresses. Historically, phases 6 through 1 have brought cooler than average temperatures to New Zealand during the month of September – phase 6 is expected to be reached by mid-month.
During late August 2019, a Sudden Stratospheric Warming (SSW) event started to unfold in the polar stratosphere, about 30 km above Antarctica. SSWs represent a dramatic warming of the air at the stratopsheric level, where a minor event is defined as a warming of at least 25˚C in less than a week’s time and a major event involves both a substantial warming as well as a split of the stratospheric polar vortex.
The flow-on impacts to sensible weather can take several days to weeks as the SSW can encourage a weaker polar vortex (ring of cold, stormy conditions typically locked up over the pole), allowing ‘streamers’ or pockets of polar air to break off into the mid-latitudes.
Historically speaking, there have only been two SSWs on record in the Southern Hemisphere, one in September 2002 (major) and another in September 2010 (minor). SSWs are more common in the Northern Hemisphere. For New Zealand, the 2002 SSW event resulted in a significant cold outbreak in October while the 2010 event was associated with record rainfall during September.
Consequently, there is an elevated risk for periods of unusually active weather during spring 2019, including sharp cold snaps, especially in the first half of the season.
Forecast Confidence
Temperature
Forecast confidence for temperature is above normal, due to in large part to good agreement among the dynamical models. Additionally, a distinct climate driver (SSW) is present, which will likely influence New Zealand’s weather patterns into October.
Rainfall
Forecast confidence for rainfall is near normal. While there is good agreement for normal or above normal rainfall for much of the country, this is offset by several models indicating an opposing outcome (normal or below normal rainfall).
Download
Seasonal climate outlook for September - November 2019 [PDF 67KB]
