Outlook summary
- The lack of a strong climate driver will likely be associated with more variability in Aotearoa New Zealand’s weather patterns during the coming months.
- La Niña Watch remains active, but the event is less advanced compared to this time last year. The short-term influence on New Zealand’s climate likely won’t be as substantial, but is expected to grow over the next three months. For more information, see the Background.
- Over the next three months, high pressure is expected to become more common near and east of the South Island, which may increase the chance for dry spells for some regions. This is expected to be associated with mixed northeasterly and westerly wind flow anomalies.
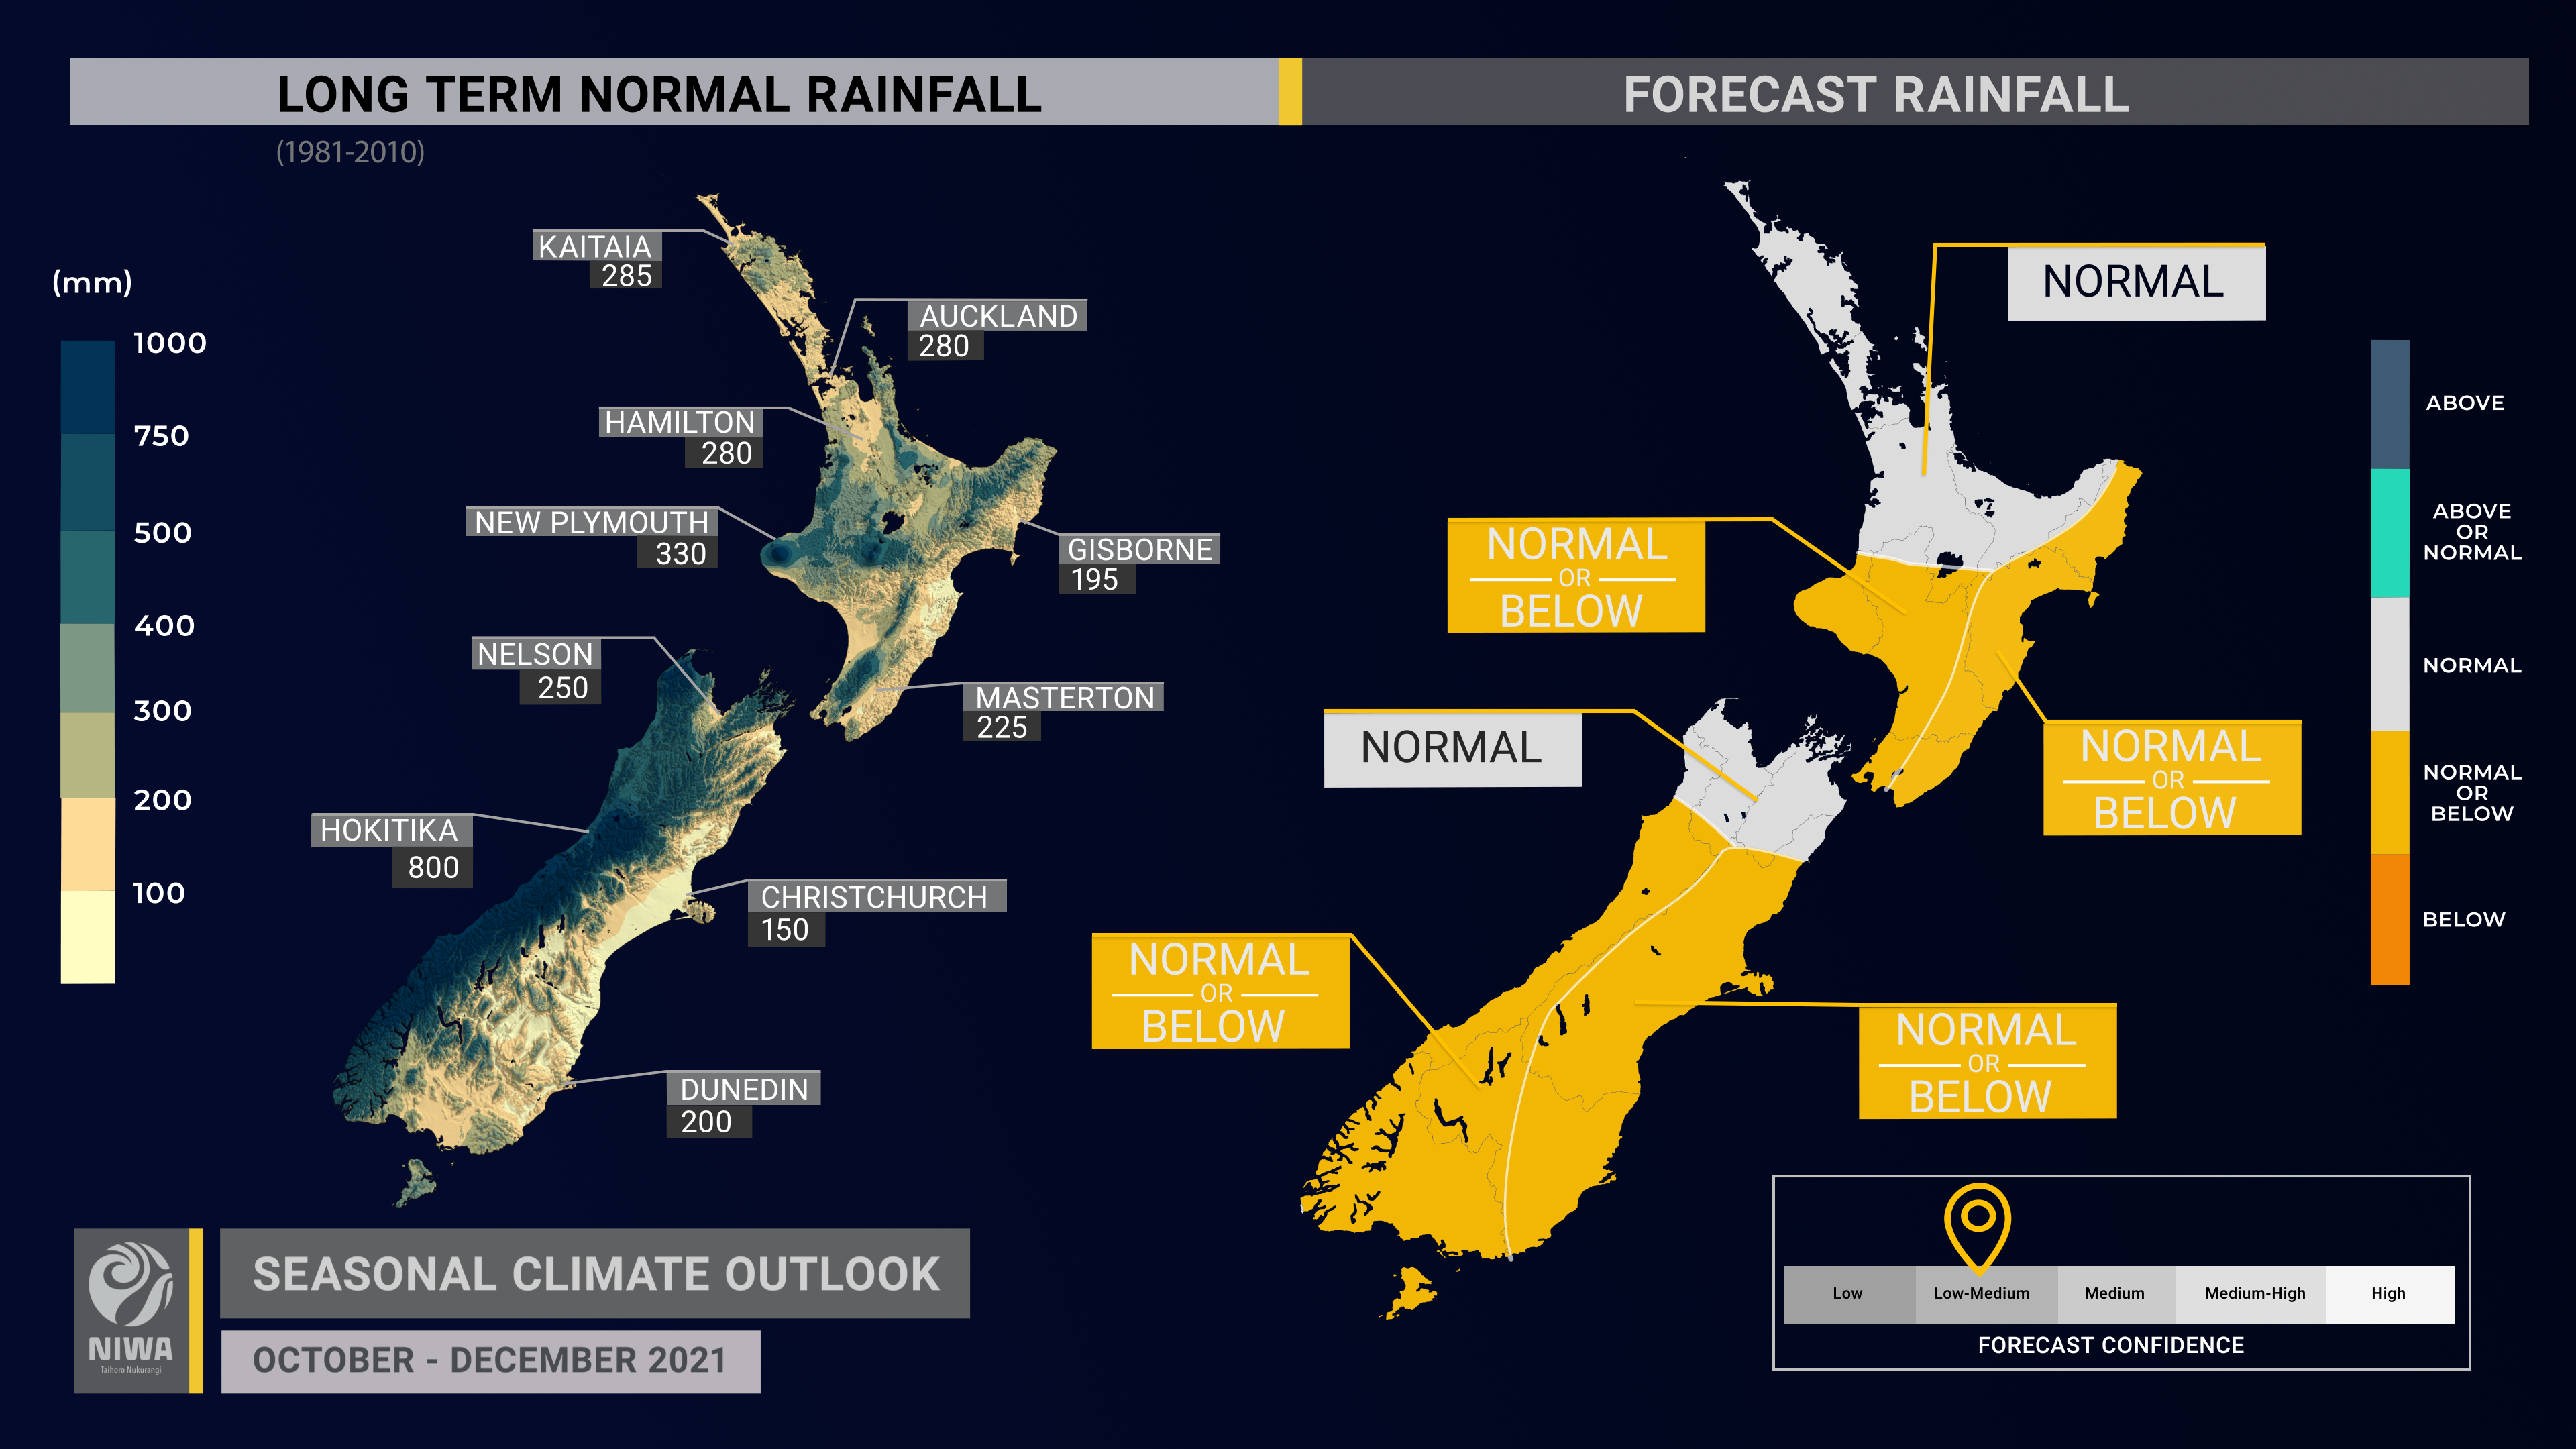
- October-December rainfall is most likely to be near normal in the north of both islands and about equally likely to be near normal or below normal in all other regions. The first half of October, however, is expected to be unsettled, with periods of rain and possible thunderstorms. The chance for dry spells may increase over time.
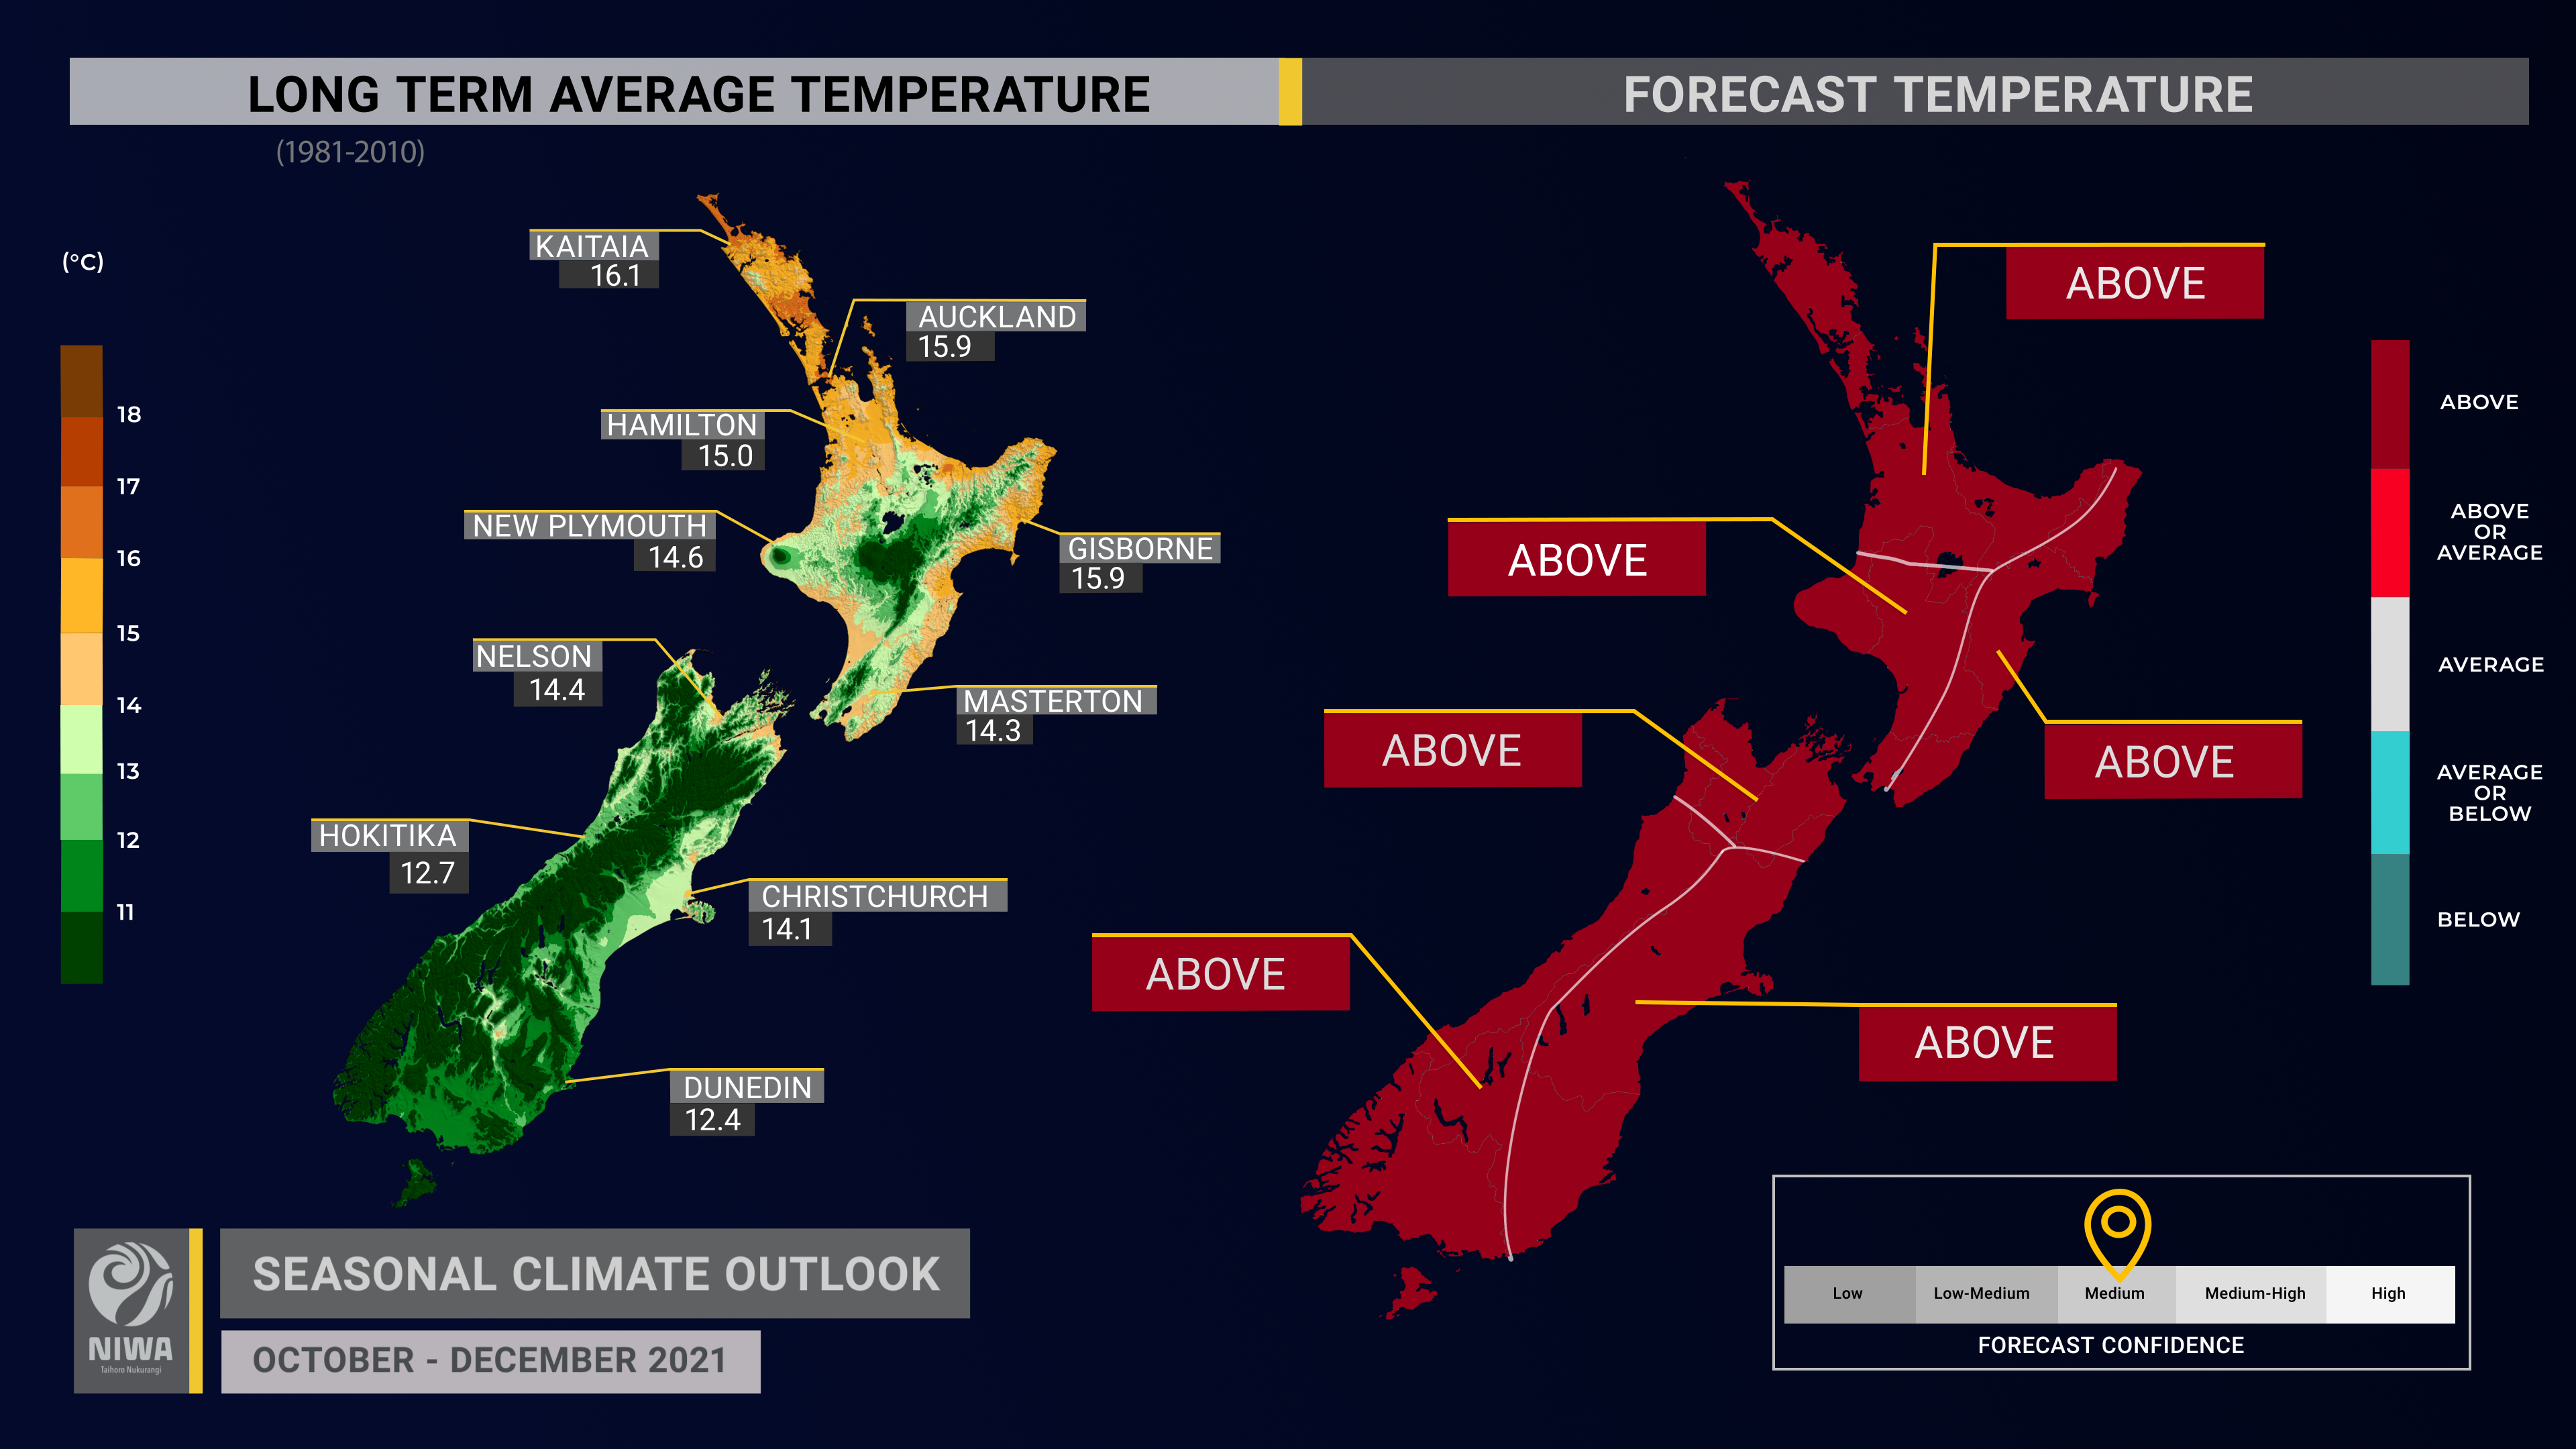
- Temperatures are very likely to be above average across New Zealand. More northeasterly winds are expected to cause periods of warmth and humidity, such as in early October.
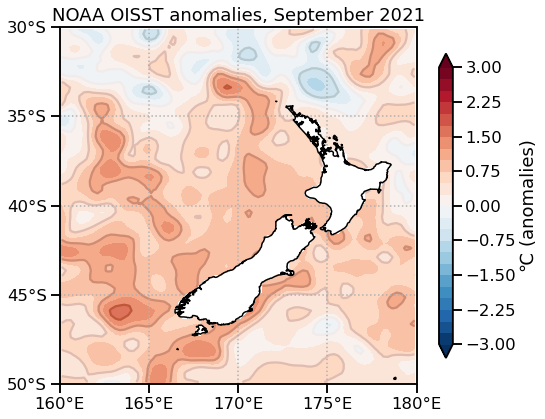
- NZ’s coastal sea surface temperatures (SSTs) were 0.4˚C to 1.0˚C above average during September and are predicted to become more unusually warm by November-December.
- Soil moisture levels are most likely to be below normal in the west of the South Island and about equally likely to be near normal or below normal in all other regions.
- River flows are most likely to be below normal in the west and east of the South Island and about equally likely to be near normal or below normal in all other regions.
Regional predictions for October – December 2021
Northland, Auckland, Waikato, Bay of Plenty
The table below shows the probabilities (or percent chances) for each of three categories: above average, near average, and below average. In the absence of any forecast guidance there would be an equal likelihood (33% chance) of the outcome being in any one of the three categories. Forecast information from local and global guidance models is used to indicate the deviation from equal chance expected for the coming three-month period, with the following outcomes the most likely (but not certain) for this region:
- Temperatures are very likely to be above average (60% chance).
- Rainfall totals are most likely to be near normal (45% chance).
- Soil moisture and river flows are about equally likely to be below normal (45% chance) or near normal (40% chance).
The full probability breakdown is:
|
Temperature |
Rainfall |
Soil moisture |
River flows |
|
|
Above average |
60 |
30 |
15 |
15 |
|
Near average |
35 |
45 |
40 |
40 |
|
Below average |
05 |
25 |
45 |
45 |
Central North Island, Taranaki, Whanganui, Manawatu, Wellington
Probabilities are assigned in three categories: above average, near average, and below average.
- Temperatures are very likely to be above average (60% chance).
- Rainfall totals are about equally likely to be near normal (40% chance) or below normal (35% chance).
- Soil moisture and river flow levels are about equally likely to be below normal (45% chance) or near normal (40% chance).
The full probability breakdown is:
|
Temperature |
Rainfall |
Soil moisture |
River flows |
|
|
Above average |
60 |
25 |
15 |
15 |
|
Near average |
35 |
40 |
40 |
40 |
|
Below average |
05 |
35 |
45 |
45 |
Gisborne, Hawke’s Bay, Wairarapa
Probabilities are assigned in three categories: above average, near average, and below average.
- Temperatures are very likely to be above average (60% chance).
- Rainfall totals are about equally likely to be near normal (40% chance) or below normal (35% chance).
- Soil moisture levels increased during September following normal or above normal rainfall, but the tendency for more high pressure systems can contribute to dry spells in the months to come.
- Soil moisture and river flows are equally likely to be near normal (45% chance) or below normal (45% chance).
The full probability breakdown is:
|
Temperature |
Rainfall |
Soil moisture |
River flows |
|
|
Above average |
60 |
25 |
10 |
10 |
|
Near average |
35 |
40 |
45 |
45 |
|
Below average |
05 |
35 |
45 |
45 |
Tasman, Nelson, Marlborough, Buller
Probabilities are assigned in three categories: above average, near average, and below average.
- Temperatures are very likely to be above average (60% chance).
- Rainfall totals are most likely to be near normal (40% chance).
- Soil moisture and river flows are equally likely to be near normal (40% chance) or below normal (40% chance).
The full probability breakdown is:
|
Temperature |
Rainfall |
Soil moisture |
River flows |
|
|
Above average |
60 |
30 |
20 |
20 |
|
Near average |
35 |
40 |
40 |
40 |
|
Below average |
05 |
30 |
40 |
40 |
West Coast, Alps and foothills, inland Otago, Southland
Probabilities are assigned in three categories: above average, near average, and below average.
- Temperatures are very likely to be above average (65% chance).
- Rainfall totals are about equally likely to be below normal (40% chance) or near normal (35% chance).
- The development of La Niña-like patterns may contribute to drier patterns in the coming months around the hydro lake areas.
- Soil moisture and river flows are most likely to be below normal (45% chance).
The full probability breakdown is:
|
Temperature |
Rainfall |
Soil moisture |
River flows |
|
|
Above average |
65 |
25 |
20 |
20 |
|
Near average |
30 |
35 |
35 |
35 |
|
Below average |
05 |
40 |
45 |
45 |
Coastal Canterbury, east Otago
Probabilities are assigned in three categories: above average, near average, and below average.
- Temperatures are very likely to be above average (65% chance).
- Rainfall totals are about equally likely to be near normal (40% chance) or below normal (35% chance).
- Soil moisture levels are currently near normal and wetter than this time last year. The prevalence of rain-bearing weather systems during the first half of October will likely maintain these conditions.
- Soil moisture levels are about equally likely to be below normal (45% chance) or near normal (40% chance) while river flows are most likely to be below normal (45% chance).
The full probability breakdown is:
|
Temperature |
Rainfall |
Soil moisture |
River flows |
|
|
Above average |
65 |
25 |
15 |
20 |
|
Near average |
30 |
40 |
40 |
35 |
|
Below average |
05 |
35 |
45 |
45 |
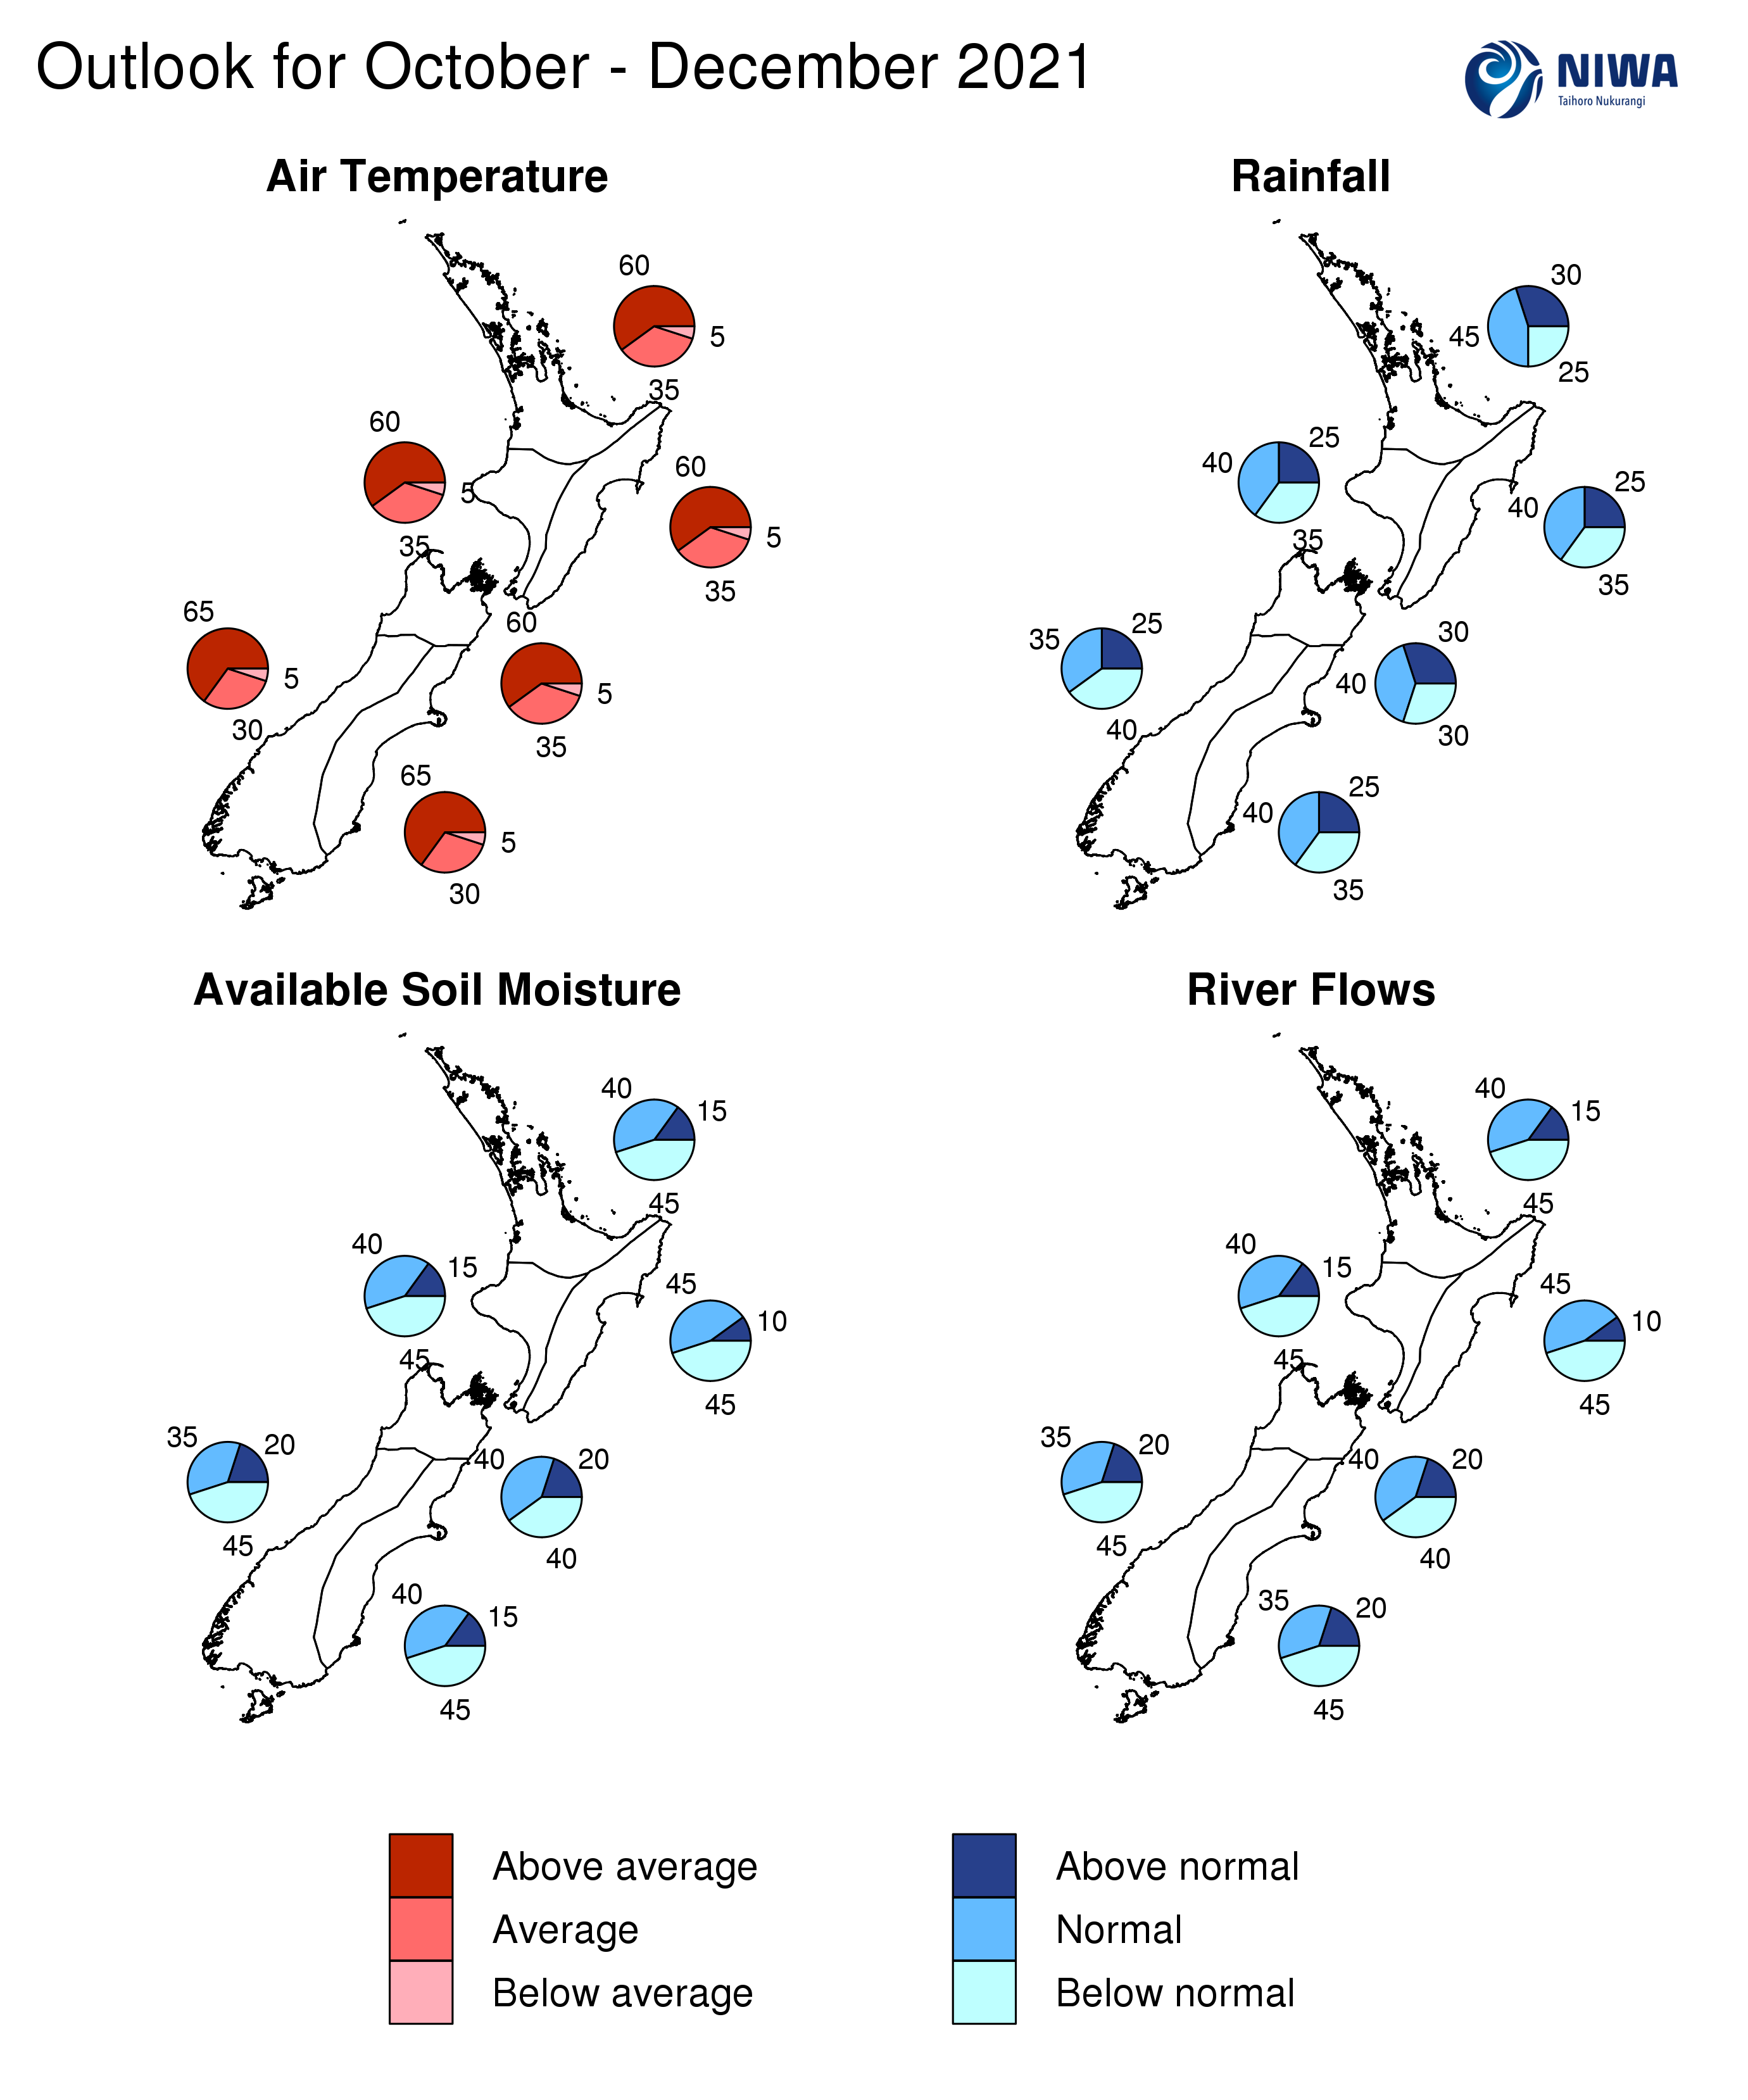
Graphical representation of the regional probabilities
Background
The NINO3.4 Index anomaly (in the central Pacific) during September (through the 26th) was -0.23˚C. Compared to this time last year, conditions are about 0.5˚C warmer. The Southern Oscillation Index (SOI) was +0.8 during September, on the La Niña side of neutral. Notably, the three-month average SOI was +1.0, in La Niña territory.
During September, upper-oceanic heat content again decreased across the equatorial Pacific. Importantly, the cooler conditions relative to average remain displaced toward the west-central part of the basin, aligned with a non-traditional type of La Niña.
Although upper oceanic heat content is below average, sub-surface conditions show that cooler than average conditions are discontinuous across the upper 300 metres of the ocean. A cooler than average layer at depth (100-200 metres) is abutted by a narrow layer of near or slightly above average ocean temperatures around a depth of 50 metres. This indicates that the oceanic progression toward La Niña is lagging behind what occurred last year.
Trade winds were enhanced in a widespread fashion across the tropical Pacific during September, which contributed to additional cooling at the ocean’s surface. Enhanced trade winds are expected to continue during the next three months as the ocean continues to progress toward La Niña thresholds.
A negative Indian Ocean Dipole (IOD), referring to well-above average SSTs in the tropical eastern Indian Ocean, continued during September. This teleconnection, or climate pattern related to another across a long distance, continues to support an ocean-atmosphere system that is trending towards a La Niña-condition.
On the balance of evidence, La Niña conditions are favoured to develop during October to December period (60% chance), peaking at a 65% chance between November and January.
During September, convective forcing was focused over the Maritime Continent, eastern Indian Ocean, and Africa, while convection was strongly suppressed over the eastern Pacific. This was in response to building La Niña-like conditions and a negative Indian Ocean Dipole event.
This low-frequency forcing was weakly expressed as phases 2-4 in the Madden Julian Oscillation (MJO) phase space. An atmospheric Kelvin wave was moving across the Pacific during mid-to-late September. This mode of intra-seasonal variability likely influenced changeable weather patterns across the Southwest Pacific region during the month.
Looking ahead, the active phase of the MJO is expected to move into the Pacific during the first half of October (phases 5-6-7), likely resulting in periods of unsettled weather and generally warmer temperatures for New Zealand. The suppressed phase of the MJO is expected over the Pacific during the second half of October into November, although some variability will remain possible, influenced by the relatively weak flavour of ENSO.
During November and particularly in December, a cell of suppressed convection may begin to stand over the western Pacific (Niño 4) as a central Pacific La Niña develops further. Overall, ENSO-related tropical forcing patterns look less developed than this time last year, which will most likely translate to more variability in NZ’s short-term climate patterns.
The Southern Annular Mode (SAM) was positive through September. This was associated with lower than normal pressure at the pole and higher than normal pressure across large parts of the Southern Hemisphere’s mid-latitudes, although not over New Zealand. In early October, higher pressures are expected to contract poleward, which may result in the SAM becoming negative for a time. The SAM is expected to remain in its positive phase for more time over the next three months, however.
New Zealand’s coastal water temperatures were warmer than average during September, ranging from 0.4˚C to 1.0˚C above average. Anomalies decreased slightly compared to August, but are expected to increase over the next three months. This is expected to have an upward influence on air temperatures.
NZ coastal SST anomalies (through 28 September)
|
North NI |
0.43˚C |
|
West NI |
0.82˚C |
|
East NI |
0.58˚C |
|
North SI |
0.86˚C |
|
West SI |
0.92˚C |
|
East SI |
0.97˚C |
Forecast Confidence
Temperature
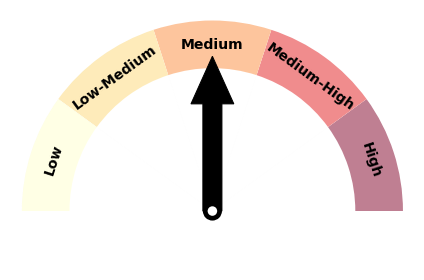
|
Forecast confidence for temperatures is medium. September featured near average temperatures around New Zealand for the first time since February. While some variability is expected to continue during October, above average sea temperatures and a tendency for more northeasterly winds will elevate the chance for above average seasonal temperatures. |
Rainfall
|
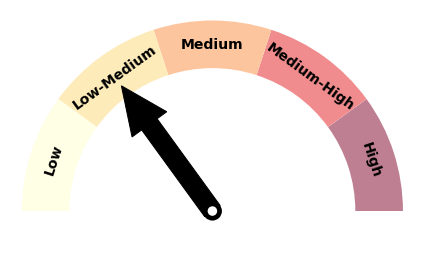
|
Forecast confidence for rainfall is low to medium, a slight decrease compared to last month. With La Niña yet to become firmly established in the Pacific, variability is expected to continue to be a feature in New Zealand’s climate. There is multi-model agreement on high pressure systems occurring more frequently near and east of the South Island, which is expected to increase the chance for drier patterns with time. |
